McCormick (MKC) delivered Q3 adjusted EPS of $1.12, an 8.7% increase from last year, and above consensus expectation of $1.03. Better yet, MKC raised guidance range from $4.05-$4.13 to $4.20-$4.24. The bottom of the new range is above all street estimates. The acquisition of Reckitt Benckiser’s (Frank’s hot sauce) has been more accretive than expected. MKC is up 5% on the positive news. Continue reading “McCormick Strong Results Q3 2017”
Month: September 2017
Black Knight Spin-off
Black Knight Financial Services spin-off from Fidelity National (FNF)
Price: $43.45 P/E FY1: 31.6 No Dividend Continue reading “Black Knight Spin-off”
Global Macro – earnings rally
An interesting slide deals with the continuing global equity rally. While there is merited concern about equity valuations, it is important to note that much of the run-up has been backed by earnings growth dating back to the end of 2015. We are now in the most synchronous global economic recovery since the financial crisis. Continue reading “Global Macro – earnings rally”
SSGA Chart Pack – Looking at Equity Factors
SSGA SPDR ETFs Monthly Chart Pack – September 2017
Attached is the September chart pack from SSGA. Below is one slide that shows monthly performance of the various equity factors in the U.S. YTD.
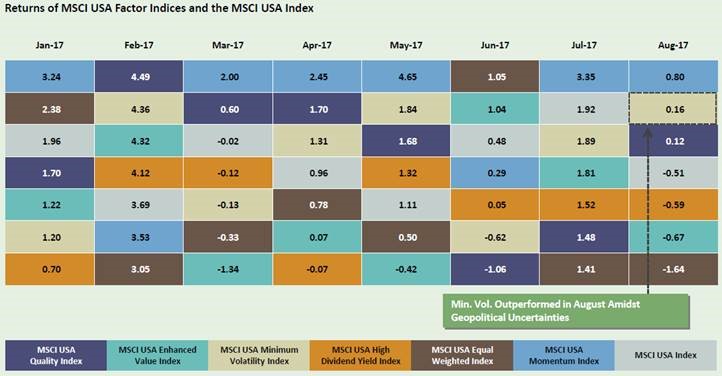
While this is a relatively short time period, it is a good example of why it makes sense to own more than one factor ETF. During the year, momentum (growth) performance has picked up while quality and minimum volatility have lagged on a relative basis. However, in August, we saw a spike in market volatility due mostly to geopolitical concerns.
This was the first spike that we have seen in some time. Minimum volatility held its ground with positive absolute and relative performance during the month, and importantly, acted in the way we would expect (outperforming during periods of uncertainty).
For clients that may ask why they own multiple equity ETFs (growth, quality, low volatility) this is just one simple example of how different factors balance one another out while reducing the overall risk of the portfolio.
“Wake me up when September ends” 9/7/17
September is considered the worst month for stock returns. The average return for the S&P 500 index for September is -0.7% (Since 1950). Additionally, recent negative news could affect stocks – Hurricanes Harvey and Irma, debt limit talks (delayed until December), North Korea nuclear tests and more Washington gridlock. The strong stock market optimism from the beginning of this year has faded pulled back. Finally, stock market valuations are above average, so what goes up must come down, right? Continue reading ““Wake me up when September ends” 9/7/17″