Market volatility is the rate at which prices increase or decrease over a certain period of time. One way to measure the implied volatility of the S&P 500 is the VIX.
The VIX is a volatility index comprised of options, with the price of each option reflecting the market’s expectation of future volatility. Increased put prices will indicate an expectation for greater volatility. It is important to note that the VIX measures 30-day implied volatility so this is not a tool used to predict long term market movements. Below is a link that breaks down the equation used to measure the VIX:
https://www.cboe.com/micro/vix/vixwhite.pdf
In this piece, the goal is to get a perspective on the low volatility levels experienced in 2017 and set expectations for what may occur as volatility begins to tick upward. While we are not predicting a major market correction in 2018, we want clients to be aware that it makes sense to expect increased volatility. In turn, we want to emphasize that maintaining a diversified portfolio provides downward protection during periods of equity selloff.
1.) Market Volatility at Historic Lows

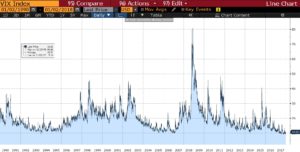
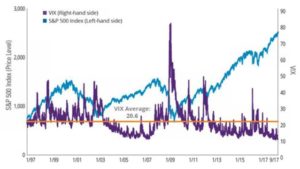
In November of 2017, the VIX recorded its lowest close of 9.14 since inception. At its peak, the VIX reached 80.86 in November of 2008. The VIX historical average has been right around 20.
In general, a reading over 30 is associated with a large amount of market volatility while a reading below 20 is indicative of less stressful or complacent times in the market.
2.) Market volatility and returns are negatively correlated but volatility is a lagging indicator

In general, equity market returns move in the opposite direction of the VIX. This makes sense as the expected volatility is driven by increased fear in the markets. However, the VIX is generally a lagging indicator for long term market selloffs, and at best, coincides with negative returns in the short term.
For example, the VIX fell to sub-10 levels in early 2007 and slowly creeped back upwards toward long term averages by year end. There was not a significant spike in the VIX until after Bear Sterns and Lehman Brothers fell in the summer of 2008. The argument is that a low VIX reading is not necessarily indicative of an immediate anticipated selloff.
While we are currently witnessing historically low volatility, extended periods of limited volatility have occurred in the past, as we saw from 2003-2007. The idea is that a low VIX reading is likely going to move back upward over time but is not indicative of future long term returns. It is possible that this lower volatility environment could be extended at below average levels.
3.) Maintaining a diversified portfolio should protect during periods of increased volatility

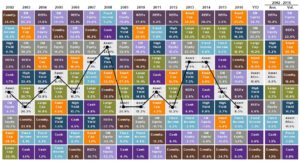
This is a chart that everybody has seen before but it helps to emphasize that a diversified asset allocation reduces volatility while providing positive returns over time. We believe our portfolios are structured to protect clients as volatility does begin to rise within equity markets.
