Good Afternoon,
Attached is the September Chart Pack from SSGA. Below are graphs that discuss equity market returns and flows, inflation and the Fed, and current bond asset class positioning.
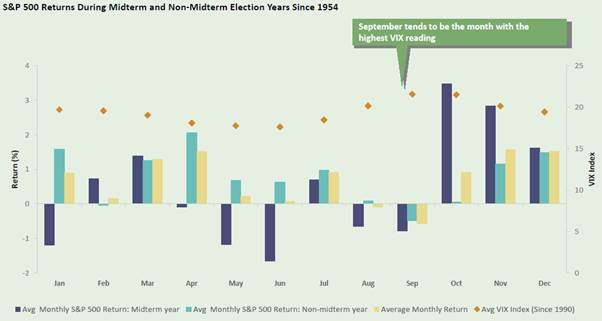
Equities During Midterm Election Years: The fourth quarter months tend to have very strong performance during midterm election years.
Asset Flows: Investors continue to pile into U.S. equities given the supportive economic backdrop.
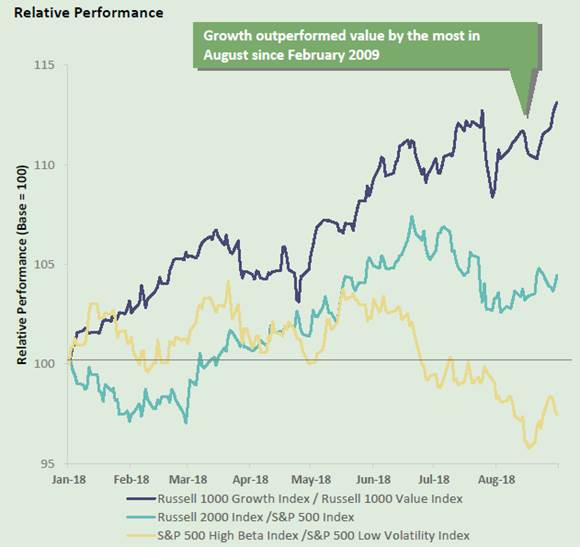
Stressing Growth vs. Value: growth outperformed value by the most in August since February 2009.
The Fed and Inflation: Given that the core PCE inflation rate reached the Fed’s target level, the probability of another rate hike in September is near 100%.
Bond Market Yield, Duration, and Spread: yields of traditional bonds remain below historical averages while average duration continues to increase.
Peter Malone, CFA
Research Analyst
Direct: 617.226.0030
Fax: 617.523.8118
Crestwood Advisors
One Liberty Square
Suite 500
Boston, MA 02109


