MSFT Q1 Earnings

Current Price: $108 Price Target: $120

Position size: 5% TTM Performance: 28%

Microsoft reported a very strong quarter, easily beating on top and bottom line. Revenue was $29B (+18 YoY) vs $27.9B estimate. And EPS was $1.14 (+33% constant currency), well ahead of $0.96 estimate. Guidance was also better than expected. 2Q19 guided to revenue of +10-13%. Hybrid cloud momentum continues, cloud margins are improving and numbers getting raised since they reported. They were very positive about the overall environment. On the call management said they continue “to benefit from favorable macroeconomic and spending trends.”

Key Takeaways:

· Solid double digit growth across all 3 segments:

o Productivity and business processes grew 19%. Guided in-line with the street.

o Intelligent Cloud grew 24%. Fastest growing segment with lowest margins, but margins are expanding (+400bps YoY). Revenue guidance higher than the street.

o More Personal Computing grew 15%. Revenue guidance higher than the street. Gaming revenue increase 44%. Xbox Live monthly active users grew 8% to 57 million. Surface revenue grew 14%. Seeing continued Windows 10 traction with enterprises.

· Commercial Cloud revenue (consisting of Office 365 Commercial, Azure, Dynamics Online, and LinkedIn Commercial, so pulls from the first 2 segments) was $8.5B, +47% YoY.

o Within Commercial Cloud, Azure grew 76%. That suggests annualized revenue of about $11B.

o Azure gross margins continue to improve.

· Management expects a neutral YoY FX environment for revenue and a ~100bps headwind to COGS and operating expenses in F2Q19.

· GitHub acquisition will close by end of this year and will be included in the Intelligent Cloud segment.

· Nadella continues to try to differentiate them as the vendor enterprises can trust. In advocating for their cloud solution, he said “no customer wants to be dependent on a provider that sells them technology on one end and competes with them on the other.” A clear attempt to contract them to AWS.

Valuation:

· FCF in the quarter was $10B. Returned $6.1B to shareholders ($3.5B in dividends and $2.6B in share repurchases).

· Trading at >4% FCF yield – reasonable for a company with double digit top line growth, high ROIC and a high and improving FCF margins.

· They easily cover their 1.7% dividend, which they have been consistently growing.

· Strong balance sheet with about $136B in gross cash, and about $60B in net cash.

· Price target based on ~30% FCF margins and mid-to-high single digit top line growth.

Investment Thesis:

· Industry Leader: Global monopoly in software that has a fast growing and underappreciated cloud business.

· Product cycle tailwinds: Windows 10 and transition to Cloud (subscription revenues).

· Huge improvements in operational efficiency in recent quarters providing a significant boost to margins which should continue to amplify bottom line growth.

· Return of Capital: High FCF generation and returning significant capital to shareholders via dividends and share repurchases.

$MSFT.US

[tag MSFT]

Sarah Kanwal

Equity Analyst, Director

Direct: 617.226.0022

Fax: 617.523.8118

Crestwood Advisors

One Liberty Square, Suite 500

Boston, MA 02109

www.crestwoodadvisors.com

Alphabet 3Q18 Earnings

Alphabet reported mixed Q318 results, they reported a slight miss on sales and beat on EPS, though operating income was lower than expected. Currency (1% drag) and traffic acquisition costs (TAC) were headwinds. Net advertising revenues were up 21% to $27.2B vs consensus $27.3B. Revenue from Google sites decelerated from 26% last quarter to 22% this quarter. Mobile search and YouTube continue to drive ad revenue. Other revenue, which includes cloud, was up 29%. This quarter follows a similar trend of rising expenses and higher capex impacting profitability as they “invest ahead of growth,” particularly, cloud, YouTube and hardware. Higher operating expenses are largely related to head count increases in R&D (tech talent) and sales & marketing. TAC was consistent with last quarter at 23% percent of revenue. TAC is the largest cost of revenue and high TAC levels have been driven by the mix shift to mobile and to programmatic.

[MORE]

Key Takeaways:

· They are seeing broad based strength in the global ad market with the US growing 20% and APAC growing 30%.

· Amazon ad business is growing ahead of expectations, though still a small percentage of share. Over 50% of product searches are initiated on Amazon…this presents a big ad opportunity for them.

· Google is experimenting with newer ad formats on Maps aimed at “local search” which they view as big opportunity.

· Capex may remain elevated, as they are “very focused on ensuring that we have the needed compute capacity to support growth.” Relative to last year, datacenter construction is an increasing % of their CapEx. They are currently developing more than 20 datacenter sites globally and spending on network infrastructure, e.g. constructing undersea cables.

· Project Stream – game streaming technology with real-time interactions. Pichai called it, “one of the most important technological advances I’ve seen in a while.”

· In the Other Bets segment, which is collectively about 1% of revenue and losing money, Waymo has been piloting driverless cars in Phoenix, AZ and is exploring applying their technology for logistics for last mile delivery solutions in cities.

Valuation:

· FCF for 2019 is expected to be $34B or about a 4.5% FCF yield.

· $102B in net cash, $145/share.

Thesis on Alphabet:

· Online advertising as a share of overall Ad budgets will continue to grow as:

o People spend more time on the internet/mobile internet vs tv, radio, newspapers etc

o Higher ROI (+ easier to measure) per marketing dollar spent online vs other ad mediums

· They are the global leader in search.

· Well positioned to benefit from increased smartphone penetration.

· Flexible business model provides operating leverage with high returns ROIC and huge free cash flow generation.

$GOOGL.US

[tag GOOGL]

Sarah Kanwal

Equity Analyst, Director

Direct: 617.226.0022

Fax: 617.523.8118

Crestwood Advisors

One Liberty Square, Suite 500

Boston, MA 02109

www.crestwoodadvisors.com

PLEASE NOTE!

We moved! Please note our new location above!

Colgate CL 3Q18 earnings review

Key Takeaways:

Revenue were down 0.5% during the quarter. While pricing was better, volume impacted the overall sales number. In emerging markets, seen as the growth driver for the company, organic sales fell 2% (due to difficulties in Brazil and China). Gross margins missed as well, not surprising as transportation and raw material costs increase and market share eroded. Market share currently stands at 41.9% globally in toothpaste and 32.2% in manual toothbrush. The company is working on it country by country, and a relaunch of Total and oral care should help address this issue in early 2019.

Another negative tainted this earnings results, as the management team lowered yet again its 2018 earnings guidance to $2.95-2.98 which represents only 3-4% EPS growth thanks only to share repurchases.

They lost some volume in Brazil after the recent price increase, as competitors did not follow their lead. The launch of new premium products in the pharmacy channel should help going forward.

Two trends to note about China:

1/premiumization of categories led by some local brands.

2/change in consumption patterns and shopping environment (e-commerce – nothing new). To address those problems, they are bringing Elmex (premium toothpaste) to the online channel with the electric toothbrush and a whitening kit.

Europe grew nicely this quarter. India saw volume and price growth, as share improved after innovation & advertising support. This is supportive of their strategy to focus on innovation & advertising to sustain growth going forward.

They are now OK with changing the shape of the portfolio: now less global brands and more local retail/local brands in response to competitors if its needed.

While the stock has done poorly year-to-date and the market share decline (and its impact on financial results) is concerning, 2018 could prove to be the worst year for Colgate as the management team finally addresses the problems by being more local/nimble and flexible on distribution channels. There is not much they can do regarding raw materials and transportation costs increases if scale diminishes, but as market share improves and brand regains its strength, pricing increase to offset this problem should alleviate any earnings disappointments.

The Thesis on Colgate

  • High exposure to fast growing emerging markets (36% of Operating Profit from Latin America; 50%+ from EM)
  • Defensive Product set (soap and toothpaste). Product line less vulnerable to trade downs due to low private label exposure in the categories
  • Strong balance sheet (net debt/ebitda 1.4x) and highest ROIC in the sector
  • 2.64% dividend yield

$CL.US

[tag CL]

Julie S. Praline

Director, Equity Analyst

Crestwood Advisors

UNP 3Q18 earnings recap: good average volume growth but negative mix

Key Takeaways:

Current Price: $140 Price Target: $145

Position Size: 2% 1-year Performance: +27%

UNP reported revenue growth of +9.6% (total car load volume +5.9%, average price +3.9%), an operating ratio of 61.7% impacted by core price deceleration and 2% negative mix (23% frac sand volume decline). Tariffs impacted agriculture products exports (grains) so the company didn’t experience the usual increase in volume for this time of year. A disappointment year-to-date has been lower savings then initially targeted ($45M vs $300-350M announced early 2018). Operating ratio will not improve in 2018, but should in 2019 from productivity improvements (see comments below). On the positive side, UNP didn’t loose time implementing its PSR principles, starting with the deteriorating frac sand segment, which should improve economics. UNP also sees room to improve its network as they currently have low track densities vs. competitor BNSF. So far we remain skeptical on UNP’s ability to improve its operating ratio next year as they implement the PSR principles and will keep monitoring the progress they make.

UP 2020 plan update:

+$500M productivity improvements in 2019 thanks to lower employee expenses and benefits of running smaller locomotive and car fleet – which is achievable regarding of volume growth (to us this is a "show me" story)

Accelerated share buyback program to $20B through 2020 (was 410.6B in the past 3 years)

Continue reading “UNP 3Q18 earnings recap: good average volume growth but negative mix”

LMT 3Q18 earnings recap

Key takeaways:

Current Price: $309 Price Target: $388 NEW (old $374)

Position Size: 3.11% 1-year Performance: -3.6%

This week LMT released their 3Q18 earnings with sales +16% y/y (including an extra week vs. last year), operating margin +200bps y/y, and EPS +55%. Next quarter’s organic growth will not be as impressive, as the company is guiding to -1.4%, again due to calendar effect (+/- 1 week). Lockheed introduced its initial 2019 guidance. While the sales growth is above consensus numbers, the margins are slightly below, due to lower JV income in Space Systems. LMT typically increases its guidance throughout the year, and we expect them to do so again in 2019. For example, in October 2017, the sales growth guidance was 2%, and is now 6%, while margin was initially 10.3-10.5% and now 10.9%. Key positives items supportive of LMT growth are:

· The US Defense budget should continue to grow supported by continued security threats. Other countries see increase in spending as well: India, China and Japan. Europe’s defense budget is increasing as well, pressured by the US to spend more on military expenditures

· Accelerating F-35 production

· Ramp-up of Sikorsky’s CH-53K program (the aircraft’s name is “King Stallion”…who thought of that name? Rambo?): https://www.lockheedmartin.com/en-us/products/sikorsky-ch-53k-helicopter.html . The current pipeline is for 200 helicopters worth $25B

· Missiles: production capacity is being expanded as inventory level were shrinking and demand was well above production

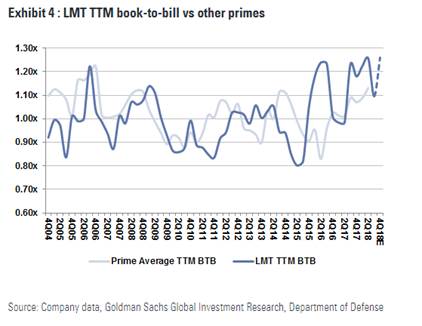
· Overall a healthy book-to-bill ratio (most likely to be at 1.25x by year end) – above 1 showing greater future demand than items currently shipped – is reassuring for 2019’s growth trajectory

· Strong balance sheet: net debt/EBITDA is down to 1.5x following the Sikorsky’s acquisition. This leaves room for LMT to do more deals

We updated our model and now see a $388 price target.

[more]

2018 guidance update:

Sales $53B (vs $51.6-53.1B prior guidance)

Operating margin $5.8B (vs. $5.575-5.725B prior)

EPS $17.50 (vs. $16.75-17.05 prior – $0.40 from better operational results, $0.20 from tax rate)

FCF should improve in 4Q as pension headwinds end (they are typically important for Defense companies)

Initial 2019 Guidance:

Sales growth 5-6% (current consensus is 5.2%)

Operating margin 10.5-10.8%, below consensus at 10.9%. The 10-40bps decline in margin is due to the loss of the JV income and mix (a growing number of new program starts next year)

$1B share repurchases

FCF will be affected by the new programs starts in 2019-2020, increasing the need for working capital.

LMT Thesis:

· Lockheed Martin is a primary beneficiary from the replacement cycle for aging military aircraft and ships

· Excellent management team focused on returning capital to shareholders

· Strong cash flow and financial position

[category earnings] [tag LMT] $LMT.US

Julie S. Praline

Director, Equity Analyst

Direct: 617.226.0025

Fax: 617.523.8118

Crestwood Advisors

One Liberty Square

Suite 500

Boston, MA 02109

www.crestwoodadvisors.com

Stocks erase gains for 2018

Stock markets have continued to fall, erasing YTD gains. As with our 10/11/18 client blast (part of which is pasted below), there is no one overriding source of concern driving the selling. Highlighting this randomness is Marketwatch who offers a list of no fewer than 20 potential market ailments – click here. We believe that rising rates, trade negotiations and slowing global growth top the concerns, but see no need to stoke fear trying to capture every imaginable concern. Certainly, as the Federal Reserve withdrawals liquidity from the economy volatility has increased to more historical levels. As discussed in our last note, the US economy is still on solid footing and we remain committed to investing for the long term.

Perhaps a few reminders on Crestwood’s portfolio construction will help clients. We have built our portfolios considering the effects of both market downturns and upturns:

· Crestwood equities focus on quality stocks (or funds owning high quality stocks) with high returns on invested capital which we expect to outperform through a market cycle. This statement does not mean that every time stocks go down we outperform. In fact, the Focus Equity list has underperformed this week. However, we do expect our stock selection process to add value over time on the downside.

· Our fixed income portfolio focuses on quality bonds, which tend to perform well when stocks fall. In the beginning of last year, we reduced floating rate notes due to their exposure to credit risks.

· We own alternatives investments which diversify the portfolio and serve to reduce risk. Obviously, AQR has notably underperformed this quarter, but REITs have outperformed (QTD down -3.0% versus S&P 500 down -7.2%). We believe that the alternatives through a market cycle will provide added diversification, enhancing returns, should stocks lag.

If clients are nervous about the current quarter of earning releases, here are some points from the end of last week showing how strong results have been:

· Earnings Growth: For Q3 2018, the blended earnings growth rate for the S&P 500 is 19.5%. If 19.5% is the actual growth rate for the quarter, it will tie the mark for the third highest earnings growth since Q1 2011 (also 19.5%).

· Earnings Scorecard: For Q3 2018 (with 17% of the companies in the S&P 500 reporting actual results for the quarter), 80% of S&P 500 companies have reported a positive EPS surprise and 64% have reported a positive sales surprise.

· Valuation: The forward 12-month P/E ratio for the S&P 500 is 15.9. This P/E ratio is below the 5-year average (16.3) but above the 10-year average (14.5).

Hopefully these points help your communications with clients.

Thanks,

John

Client blast from 10/11/18:

We can’t predict the markets or investor behavior, but fundamentals remain sound. Importantly, the U.S. economy remains on a healthy growth track. A driving force in the current jump in GDP growth has been the tax cut stimulus which is expected to continue until the middle of next year. Valuations are modestly elevated but have improved meaningfully this year with earnings growth averaging over 20%. The Federal Reserve continues to gradually increase short-term interest rates. With Federal Funds at 2.00%-2.25%, the Federal Reserve have moved monetary policy from ‘accommodative’ to ‘neutral’, but remains far from restricting economic growth. Inflation throughout this recovery has been stubbornly low with the latest CPI of only 2.3%. There is little need for the Federal Reserve to hike rates aggressively, and the Federal Reserve has been very clear in their intent to move cautiously. We view these rate increases as a return to normal rather than a threat to growth.

Volatility is normal. Each year the markets have some decline that averages 13.8%. Below is a chart that indicates largest drawdowns relative to total returns on an annual basis (click to enlarge):

70dcb562-90b0-41e2-a756-4071b041dd52.png

It is paramount for all of us – investors, managers and clients – to remember to stick to our long term investing goals. Market dislocations like the past two days are common and may become more frequent as market volatility increases back toward normal historical levels. The worst response is to sell stocks after they have fallen, turning a temporary loss into a permanent one. Your asset allocation is based on your long-term goals and the ability to handle market volatility. Keeping a focus on those goals and constraints is far more important than daily changes in stock market prices.

John R. Ingram CFA

Managing Director

Asset Allocation and Research

Direct: 617.226.0021

Fax: 617.523.8118

Crestwood Advisors

One Liberty Square

Suite 500

Boston, MA 02109

www.crestwoodadvisors.com

SHW Q3 Results

Current Price: $372 Price Target: $480

Position Size: 2% TTM Performance: -9%

SHW missed on the top and bottom line. Revenues were $4.7B (+5%) vs consensus $4.8B. Adjusted EPS was $5.68 was below the Consensus $5.74. Excluding all acquisition-related costs and purchase accounting third quarter adjusted gross margin decreased 30bps sequentially and 130bps YoY which illustrates the fact that pricing continues to lag raw material inflation in some parts of the business. Lowered upper-end of full-year EPS guidance despite lower assumed tax rate. The Americas Group operating margin improved while the Consumer & Performance Coatings margins declined YoY. The America’s group is passing on raw materials costs more quickly, and the Consumer Group margins are being negatively impacted from costs to service the new LOW’s retail program. [MORE]

Key Takeaways:

· Revenue growth slowed from 2Q because of slower growth in:

o N. American architectural business. Paint Stores Group same store sales of +5.2% missed expectations. This is a deceleration from +6.8% last quarter, but in line with Q1. Performance in this segment is key as it drives the majority of revenue and even more of their profit. They noted a slower pace of sales growth in some end markets most notably DIY. Weather was also an impact (hurricanes).

o Sequential slowdown in industrial businesses in China.

o Unfavorable currency translation.

· The slowdown in the industrial business in China was expected given PPG’s report last week, and is less impactful to SHW than the disappointing SSS in the architectural business.

· Raw material cost pressure has been “unrelenting and accelerating.”

· During the third quarter they announced an additional price increase in the range of 4% to 6% which took effect on October 1. And they have more pricing already scheduled to roll in.

· Price increases are generally keeping up with raw material cost increases with the exception of the Performance Coatings where price increases are lagging.

· Remodeling activity may moderate next year from a mid-7% growth rate to a mid-6%. So still solid growth.

· They are not seeing moderation in their residential repaint results and more than 80% of the industry is repaint.

· They aim to reduce their leverage ratio to 3x by year end.

· Full year capex should be $265m or 1.5% of revenue.

Valuation:

· Expected free cash flow of $1.7B in 2018, trading at a 4.9% yield. Dividend yield <1%.

· Given growth prospects, steady FCF margins and high ROIC the valuation is still reasonable.

· Balance sheet is fairly levered from the Valspar acquisition, but they expect to get to 3x by the end of the year.

Thesis:

· SHW is the largest supplier of architectural coatings in the US. Sherwin-Williams has the leading market share among professional painters, who value brand, quality, and store proximity far more than their consumer (do-it-yourself) counterparts.

· Their acquisition of Valspar creates a more diversified product portfolio, greater geographic reach, and is expected to be accretive to margins and EPS. The combined company is a premier global paint and coatings provider.

· SHW is a high-quality materials company leveraged to the U.S. housing market. Current macro and business factors are supportive of demand:

o High/growing U.S. home equity values. Home equity supportive of renovations.

o Improving household formation rates off trough levels (aging millennials).

o Baby boomers increasingly preferring to hire professionals vs. DIY.

o Solid job gains and low mortgage rates support homeownership.

o Residential repainting makes up two thirds of paint volume. Homeowners view repainting as a low-cost, high-return way of increasing the value of their home, especially before putting it on the market.

$SHW.US

[tag SHW]

Sarah Kanwal

Equity Analyst, Director

Direct: 617.226.0022

Fax: 617.523.8118

Crestwood Advisors

One Liberty Square, Suite 500

Boston, MA 02109
www.crestwoodadvisors.com

Hilton 3Q Results

Hilton beat on EPS, missed on revenue and gave better than expected RevPAR guidance range for 2019. EBIDTA was $557m vs consensus $555. RevPAR for 3Q was 2% driven entirely by higher rates –this was slightly weaker than consensus. According to the CEO, the lower than expected RevPAR was a result of a calendar shift (adverse mid-week timing of July 4) and weather. They discussed the potential impact of this on the 2Q call. 4Q and full year guidance bracket consensus. The street seemed to be expecting a RevPAR guidance range of 1-3% for 2019, and management guided to 2-4%. Stock is down, but no change in thesis. Investors may be getting concerned it is late cycle, especially given weaker than expected RevPAR trends this quarter. Stocks can trade off in anticipation of this. However, 2019 RevPAR guidance was solid as are supply demand trends. Additionally, Hilton is structurally different than it was last cycle – asset light means less operating leverage and less volatile earnings stream if RevPAR weakens. Moreover, unit growth will aid EBITDA growth when RevPAR does weaken.

[MORE]

Key takeaways:

· Stronger 2019 RevPAR guidance on decelerating supply growth and robust demand indicators.

· Group business is strong. They expect up MSD or better next year. More than 70% is already on the books.

· On 2% RevPAR growth in 3Q, they grew EBITDA 9%.

· Strong pipeline growth for 2019. They are expecting to grow rooms 6-7%. 80% of that is under construction.

· Launched urban, lifestyle micro-hotel brand called Motto.

· Development outlook: 371K rooms in pipeline. Up 11% YoY.

· Loyalty members hit 82m and account for 60% of system-wide occupancy.

· Returned $1.7B to shareholders YTD.

Key Negatives:

· Weaker than expected 3Q RevPAR. This was driven by softer leisure transient demand. This was driven by weather and calendar shift.

· Raised full year EPS guidance, but midpoint below consensus – street was already at the high end of guidance.

Valuation:

· Industry fundamentals remain strong, but HLT and other hotel operators are trading at trough valuations.

· They should do close to $5/share in FCF next year. On today’s price, that’s over a 7% FCF yield on 2019.

· Hilton is more expensive than MAR on a P/E basis, but cheaper on a cash flow basis. More importantly is that both are trading at near trough valuations on both metrics (these charts are as of yesterday).

HLT FCF Yield

Marriot FCF Yield

Hilton Forward P/E

Marriott Forward P/E

$HLT.US

[tag HLT]

Sarah Kanwal

Equity Analyst, Director

Direct: 617.226.0022

Fax: 617.523.8118

Crestwood Advisors

One Liberty Square, Suite 500

Boston, MA 02109

www.crestwoodadvisors.com

MMM 3Q18 earnings: strong sales growth decline and decreased 2018 guidance sends the stock down, but the few 2019 initial comments are positive

Key Takeaways:

Current Price: $188 Price Target: $215 (NEW, prior $220)

Position Size: 2.18% 1-year Performance: -20%

Even though 3M had announced last quarter that 3Q18 sales would see the lowest sales growth of the year, the reported number was below expectations. The pull forward of 3Q18 sales into 2Q18 had its impact as previously highlighted by the company (due to the ERP roll-out in the US). In addition, the following items had a negative impact on sales growth this quarter:

· China’s growth slowed down, especially in industrials

· Lower roof granules demand by shingles manufacturers decelerating production

· An impressive 25% decline in the drug delivery business due to less pharma R&D spending and regulatory cycle

Regarding the Healthcare segment, the management team highlighted that the other businesses were performing well. The drug delivery business is also seeing a strong pipeline for 2019, so a rebound in this category is expected going forward. During the call, it was explained that this business is project-based, and thus more volatile than other healthcare operations they have.

In their consumer segment, the home improvement business had positive low-single-digit sales growth, while all other businesses experienced a decline. Lower demand in Asia Pac and inventory destocking by retailers had a negative impact. As the “office” stores and traditional retailers restructure their operations to a different sales channel (brick-and-mortar to online…who hasn’t heard of Amazon?), inventory have seen that destocking effect. The management team suspects this will continue going forward.

Free cash flow was up 24% y/y, and 3M returned $1.9B to shareholders ($1.1B in share repurchases and $794M in dividends). ROIC is expected to be 20% for 2018. Contrary to last quarter where tariffs had little impact on earnings, the management team now actively looks at ways to change its supply chain, as raw materials costs climbed during the quarter. This should totally be offset by pricing action in the coming months. We are lowering our price target by ~2% to account for slower growth.

Continue reading “MMM 3Q18 earnings: strong sales growth decline and decreased 2018 guidance sends the stock down, but the few 2019 initial comments are positive”

By the Numbers – Market Perspective and Cost of Living

Good Afternoon,

Attached is the most recent “By the Numbers” piece put out by MFS. The stats I point out below put the size of the S&P 500 into perspective and show how cost of living after retirement can unfortunately increase quite drastically.

“When the S&P 500 fell 58 points on “Black Monday” (10/19/87), the tumble represented a fall of 20.5%. A 20.5% decline on last Friday’s (10/19/18) closing index value of 2768 would equate to a fall of 567 points. The largest drop for the index this year has been 113 points (source: BTN Research).”

“The national median cost in 2017 for an assisted living facility (private 1-bedroom accommodation) was $3,750 per month or $45,000 per year (source: Genworth).”

The idea that markets have “fallen X amount of points” is often an easy headline to catch the attention of the average investor. Obviously, it is human nature to hear that markets have fallen 58 points and have a negative reaction. It is our job to temper client reactions by noting that such a drawdown is less than 2% and, while not frequent, such occurrences happen every year and often multiple times.

Another difficult teaching moment for investors is the idea that, later in life, cost of living can increase. The cost of assisted living facilities continues to increase and insurance coverage (or help from children, relatives, charity, etc.) will vary from one individual to the next. This will emphasize the need to grow the nest egg over time by remaining invested in a broadly diversified portfolio built to fit their risk/return profile.

Thank You,

Pete

Peter Malone, CFA

Research Analyst

Direct: 617.226.0030

Fax: 617.523.8118

Crestwood Advisors

One Liberty Square

Suite 500

Boston, MA 02109

www.crestwoodadvisors.com

BTN 10-22-18.pdf