Current Price: $1,191 Price Target: $1,350
Position Size: 4.6% TTM Performance: 18%
Alphabet reported earnings, missing on the top line and beating on EPS. Management attributed the revenue miss primarily to Fx and also the timing of some ad product changes. Total revenue was $36.3B vs. consensus of $37.3B, up 19% constant currency (+17% reported) – that’s a deceleration from 23% in 4Q18. Currency was a $1B headwind, so pretty much all of the miss. This was partially offset by lower TAC which only grew 9%. That put net revenue up almost 19%. Excluding the impact of the EU fine EPS was $10.81, better than consensus of $10.53.
Key takeaways:
· Management attributed the broad-based slowdown to product changes but did not elaborate further. Lack of detail here is largely the reason for the selloff.
· Trend of lower TAC continues – decreased from 24% of rev to 22%.
· Alphabet accrued a 1x fine from the European Commission this quarter for €1.5B ($1.7B) related to agreements in the AdSense business that were found to be in restraint of competition.
· Operating expenses were $12B, up 20% YoY. The biggest increase was in R&D expenses with headcount growth in Cloud as the largest driver.
· Capex of ~$4.6BN decreased materially vs. $7.3BN in 1Q18 as they lapped the purchase of office space in New York City in 1Q18.
· ESG:
o Google data centers use 50% less energy than a typical data center, while delivering 7x more computing power than they did five years ago.
o Since 2017, they have matched 100% of the electricity consumption of their operations with purchases of renewable energy and is now the world’s largest corporate buyer of renewable energy.
Segment performance:
As a reminder, they report in 2 segments: “Google” and “Other Bets.” Google segment revenue is comprised of: Google Sites, Network Partners & Google Other Revenue. The first two are ad revenues and make up the majority of total revenue. Other Revenue includes hardware and cloud. “Other Bets” are their moonshots like Waymo – they’re a tiny part of the business and losing money.
· Google ~$30B in ad revenue, +15% YoY.
o Google Sites: revenues were ~$25B, +17%YoY (includes roughly 2 pts drag from Fx). In terms of dollar growth, results were led again by mobile search with a strong contribution from YouTube, followed by Desktop Search.
o Network: revenues were $5B, +8% YoY, continuing to reflect the performance of the primary drivers of growth, AdMob, followed by Google Ad Manager.
· Other revenues for Google were $5.4 billion, up 25% year-over-year, fueled by Cloud and Play and partially offset by Hardware (slowing growth of premium smartphones resulted in lower Pixel sales). “Today 9 of the world’s 10 largest media companies, 7 of the 10 largest retailers and more than half of the 10 largest companies in manufacturing, financial services, communications and software use Google Cloud.”
· Other Bets – Revenues were $170 m, primarily generated by Fiber and Verily. Loss increased from $600m to ~$900m.
Valuation:
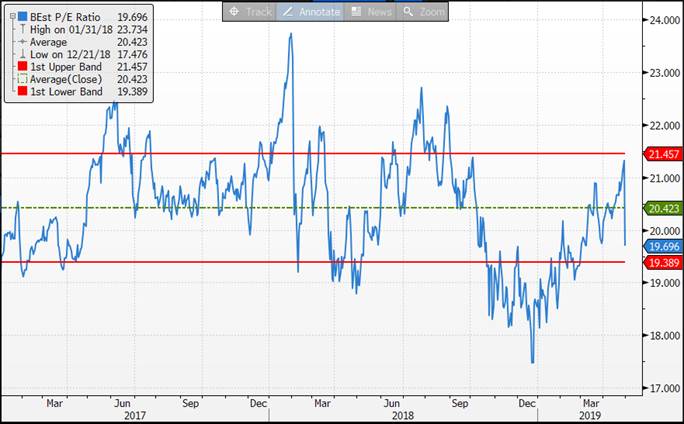
· Trading at below average P/E ratio (see above) and about a 4.5% FCF yield.
· $110B in net cash, 13% of their market cap.
· Repurchased ~$3B worth of shares during quarter. $11B remaining on the existing share repurchase authorization.
$GOOGL.US
[tag GOOGL]
Sarah Kanwal
Equity Analyst, Director
Direct: 617.226.0022
Fax: 617.523.8118
Crestwood Advisors
One Liberty Square, Suite 500
Boston, MA 02109

