Booking Holdings 1Q Results

Current Price: $1,736 Price Target: $2,400

Position Size: 2.5% TTM Performance: -20%

Key Takeaways:

· Beat on bookings, slight miss on EPS, 2Q guidance a little weak. Room nights also better than expected.

· Gross travel bookings were +2% (+8% constant currency). Guidance was for +5-7% constant currency. So better than the high end of guidance.

217 million room nights booked in the quarter, which is up 10% YoY, also ahead of the high-end of guidance (+6-8%). Average daily rates were down 2%.

· Outperformance w/ bookings is an important positive because over the last several quarters they have been trying to “optimize” ad spend which has been resulting in weaker bookings. Their goal is to spend less on performance advertising (e.g. Google AdWords) and more on brand advertising (e.g. TV commercials). The idea is that brand advertising drives direct traffic to their site, resulting in a higher ROI. This ad spend/rev growth algorithm will continue to be a focus going forward as clearly the trade-off between growth and spend persist.

· Weak guidance: slightly disappointing Q2 booking guidance but they have a track record of conservative guidance – they almost always come in ahead of the high end of their bookings guidance on a constant currency basis. EBITDA and EPS guidance also a little light.

· Europe softening – the slow start to the year in Europe that they mentioned last call continues. Europe is a key market for them, so this is clearly a drag on their growth right now.

· FX headwind is expected to be significant this year. Current rates assumed in guidance reduces gross booking growth, revenue growth and non-GAAP EPS growth by 300 bps for the full year.

· Investing for growth: this will reduce their full year EBITDA growth by a few percentage points. This reflects increased spend on brand advertising, customer acquisition and incentive programs and spending to support their new payment platform. They are investing in a payment platform that supports non-hotel properties, and will facilitate growth in transport and local attractions business.

· Alternative accommodations: this is their business that competes with Airbnb and HomeAway. This is growing faster than their overall business.

Continue reading “Booking Holdings 1Q Results”

Disney 2Q19 Results

Share price: $135 Target price: $165

Position size: 2% 1 yr. return: 35%

Disney reported a strong 2Q, beating on revenue and EPS. Revenue was $14.92B (+3% YoY) vs consensus $14.54B and EPS was $1.61 vs consensus $1.58. EPS down 13% YoY because of higher tax rate, tough studio compare, Hulu consolidation and DTC investments. Studio and DTC (direct-to-consumer) hindered 2Q growth, but Studio is already re-accelerating on its robust film slate and 3Q DTC losses guided lower than expected. The Parks segment shined in the quarter and strength here is set to continue as they open the biggest expansion in their history later this year w/ the openings of Star Wars lands at Disney World and Disneyland. Performance at Parks and Studio will help offset drag from DTC investments.

Key takeaways:

· Media networks revenue $5.53B, flat YoY. Cable Networks revenues for the quarter increased 2% to $3.7B and operating income increased 2% to $1.8B. Higher operating income was due to an increase at ESPN. Broadcasting revenues for the quarter decreased 2% to $1.8B and operating income decreased 29% to $247m. The decrease in operating income was due to higher programming costs, lower program sales and a decrease in advertising revenue, partially offset by higher affiliate revenue from contractual rate increases.

· Parks, experiences & consumer products revenue $6.2B (+5% YoY). Margin expansion in this segment continues as operating income increased 15% to $1.5B. Operating income growth for the quarter was due to growth at domestic theme parks and resorts. Domestic Parks continue to fire on all cylinders with revenue up 6% YoY. Star Wars: Galaxy’s Edge openings at Disneyland on May 31st and Disney World August 29th will help continue the successes in domestic attendance and spending gains.

· Studio entertainment revenue (-15% YoY). The decrease in theatrical distribution results was due to lapping Black Panther and Star Wars: The Last Jedi from 2Q last year with Captain Marvel and no comparable Star Wars title in the current quarter. Despite tough compares, studio should drive record summer performance w/ Avengers: Endgame, Aladdin, Toy Story 4, Lion King. This will also support growth in consumer products.

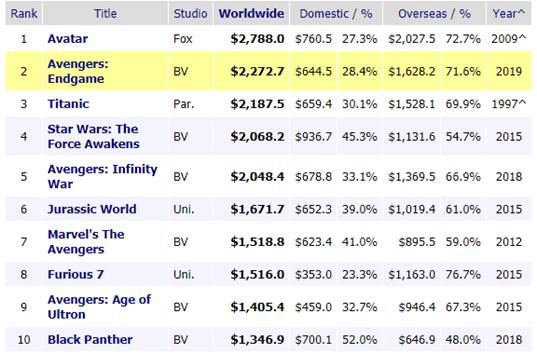
· Avengers: Endgame is now the second-highest grossing film of all time and will stream exclusively on Disney+ starting December 11th. It’s #2 only a couple weeks in, so clearly will take the #1 spot. Amazingly, movies from the Marvel Cinematic Universe (includes Black Panther) make up 5 of the top 10 grossing movies of all time.

· DTC & international revenue ~$1B, +15% YoY. Hulu now consolidated in this segment.

· $2B in merger cost synergies reiterated.

· Discussion on the call about the potential to acquire the 1/3 of Hulu that they don’t own from Comcast. Getting full ownership would help solidify int’l Hulu rollout strategy and Disney+, ESPN+, Hulu bundling strategy.

Global Box Office

Investment Thesis:

  1. Disney is a global media and entertainment company that owns a massive library of intellectual property.
  2. Their competitive advantage is their evergreen brands and synergistic business model. Disney can create content that builds off existing franchises and can be monetized across all their business, giving them the ability to create higher budget, quality content and an ever growing library of IP.
  3. New direct-to-consumer (DTC) initiativewill strengthen synergies between businesses and lead to structurally higher margins and higher multiple on recurring revenue business.
  4. Recent Fox acquisition improves their content positioning and global growth opportunities.
  5. High quality company with solid balance sheet, strong FCF generation and ROIC.

$DIS.US

[tag DIS]

Sarah Kanwal

Equity Analyst, Director

Direct: 617.226.0022

Fax: 617.523.8118

Crestwood Advisors

One Liberty Square, Suite 500

Boston, MA 02109

www.crestwoodadvisors.com

TIREX – Q1 2019 Commentary

TIREX – Q1 2019 Commentary

The TIAA CREF Real Estate Fund outperformed its REIT benchmark during the quarter as nearly all real estate sectors posted double digit returns. The team continues to focus on long-term, growth oriented stocks with superior balance sheets. Improvements in the U.S. economy including wage gains and positive employment numbers are positives for REITs.

Continue reading “TIREX – Q1 2019 Commentary”

HLMEX – Q1 2019 Commentary

HLMEX – Q1 2019 Commentary

The Harding Loevner Emerging Markets Fund outperformed its benchmark during the quarter driven primarily by strong stock selection. The team held onto names that were out of favor at the end of 2018, and these positions bounced back to help the fund return over 14%. The team continues to focus on picking growth oriented names with sustainable long term investment advantages.

Continue reading “HLMEX – Q1 2019 Commentary”

MWTIX – Q1 2019 Commentary

MWTIX – Q1 2019 Commentary

The MetWest Total Return Bond Fund outperformed the Barclays Agg during the quarter as they were helped by duration positioning and legacy asset backed positions. The team believes that the Fed has indicated its future course of action may be swayed by market movements, and we could have possibly reached the end of the current hiking cycle.

Continue reading “MWTIX – Q1 2019 Commentary”

Disney sells remaining RSNs

Disney announced after the close on Friday that they reached a deal to sell the remaining 21 of the 22 regional sports networks that they had acquired from Fox. They announced the sale of the other RSN, the YES network, a few weeks ago. The company was required by the DoJ to sell the RSN’s (w/in 90 days of the deal closing) due to their ownership in ESPN. They received $10.6B for the networks, which was in the range of what was expected. This, along with the $15B raised from selling Fox’s 39% in Sky to Comcast, should help bring Disney’s leverage ratio below 2x.

Sarah Kanwal

Equity Analyst, Director

Direct: 617.226.0022

Fax: 617.523.8118

Crestwood Advisors

One Liberty Square, Suite 500

Boston, MA 02109

www.crestwoodadvisors.com

Update on S&P Earnings

To date, 78% of the companies in the S&P 500 have reported actual results. So far, sales and earnings growth expectations for the quarter have improved.

· 76% of companies have beat on EPS, above the 5 year average. 60% have beat on sales, also above the 5 year average.

· The blended revenue growth rate for Q1 2019 is 5.2%, which has slightly improved.

· The blended earnings decline for the first quarter is -0.8%. Before companies started reporting results, Q1 EPS was expected to be down ~3.5%.

· Positive earnings surprises reported by companies in multiple sectors (led by the Health Care sector) were responsible for the decrease in the overall earnings decline.

· 6 sectors are reporting YoY growth in earnings, led by the Health Care and Utilities sectors. 5 sectors are reporting a YoY decline in earnings, led by the Energy, Tech, and Communication Services.

· 9 sectors are reporting YoY growth in revenues, led by the Health Care and Communication Services.

· For CY 2019, analysts are projecting earnings growth of 3.6% and revenue growth of 4.7%.

· The forward 12-month P/E ratio is 16.8. This P/E ratio is above the 5-year average of 16.4 and above the 10-year average of 14.7.

Sarah Kanwal

Equity Analyst, Director

Direct: 617.226.0022

Fax: 617.523.8118

Crestwood Advisors

One Liberty Square, Suite 500

Boston, MA 02109

www.crestwoodadvisors.com

HILIX – Q1 2019 Commentary

HILIX – Q1 2019 Commentary

The Hartford International Value Fund underperformed its benchmark during the quarter and has now lagged over the past twelve months. During Q1, underperformance was driven by stock selection in financials and materials. The team remains focused on long term results investing in companies that are out of favor but have strong balance sheets and growth potential.

Continue reading “HILIX – Q1 2019 Commentary”

EOG 1Q19 earnings summary

Key Takeaways:

Current Price: $91 Price Target: $115 (NEW)

Position Size: 1.8% 1-year Performance: -23%

EOG released 1Q19 earnings with production levels ~1% above the top end of its forecast, giving some reassurance that they are well on track to deliver on current estimates for 2019. EOG mentioned on the call having 13 years of premium well inventory. Oil production was 20% higher than 1Q18. Increased efficiencies are driving better results at a lower cost, boosting earnings results. Adjusted EPS was 15% above guidance. Capex will be $6.3B for the year and will boost production by 12-16% in 2019 (as previously guided). EOG will use its FCF to strengthen its balance sheet, planning to repay $500m in debt, and $3B total between 2018 and 2021. The company is also boosting its dividend by 31%, a sign that the management team thinks cash flow will remain consistent going forward. Continue reading “EOG 1Q19 earnings summary”

Hilton 1Q19 Results

Share price: $92 Target price: Raising to $105 from $96

Position size: 2.9% 1 yr return: 17%

Hilton beat on revenue and EPS. Revenue rose 6% to $2.2B. EPS was $0.80, +16% vs consensus $0.75 (guidance was $0.73-$0.78). System wide RevPAR grew 1.8% on a currency neutral basis, in line w/ full year guidance of +1-3%. EBITDA was $499m, ahead of the high end of guidance and consensus. As a result, full year EPS and EBITDA guidance was raised. They still expect system-wide RevPAR growth to increase 1-3%. They reiterated their plan to return $1.3-$1.8B in capital to shareholders for the year, equating to 5-7% of current market cap.

Key takeaways:

· Both system-wide and US RevPAR grew 1.8%, outperforming the chain scale weighted industry data due to strong market share gains across all brands and major regions.

· Mgmt points to market share gains as a leading indicator of what should happen with their network effect because that attracts more capital. It’s why you see the pipeline growing and rooms under construction growing. Last year was the first time in history they grew market share everywhere in the world, including the US.

· Group business continues to be solid with RevPAR up 3.7%

· On 1.8% RevPAR growth in 1Q, they grew EBITDA 12%.

· Net unit growth of 7% is running ahead of targeted 6.5% for the year.

· Development pipeline grew to 371k rooms from 364k rooms last quarter – equates to 40% of room count. Over half of pipeline is under construction.

· >50% of pipeline is outside of the US.

· In a sensitivity analysis to a market downturn, mgmt. said they would expect flat to slightly positive growth in adjusted EBITDA and positive growth in free cash flow in an environment where RevPAR were to decline 5% to 6%. This is b/c Hilton is structurally different than it was last cycle – asset light means less operating leverage and less volatile earnings stream if RevPAR continues to weaken. Moreover, unit growth will aid EBITDA growth regardless of RevPAR trends.

· Loyalty members hit 89m from 85m last quarter and account for >60% of system-wide occupancy. Goal is to have 100m members by the end of the year.

· The stock is undervalued, trading at 7.5% FCF yield on 2019.

· ESG: ranked number one on Fortune’s Best Companies to Work For list in the US – the first hospitality company in history and the first non-tech company since 2004 to achieve this number one rating.

Investment Thesis:

∙ Hotel operator and franchiser with geographic and chain scale diversity of 14 brands, 5,400 hotels and 880k rooms across 106 countries (Hilton, Hampton Inn & Hilton Garden Inn ≈ 2/3 of portfolio).

∙ Network effect moat of leading hotel brand and global scale lead to room revenue premiums and lower distribution costs.

∙ Shift from hotel ownership to franchising results in resilient, asset-light, fee-based model.

∙ Record pipeline generating substantial returns on minimal capital will lead to increasing ROIC and a higher multiple.

∙ Unit growth and fee based model reduce cyclicality – Lower operating leverage vs ownership reduces earnings volatility and unit growth offsets potential room rate weakness.

∙ Generating significant cash which is returned to shareholders through dividends and buybacks.

$HLT.US

[tag HLT]

Sarah Kanwal

Equity Analyst, Director

Direct: 617.226.0022

Fax: 617.523.8118

Crestwood Advisors

One Liberty Square, Suite 500

Boston, MA 02109

www.crestwoodadvisors.com