WATFX – Q2 2019 Commentary

WATFX – Q2 2019 Commentary

Western Asset Total Return Bond Fund outperformed the Agg during the quarter and now leads the benchmark by almost nearly 100 bps over the past year. The strategy benefited from its credit exposure and slightly extended duration relative to the benchmark during the quarter. The team expects global growth to be resilient on the back of steady U.S. growth, improving domestic conditions in Europe, and signs that sustained monetary and fiscal stimuli across Asia are gaining traction.

Continue reading “WATFX – Q2 2019 Commentary”

Lockheed Martin (LMT) 2Q19 earnings summary

Key takeaways:

Current Price: $352 Price Target: $388

Position Size: 3.85% 1-year Performance: +12%

Lockheed’s 2Q19 earnings results were once again good with revenue growth of 8% and EPS +23%, thanks to higher fighter jets and missiles sales. With its bookings trend still positive (1.22X book to bill in the quarter, a good indicator for future demand), the revenue growth continues to look sustainable for the rest of the year. Margins expanded 80bps. While the US Government decided to suspend the F-35 deliveries to Turkey, this only represents about 8 planes/year for a total of 100 planes (131 F-35 will be delivered this year, see graph below for out years schedule). There should be minimal supply chain disruptions on the F-35 production from the Turkish situation. Production costs continue to come down as volume goes up and LMT finds opportunities to improve the program’s profitability. Overall this was a solid quarter. A raise of its full year guidance confirms the strength of LMT’s portfolio.

Continue reading “Lockheed Martin (LMT) 2Q19 earnings summary”

SHW 2Q19 – strong performance despite unfavorable weather

Current Price: $488 Price Target: $540

Position Size: 3.2% TTM Performance: +8%

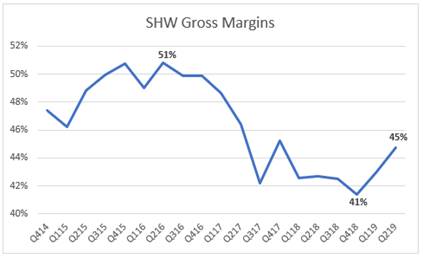
SHW missed slightly on revenue and beat on EPS. The stock is up on better margin outlook and impressive paint stores SSS performance. Margin improvement is expected with re-affirmed full year EPS guidance despite lowered sales guidance. Gross margins improved as recent pricing actions are gaining traction to offset raw material inflation. They expect continued GM improvement on stronger volumes and lower YoY raw materials. Biggest margin improvement in Consumer Brands Group and Performance Coatings, which drove the beat. They also reported strong +4.3% SSS in the Americas Group, an acceleration from last quarter. This was a relief given wet weather, lapping tough SSS, and their competitor, PPG, last week reporting flat SSS in N. America stores.

Key Takeaways:

· SHW is set to benefit from higher product prices, good volume growth, falling raw material costs and an improvement in housing.

· They continue to see softness in Asia and Europe.

· The Americas Group: 55% of sales, +5%

o SSS +4.3%

o Higher paint sales across all end markets in N. American stores and price increases.

o Segment margins increased 50bps.

o Opened 20 net new stores year to date.

o Professional painting contractor customers continue to report solid backlogs and project pipelines going forward.

· Consumer Brands Group: 16% of sales, +3.4%

o Growth due primarily to a new customer program launched in 2018 and price increases

o FX headwinds(-1.6%)

o Segment profit increased to 17.5% from 11.7% in 2Q last year due primarily to selling price increases, good cost control.

o Sales and profitability improved in N. America and Europe, but were partially offset by softer demand in Asia, Australia & New Zealand.

· Performance Coatings Group: 29% of sales, +3.8%

o Soft sales outside North America and unfavorable currency translation. FX headwinds(-2.7%)

o Segment profit increased to 11.4% from 10.5% in 2Q last year due primarily to selling price increases and good cost control.

o Revenue growth in Packaging and coil was more than offset by softness most notably in industrial wood division, which continues to be impacted by tariffs.

o Geographically, sales were up in Latin America and flat in N. America, offset by softness in Asia and Europe where sales decreased by low-double digit and mid-single digit percentages respectively.

· Guidance implies margin improvement:

o FY sales guidance lowered from +4-7% to +2-4%.

o Reaffirmed full year 2019 adjusted diluted net income per share guidance to be in the range of $20.40 to $21.40 vs $18.53 in 2018.
Valuation:

  • Expected free cash flow of ~$2B in 2019, trading at ~4.5% FCF yield.
  • Given growth prospects, steady FCF margins and high ROIC the stock is undervalued. They deserve a premium multiple based on large exposure to the N. American paint contractor market and no exposure to the cyclical sensitive auto OEM end market.
  • Balance sheet leverage from the Valspar acquisition continues to improve; they expect to get to under 3x by the end of the year.
  • Buybacks should accelerate as Sherwin returns to its historical capital allocation.

Thesis:

  • SHW is the largest supplier of architectural coatings in the US. Sherwin-Williams has the leading market share among professional painters, who value brand, quality, and store proximity far more than their consumer (do-it-yourself) counterparts.
  • Their acquisition of Valspar creates a more diversified product portfolio, greater geographic reach, and is expected to be accretive to margins and EPS. The combined company is a premier global paint and coatings provider.
  • SHW is a high-quality materials company leveraged to the U.S. housing market. Current macro and business factors are supportive of demand:
    • High/growing U.S. home equity values. Home equity supportive of renovations.
    • Improving household formation rates off trough levels (aging millennials).
    • Baby boomers increasingly preferring to hire professionals vs. DIY.
    • Solid job gains and low mortgage rates support homeownership.
    • Residential repainting makes up two thirds of paint volume. Homeowners view repainting as a low-cost, high-return way of increasing the value of their home, especially before putting it on the market.

$SHW.US

[tag SHW]

Sarah Kanwal

Equity Analyst, Director

Direct: 617.226.0022

Fax: 617.523.8118

Crestwood Advisors

One Liberty Square, Suite 500

Boston, MA 02109

www.crestwoodadvisors.com

LISIX – Q2 2019 Commentary

LISIX – Q2 2019 Commentary

The Lazard International Strategic Equity strategy outperformed the EAFE benchmark during the quarter, driven by positive stock selection. Global macroeconomic data has continued to slow and it is unclear if the Fed’s loosening of economic policy will be enough to dampen the slow down. This does provide some relative buying opportunities for the team as certain names have heightened valuations backed by lower interest rates.

Continue reading “LISIX – Q2 2019 Commentary”

Schwab Q2 Results – fears around stock are abating

Schwab reported strong Q2 earnings up 8% YoY with an organic asset growth rate of 5%. Investors have been concerned about Schwab’s deposit trends and potential for falling net interest margins due to Fed cutting rates. This quarter’s results seemed to ease some of those fears as trends around Schwab’s deposit base stabilized and outflows from deposits slowed.

Current Price: $ 42.7 Price Target: $53 (20x 2019E of $2.66)

Position Size: 2% Performance since initiation on 6/24/19: 9.1%

Q2 Highlights:

  • Core asset growth of 5% for Q2
    • Core net new asset growth of $37.2b for quarter and $88.9b YTD
    • Growth in Advisor services 9% YoY
  • Net interest margin – 2019 still a concern with falling rates
    • Deposits up 9.2% YoY, but down 8.5% QoQ due to cash sorting and seasonal tax payments
    • Schwab speculated that cash sorting issue is nearing completion as organic net flows to cash sweep turned positive in June
    • Net Interest Margin (NIM) was 2.40% up 10 bips YoY. Expects NIM to be 2.35%-2.40% for rest of year
    • Managing NIM risks in light of falling yields
      • Extending duration to top of range 2.5-2.75 years
      • Increasing fixed portion of portfolio to 70% from 60%
  • Asset Management and trading
    • Schwab Index Mutual Funds AUM $226b up 21% YoY
    • Schwab Index ETFs AUM $144b up 25% YoY
    • Trading revenue fell 3%, but is only 6% of revenue
  • Profitability – industry leader
    • ROE 19% and 46.1 pre-tax profit margin
    • Expenses up 7% while revenue was up 8%
  • Capital allocation
    • Repurchased 29.1m shares during quarter for $1.2b. $2.8b remains of authorized buyback. Buyback yield of 2.13%
    • Dividend yield of 1.4%
    • Shareholder yield of 3.5%

Schwab Thesis:

· Expect Schwab’s vertically integrated business model to drive AUM growth. Schwab has averaged 6% organic core net new asset growth as retail clients and advisors are attracted to Schwab’s low cost trading and custody services.

· Conservative, well-managed firm who is a leader in online trading and focused on leveraging platform.

· Schwab is on the cusp of generating excess capital which they plan to return to shareholders. Expect a 20%-30% payout ratio for dividends (1.7%) and management has approved a $4b share buyback which could amount to 4% to 5% of shares

John R. Ingram CFA

Chief Investment Officer

Partner

Direct: 617.226.0021

Fax: 617.523.8118

Crestwood Advisors

One Liberty Square

Suite 500

Boston, MA 02109

www.crestwoodadvisors.com

MSFT 4Q19 Earnings

Current Price: $139 Price Target: $150

Position size: 6.4% TTM Performance: 31%

Microsoft reported solid Q4 results with better than expected growth in all segments. Cloud continues to be the key driver. Q4 revenue was $31B (+14 YoY constant currency) and EPS was $1.37 (+24% constant currency). Commercial Cloud business was up 39% and saw continued margin improvement, helping to drive op income up 24% constant currency. Counted w/in that is Azure, which was up 73%. They are taking share from Amazon’s cloud offering, AWS. This should continue as they are better positioned as more large enterprises, that are longtime customers, move to the cloud. Just two days ago AT&T chose MSFT’s cloud – one of their largest cloud commitments to-date. Given their enterprise customer base, recent partnerships with VMware and Oracle, and superior Azure hybrid architecture, the company is uniquely positioned to capitalize on the growing demand for cloud services.

Key Takeaways:

· Solid growth across all 3 segments:

o Productivity & Business Processes, up 14% YoY, $11.1B

o Intelligent Cloud, up 19% YoY, $11.4B

o More Personal Computing, up 4% YoY, $11.3B.

· For the full year Commercial Cloud (consisting of O365 Commercial, Azure, Dynamics Online, and LinkedIn Commercial – this includes some revenue from the first two segments above) was $38B. That’s 30% of total revenue, and grew 39% in the quarter.

· Within Commercial Cloud, Azure growth was 64% YoY (68% constant currency) vs. 75% cc last quarter.

· Commercial Cloud gross margins improved 600bps YoY and 200bps sequentially, driven by material improvement in Azure gross margin.

· Similar to last quarter, the only area of weakness was gaming.

Valuation:

· For the full year they returned $30B to shareholders.

· Trading at a 3-4% FCF yield –still reasonable for a company with double digit top line growth, high ROIC and a high and improving FCF margins.

· They easily cover their 1.3% dividend, which they have been consistently growing.

· Strong balance sheet with about $134B in gross cash, and about $56B in net cash.

Investment Thesis:

· Industry Leader: Global monopoly in software that has a fast growing and underappreciated cloud business.

· Product cycle tailwinds: Windows 10 and transition to Cloud (subscription revenues).

· Huge improvements in operational efficiency in recent quarters providing a significant boost to margins which should continue to amplify bottom line growth.

· Return of Capital: High FCF generation and returning significant capital to shareholders via dividends and share repurchases.

$MSFT.US

[tag MSFT]

Sarah Kanwal

Equity Analyst, Director

Direct: 617.226.0022

Fax: 617.523.8118

Crestwood Advisors

One Liberty Square, Suite 500

Boston, MA 02109

www.crestwoodadvisors.com

UNP 2Q19 earnings summary

Key Takeaways:

Current Price: $172 Price Target: $177

Position Size: 1.83% 1-year Performance: +16.5%

UNP reported a 2% revenue decline, but this negative was countered by an operating ratio improvement of 340bps, an all-time quarterly record despite weather related challenges (60bps drag). Total volumes were down 4% but pricing up 2.75%. UNP continues its focus on asset utilization, improving its locomotives productivity (+19% this quarter). UNP expects 2H volume to be down 2% (worse than previously thought) but continued pricing gains. Operating ratio guidance is positive reaching under 61% in 2019, and below 60% in 2020. The company now expects 2019 workforce reduction of 10%.

Adjusted net debt/EBITDA has increased in the past year, now reaching 2.5x, something to keep an eye on if volumes continue to decline. Continue reading “UNP 2Q19 earnings summary”

Crown Castle International ($CCI.US) Q2 2019:CCI Increases AFFO Outlook, Mixed Q2 Results

Crown Castle International Corp. (CCI) had mixed results during the quarter as they raised full year 2019 EBITDA and AFFO guidance but had relatively disappointing results with lower fiber demand and guidance of new small cells at 10,000 for the year, the lower end of expectations. The team discussed the lower fiber demand and reiterated that their concern is with small cells and that the incremental revenue that will come to the fiber business through the small cells is what they are focused on longer term. Discussing the construction of new small cells, the 10,000 number for 2019 is still within range of guidance, but the issues have come from delays in production rather than decreased demand. Because CCI is focused in the largest metro areas, there have been issues dealing with municipalities to get small cells built. CCI benefited from increased tower activity which has driven their increase in full year outlook. However, the long term plan has not changed. CCI is pursuing the expanding small-cell opportunity by focusing on top markets where there is greatest potential demand. The playbook is similar to towers in that they are providing fiber solutions and establishing common asset sites across their customer base. By increasing the number of users on an individual small cell site, they are incrementally increasing cash flow and, in turn, dividend yield for its investors.

Current Price: $126 TTM Return: 18%

Target Price: $130 Position Size: 2%

Continue reading “Crown Castle International ($CCI.US) Q2 2019:CCI Increases AFFO Outlook, Mixed Q2 Results”

JNJ 2Q19 earnings summary

Key Takeaways:

Current Price: $132 Price Target: $150

Position size: 2.58% 1-Year Performance: +6%

JNJ reported 2Q19 earnings results this morning. Total organic sales were up +3.7% and adjusted EPS up +22.9% ex-FX but including the sale of a business unit. The company is seeing good traction in its Consumer segment which seems to have turned around, growing +2.2%. Pharma was lower than in 1Q but still positive with a +4.4% organic sales growth. Medical Devices had a +3.2% organic sales growth, slightly lower than in 1Q. But the good print can’t erase the risks from the baby talc powder and opioid litigations, which remain a major overhang on the stock. JNJ is awaiting a verdict in the Oklahoma case, and a hearing on talc (July 22) will determine evidentiary standard on 85% of all talc outstanding cases. While JNJ as put money aside for its defense costs ($190M in 2Q19), it hasn’t provisioned any money in the event it loses its defense on talc and opioids, which is a risk for the company. The main risk that we do not see priced in the stock is if they did in fact provide drug compounds to Purdue (the market share leader) as many articles mentioned recently. Although JNJ sold the subsidiary that grew poppy seeds in 2016, a judge could draw the conclusion that JNJ’s market share is actually much higher than 10%, and JNJ should be held responsible to a greater level than currently talk about. We continue to monitor this situation as the risk is tangible. Continue reading “JNJ 2Q19 earnings summary”