77% of the companies in the S&P 500 have reported 2Q results …
· # of EPS beats are above the 5 yr. average, # of sales beats are below average. Negative EPS guidance is above average.
· Revenue and EPS growth rates have improved since the start of the quarter:
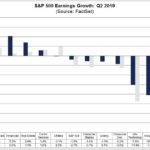
· The blended (combines actual and estimated results) earnings decline for Q2 is -1%. This is better than the -2.7% expectation at June 30. Boeing is the largest contributor to the earnings decline for the entire S&P 500. If this company were excluded, the blended earnings growth rate for the S&P would improve to 0.5% from -1.0%.
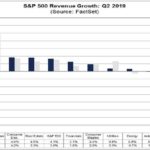
· The blended revenue growth rate for the quarter is 4.1%. This is better than the +3.8% expectation at June 30.
· Companies with more international revenue exposure are reporting a much larger decline in revenues.
· Companies with >50% of revenues outside of the US, have a blended revenue decline of -2%.
· Companies with >50% of revenues inside the US, have blended revenue growth +6.6%.
· EPS beats are driven by healthcare, REITs and energy. Revenue beats also driven by energy and healthcare.
· 8 sectors are reporting growth in revenues, led by Communication Services and Health Care.
· 1 sector (Industrials) is reporting no growth in revenue.
· 4 Sectors are reporting EPS growth led by healthcare and energy.
· 7 sectors are reporting a decline in EPS led by materials, industrials, and tech
· Consumer discretionary has the highest P/E at 21.3x and Financials have the lowest at 11.9x.
· For CY 2019, analysts are projecting earnings growth of 1.9% and revenue growth of 4.4%.
[tag equity research]
Sarah Kanwal
Equity Analyst, Director
Direct: 617.226.0022
Fax: 617.523.8118
Crestwood Advisors
One Liberty Square, Suite 500
Boston, MA 02109


