Key Takeaways:
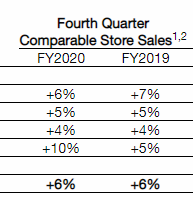
1. Beat driven by higher than expected same store sales of +6% (vs street +3.2% and guidance of +2%-3%).
2. They had strong SSS results across all segments with particular strength in TJX International (Europe/Australia) demonstrating continued share gains. SSS int’l were +10% vs. cons 3.6%.
3. Guidance light, but seems conservative.
4. They have seen no impact from Coronavirus and say it’s too soon to predict any impact. They do not directly source a significant amount of goods from China.
Current Price: $64 Price Target: Raising to $70 from $65
Position Size: 3.7% TTM Performance: 20%
Highlights:
· TJX reported a strong quarter beating on sales and EPS. 4Q EPS of $0.81 vs. cons. of $0.77 and guidance of $0.74-$0.76
· Earnings guidance light, but seems conservative. Both Q1 and FY2021 guidance was slightly below the street, but mgmt. tends to guide conservatively.
· FY2021 guided to EPS of $2.77 to $2.83 per share vs street $2.86 w/ SSS guidance of with comps of 2%-3% vs. consensus of 3%.
· 1Q guided to EPS of $0.59-$0.60 vs cons. of $0.61, with comps of 2%-3% versus cons. of. 3.1%,
· They tend to guide conservatively, with EPS and revenue beating consensus 18 of the last 21 quarters
· Traffic was again the biggest driver of SSS. The fact they continue to grow traffic while many peers are seeing the opposite, validates that their concept is resonating w/ consumers and is a promising indicator for future SSS. E-commerce sales are not included in SSS numbers.
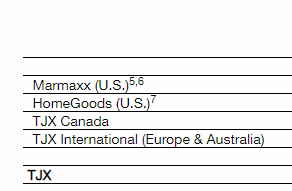
· Marmaxx (their largest segment) – comp sales increased 6%, lapping a very strong 7% increase last year.
· International again had the strongest SSS of +10% – they continue to take share despite a tough retail environment in Europe.
· GM were better than expected on “significantly” higher merchandise margins but somewhat offset by higher SG&A.
· They now have over 4,500 stores, including more than 1,200 outside of the United States.
· They continue to see excellent inventory availability
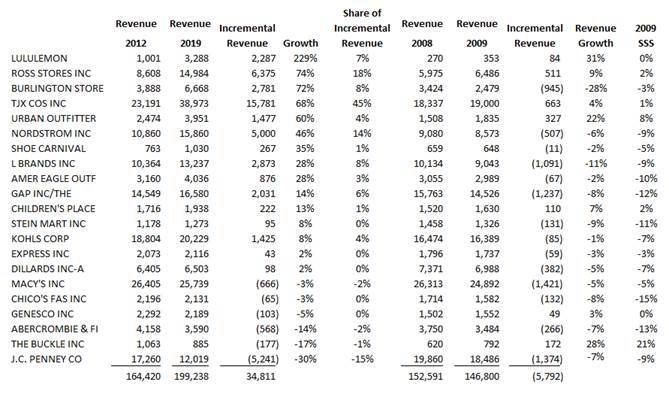
· Chart below demonstrates TJX’s resistance to e-commerce and economic cycles. Despite the ramp in e-commerce share of retail over the last several years, of the companies listed below TJX is nearly half of aggregate incremental spend. The companies listed below represent more than 2/3 of the ~$275B in US apparel retail sales. Additionally, in the ’08 to ’09 period they were one of few retailers that continued to grow and post positive SSS.
 [m
[m ore]
ore]

Valuation:
· Balance sheet is strong. They have no net debt.
· Store openings will bolster top line growth.
· They have been steadily FCF positive, even through the financial crisis they posted 3% FCF margins. LT FCF margins are ~7%.
· Valuation is reasonable at >4% forward yield.
The Thesis on TJX:
· Market leader: opportunity to benefit from a lasting paradigm shift in consumer frugality. Treasure hunters – TJX has strong brands that attract cost conscious consumers– evident through consistently strong customer traffic.
· Strong bargaining power with suppliers due to size.
· Quality: Solid and consistent execution and top line growth driving strong margins through cost cutting/inventory control.
· Shareholder returns: Strong returns, balance sheet and cash flows being used for share buyback program, dividend, and store expansion.
$TJX.US
[tag TJX]
[category earnings]
Sarah Kanwal
Equity Analyst, Director
Direct: 617.226.0022
Fax: 617.523.8118
Crestwood Advisors
One Liberty Square, Suite 500
Boston, MA 02109
