Schwab Q2 results- Strong AUM growth, but falling NIM

On 7/21, Schwab hosted their summer update for Q2 earnings of $.48.  Schwab reported solid core new asset growth of 5% as AUM reach $4.1t. Low interest rates remain a headwind with Net Interest Margin (NIM) falling to 1.53%.  Rising deposits have helped offset falling NIM.  Valuation remains attractive.


Despite lower interest rates, we remain optimistic that SCHW will continue to grow AUM significantly this year, leveraging its platform to drive ESP growth. 


Current Price: $ 34.98                     Price Target: $38 (down from $43)

Position Size:   1.6%                         Performance since initiation on 6/24/19: -9.0%


Q2 Highlights:

·         Total client assets rose to $4.1T, with core new asset growth of 5%. 

o   Client assets are up 11% YoY

o   Brokerage accounts up 18% YoY

o   Core asset growth should remain healthy into 2020 with TD Ameritrade acquisition ($1.2t in AUM) which is expected to close second half of this year.  Combined with core new growth of ~6% shows the potential growth in earnings power for SCHW as they lever their platform.


  • Deposit growth of $24b up 8.6%
    • Schwab continues to increase deposits at a pace faster than AUM growth as market volatility causes clients to raise cash.
    • Investing $24b should increase revenue by $360, which represents a 15% increase in revenue, so these interest earning assets are significant.
  • Net interest margin
    • Net Interest Margin (NIM) was 1.53% falling sharply from 2.14% in Q1, more than offsetting the growth in deposits as interest revenue fell 14%. 
    • NIM bottomed in 2013 at low 1.50%, and SCHW indicated that the floor this time might be 1.40%, so NIM will fall a bit from here.  Hopefully we have already seen the sharpest declines and interest income starts to stabilize.
  • Advice and Funds
    • Schwab fee based advice solutions assets grew $263b up 2% YoY.
    • Schwab revenue from funds and ETFs rose $452m up 2%
    • Trading revenue fell 7%, but trading revenue has fallen to only 7% of income
  • Profitability – industry leader
    • ROE 12% and 40% pre-tax profit margin
    • Expenses up only 8%, of which 6% are due to mergers
  • Capital allocation
    • Schwab will look to issue a preferred stock issue as growth in balance sheet and acquisitions will require more capital.  Share buybacks are on hold.
    • Dividend yield of 2.07%
    • Valuation is attractive at 17x earnings.  Target price set at 20x.

Schwab Thesis:


·         Expect Schwab’s vertically integrated business model to drive AUM growth.  Schwab has averaged 6% organic core net new asset growth as retail clients and advisors are attracted to Schwab’s low cost trading and custody services.

·         Conservative, well-managed firm who is a leader in online trading and focused on leveraging platform. 

·         Schwab will experience material AUM growth with USAA and TD Ameritrade mergers.  Expect SCHW to reduce costs and leverage platform.


Please let me know if you have any questions.

Thanks,

John


$SCHW.US

[category earnings ]

[tag SCHW]


John R. Ingram CFA

Chief Investment Officer

Partner


Direct: 617.226.0021

Fax: 617.523.8118


Crestwood Advisors

One Liberty Square

Suite 500

Boston, MA 02109

www.crestwoodadvisors.com


Travelers (TRV) Q2 results

On 7/23, Travelers reported a Q2 EPS loss of $-.20, in-line with expectations.  Results were hit by catastrophe losses for storms and civil unrest.  Losses related to the pandemic continue to be small (-$50m) partially offset by lower auto incidents.  Positives for the quarter were improving underlying margin improvement and continued strong pricing gains.


Travelers is a high quality, disciplined underwriter of insurance that is focused on returning capital to shareholders through dividends and share buybacks. 


Current Price: $118.61                          Price Target: $120

Position Size:   1.56%                               TTM Performance: -18.3%


Thesis Intact. Key takeaways from the quarter:


  1. Despite cat losses, core business results were solid

·         Combined ratio ex-cats of  91.4% ahead of expected 96.3%

·         Net premiums declined -1%, again ahead of expectations and not bad given environment

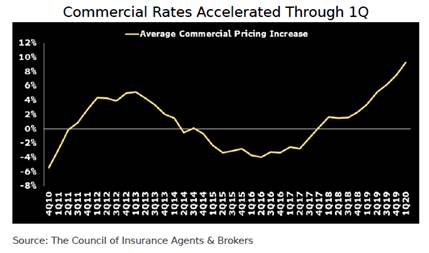
·         Strong pricing with renewal premiums up 2.5% to 7.8%.  The industry has faced several headwinds – higher cat losses, negative tort trends and falling yields.  As a result industry wide pricing has been strongest in 10 years:


  1. Net Investment Income fell $24m due to lower rates.  Non fixed-income investment results were down $-180m as these are reported with a lag of one quarter.
  2. Strong financial position
    • Debt to capital ratio of 23.2%
    • Most of debt is long term – just issued a 30yr bond yielding 2.5%
    • 97.9% of fixed income portfolio is investment grade with average rating of AA
    • Strong rankings from rating agency relative to peers


  1. TRV yields 2.87% – for Q2 2020 TRV did not buyback any share which is the first quarter in 10+ years.
    • First quarter in 10+ years that they did not buyback shares – Many financial companies have delayed share buybacks given optics of current environment
    • Over past 10 year shares outstanding have fallen 53%!
    • Management has a long history of employing capital wisely! Instead of investing in mature business with spotty pricing, they are returning excess capital to shareholders


5.       Current valuation of 12.3 P/E is close to historical mean.  Price target represents 12x 2021’s estimated earnings.


The Thesis on TRV:

  • We expect TRV will be able to grow book value per share in the mid-single digits over the near-medium term, and generate ROE in the 10-14% range
  • Industry leader with disciplined underwriting and investment portfolio track record  
  • Consistent returns in the low to mid double digits
  • Responsible capital allocation and proven desire to act in the best interests of shareholders


Please let me know if you have any questions.

Thanks,

John


$TRV.US

[category earnings ]

[tag TRV]


John R. Ingram CFA

Chief Investment Officer

Partner


Direct: 617.226.0021

Fax: 617.523.8118


Crestwood Advisors

One Liberty Square

Suite 500

Boston, MA 02109
www.crestwoodadvisors.com


MSFT Q4 Results

Current Price:    $203                      Price Target: $224

Position Size:    7.6%                      TTM Performance: 52%


Key takeaways:

·         MSFT beat on revenue and EPS. Total revenue growth was +13% on a constant currency basis.

·         Couple negatives in the quarter. Azure revenue was slightly below expectations…+47% growth vs +49% expected.

Currency was a drag – constant currency, Azure was up 50%. Also guidance was a little below expectations w/ SMB spending a key weak area. But long-term drivers and positioning still very strong.

·         Cloud strength continues to be a key theme – commercial cloud surpassed $50 billion in annual revenue, +36% YoY.

·         Satya Nadella said, “The last five months have made it clear that tech intensity is the key to business resilience. Organizations that build their own digital capability will recover faster and emerge from this crisis stronger”…” over the next decade technology spending as a percentage of GDP is projected to double and we are well-positioned to participate in that growth by innovating and defining the key technologies that empower every person and every organization on the planet to build more of their own tech intensity.”


Additional Highlights:

·         “We are seeing businesses accelerate the digitization of every part of their operations from manufacturing to sales and customer service to reimagine how they meet customer needs from curbside pickup and contactless shopping in retail to telemedicine in healthcare. That’s why we are building the full modern technology stack powered by cloud and AI and underpinned by security and compliance to help every organization digitally transform.”

·         Strength in cloud but some offset w/ slowdown in transactional licensing especially in SMB and LinkedIn ad spending. This is consistent w/ trends they called out in the last few weeks of the last quarter.

·         As previously announced, they closed their ~80 retail stores. $450m charge related to this.

·         Productivity and Business Processes ($11.8B) +8% YoY cc:

o   Cloud usage and demand increased as customers continued to work and learn from home. Transactional license purchasing continued to slow, particularly in small and medium businesses, and LinkedIn was negatively impacted by the weak job market and reductions in advertising spend.

o   Strength especially w/ Office 365 Commercial (up 22%), Dynamics 365 (up 40%).

o   LinkedIn slowed from up 22% last Q to up 11%. Less hiring is weighing on this. Office 365 now has 258 million paid seats.

o   Dynamics 365 is helping organizations in every industry digitize their end-to-end business operations from sales and customer service to supply chain management. BNY Mellon chose Dynamics 365 this quarter to help investment managers build stronger relations with their customers. FedEx uses Dynamics 365 to drive more precise logistics and inventory management. In retail, “Dynamics 365 Connected Store” now offers in-store traffic analytics and curbside pickup prioritizing safety as stores reopen

o   Teams product is really shining for them right now. Accelerating Teams innovation, adding new capabilities. Deeper integration between Teams and Power Platform brings faster application creation and deployment.  Expanding Teams beyond the workplace making it easy to add personnel Teams account on mobile.

o   Teams is not just about having lots and lots of video meetings. Teams is about actually getting work done where meetings and video is one part. The utility of it will only increase w/ mixed office and WFH environment in the future.

o   LinkedIn continues to see record engagement despite revenue headwinds due to lower hiring needs. Now at 706m professionals. Content shared was nearly — up nearly 50%. Professionals watched nearly 4x the amount of LinkedIn Learning content in June than they did a year ago.

·         Intelligent Cloud ($13B) +19% YoY cc:

o   Cloud usage and demand increased as customers continued to work and learn from home.

o   Server products and cloud services revenue increased 21% with Azure revenue growth of 50% driven by continued strong growth in their consumption-based business.

o   With Azure they have more data center regions than any other cloud provider. This quarter, they announced new regions in Italy, New Zealand and Poland…last quarter they added Mexico and Spain.

o   In FY ’20 closed a record number of multimillion-dollar commercial cloud agreements with material growth in the number of $10 million-plus Azure contracts.

o   Enterprise Services revenue increased 2% constant currency.

·         More Personal Computing ($12.9B) +16% YoY cc:

o   Windows OEM, Surface, and Gaming benefited from increased demand to support “work, play, and learn-from-home” scenarios, while Search was negatively impacted by reductions in advertising spend. Seeing headwinds from SMB spending.

o   Strength in Xbox and Surface. Xbox content and services revenue increased 65% (up 68% in constant currency. Surface revenue increased 28% (up 30%in constant currency)

o   “A breakthrough quarter for Gaming”…they saw record engagement and monetization led by strength on and off console as “people everywhere turn to gaming to connect, socialize and play with others.” Xbox Game Pass is seeing record subscriber growth.

o   Windows OEM revenue increased 7%.

o   Search ad rev ex-TAC down 17%

o   Windows Commercial products and cloud services revenue increased 11%

·         Commercial Cloud ($14.3B, +32% YoY ($50B full year, +36% YoY))

o   “Commercial cloud” aggregates the cloud businesses w/in the first two segments: Office 365, Azure, the commercial portion of LinkedIn, Dynamics 365.

o   Gross margin percentage increased 1 point YoY on improvement in Azure gross margins.

o   COVID-19 has accelerated the urgent need for every business to create no-code, low-code apps. This is small for them, but important in terms of strategic positioning and future growth. The Power Platform enables non-technical employees to analyze data and create apps/workflows without coding knowledge. For example, companies like Schlumberger and T-Mobile are using Power Platform to address challenges created by COVID-19. Power BI is the clear leader in business intelligence in the cloud and is growing significantly faster than competition, 96% of the Fortune 500 now use Power BI to find insights in their data.

Valuation:

·         FCF was $14 billion, up 16%. They returned $9B to shareholders w/ $5B in share repurchases and $4B in dividends an increase of 16% vs Q419.

·         Recurring revenue is ~60% of total, underpins most of their valuation and is resilient and poised for additional growth. Particularly Azure, Office 365 and Dynamics 365.

·         Stock is getting more expensive, trading at <3% FCF yield on next year.


Sarah Kanwal

Equity Analyst, Director


Direct: 617.226.0022

Fax: 617.523.8118


Crestwood Advisors

One Liberty Square, Suite 500

Boston, MA 02109

www.crestwoodadvisors.com


$MSFT.US

[category earnings ]

[tag MSFT]


LMT 2Q 2020 earnings summary

Key takeaways:


·         Orders remain robust with book-to-bill at 1.4x

·         Only modest F-35 supply chain disruption risks from COVID-19, with growth expected in the double-digits this year

·         Government support had a small impact on CF as the company accelerated its payments to suppliers

·         Door open for M&A – Jim Taiclet has a track record of M&A at his prior position at American Towers:

o   an interesting option if the defense budget declines with potential new president (which explains some of the recent decline in multiples from Biden advancing in polls – even though he has made no statement on his DoD budget intentions)

o   Commercial aerospace is not of interest to him

·         Committed to its dividend policy (HSD growth likely), while share repo halted until 2021 (mostly to offset dilution)

·         2020 guidance raised, now above January’s initial guidance:

o   Sales guidance increased by +2%

o   Segment EBIT, EPS and cash flow guidance increased by +5%


Current Price: $393        Price Target: $469  

Position Size: 3.53%      1-year Performance: +1%


Lockheed released its 2Q20 earnings results yesterday, with organic sales +12% (7% above consensus) in a tough environment, segment operating margins +20bps, and EPS +7% ex-one time impairment charge on the sale of a JV. Lockheed continues to impress with its organic growth, one of the best in the industry, while maintaining good liquidity and balance sheet (net debt/EBITDA at 1.1x – giving it flexibility for M&A). Book-to-bill (a measure of future demand) is still positive at 1.4x. The sales growth this quarter came from the F-35 and missile platforms, both having reached some scale with maturing production programs, leading to higher margins.

While guidance was raised, the “bears” argue it implies a slowdown in 2H. We would counter argue that LMT has a tendency of providing conservative guidance, adding to the list COVID-19 uncertainties and a new CEO. Regarding increased costs related to the COVID-19, the company is in discussion with the Department of Defense over a settlement, although this could end up being negotiated on a smaller scale with individual customers.

Overall this was a good quarter from the company, which we view as core to our industrial sector exposure. We remain overweight this name in Focused Equity.


LMT Thesis:

·         Lockheed Martin is a primary beneficiary from the replacement cycle for aging military aircraft and ships

·         Excellent management team focused on returning capital to shareholders

·         Strong cash flow and financial position


[category earnings] [tag LMT] $LMT.US


Committed to dividend, does not expect any changes to that priority. HSD increased in coming Qs

Repos has a place in capital allocation but pausing near term. Has done ~$1B


Julie S. Praline

Director, Equity Analyst


Direct: 617.226.0025

Fax: 617.523.8118


Crestwood Advisors

One Liberty Square

Suite 500

Boston, MA 02109


www.crestwoodadvisors.com


Bank of America Q2 earnings

Bank of America (BAC) reported Q2 EPS of $.37 was ahead of estimates, but earnings were down 50% year over year.  Earnings were dented by a $5.1b provision for loan losses.  Interested income fell due to lower interest rates.  We believe BAC is managing the pandemic recession well, has a strong balance sheet and earnings power remains intact. 


Call highlights: “Baseline projection now extend the length of the recession environment into 2022, deep into 2022” Brian Moynihan CEO


Current Price: $ 23.9                        Price Target: $30 (decreased from $39)

Position Size:   2.3%                         Trailing 12-month Performance: -15.9%


Q2 Highlights:

  • $5.1 Provision for loan losses
    • This quarter is the second quarter since a new accounting rule for reserves was implemented which allows banks to estimate future losses and build reserves based on an estimate.  Reserve builds today are forward looking and hence much higher than those in 2009 due to the accounting change.
    • Increased provision to $21b doubled from end of year.  Reserves are 2% of total loans.
    • Not a normal recession: Due to massive government support, losses are not as high as 11% unemployment rate would indicate.  Additional government support for wages is important for all banks.
  • Net Interest income decreased from $3.8b to $3.5b
    • Lead by consumer, deposits increased 8% most of which was invested at the Fed at lower rates
    • Net interest margin fell to 1.87%
  • Strong balance sheet
    • Nonperforming loans are lowest among peers
    • Fed’s stress test has consistently shown BAC losses to be lower than peers
    • Strong capital ratios: CET1 ratio of 11.4% which is 1.9% above required minimum
  • BAC is selling at a discount to book value! at 0.9x Book value and 12.8x P/E
  • Though not mentioned on the call or in their presentation, BAC repurchased 1% of their outstanding shares for $5b last quarter.  Dividend yield is 3.0%.  Total shareholder yield is ~10%! 


BAC Thesis:


·         BAC has dramatically improved their Consumer Banking unit which has driven earning’s growth.  Loss metrics are best among peers.

·         Despite current recession, BAC has strong balance sheet and earnings power

·         Their stronger capital position should lead to increased dividends and buybacks


Please let me know if you have questions.

Thanks,

John


[category Equity Earnings]

[tag BAC]

$BAC.US


John R. Ingram CFA

Chief Investment Officer

Partner


Direct: 617.226.0021

Fax: 617.523.8118


Crestwood Advisors

One Liberty Square

Suite 500

Boston, MA 02109

www.crestwoodadvisors.com


JNJ 2Q20 earnings summary

Key takeaways:


Current Price: $147     Price Target: $175

Position size: 2.52%     1-Year Performance: +12%


·         Guidance for the year raised (a reminder that it was lowered last quarter) as its medical devices segment bounded back quicker than expected:

o   Medical devices results -33% vs guidance of -50%

o   Operational sales growth of -0.8% to +1% (from -3.0% to +0.5% last Q but overall still down from its initial guidance of +5.0-6.0%)

o   EPS raised to $7.75-$7.95 (from $7.50-$7.90 last quarter but still down from initial guidance of $8.95-$9.10).


·         Pharma segment showed steady performance with ~4% organic growth

·         Consumer segment down (-3.6% organic sales) due to competition in Pepcid, lower beauty and women’s health sales (Covid impact)

·         Improving office visits trends within the quarter

·         Delay in its robotic surgery program, as it combines its recent Auris business acquisition with its Verb prototype, and is changing its FDA filing


Overall JNJ posted sales higher than expected as its medical devices segment recovered faster than expected. Organic sales overall were down 9% while earnings dropped 35% (due to medical devices segment earnings decline). But to tamper this good medical devices rebound news, JNJ now expects Q4 recovery to be lower than previously thought in April, with sales down 15% to flat in Q4 vs. 0% to +10% previously guided in April  (see chart below showing the evolution of guidance in its medical devices sales). The office visits improved during the quarter, recovering from a 70% drop to -15% decline in late June. JNJ said its vaccine is on track for a potential approval in early 2021 (human trials starting on July 22nd) and capacity of 1B dose in 2021.

Overall we think the diversified business model of JNJ will help the company navigate today’s environment, while the management team reiterate its desire to find a vaccine for COVID-19 on a non-profit basis (positive company image/government discussion on other drug pricing maybe but no impact to bottom line).


Thesis on JNJ:

  • High quality company with consistent 20% ROE, attractive FCF yield,
  • Investments in the pipeline and moderating patent expirations create a profile for accelerated revenue and earnings growth
  • Growth opportunity: Medical Devices and Consumer offer sustainable growth and potential for expansion internationally
  • Strong balance sheet that offers opportunities for M&A.


[category Equity Earnings]

[tag JNJ]

$JNJ.US


Julie S. Praline

Director, Equity Analyst


Direct: 617.226.0025

Fax: 617.523.8118


Crestwood Advisors

One Liberty Square

Suite 500

Boston, MA 02109


www.crestwoodadvisors.com


Pepsi 2Q20 earnings summary

Key takeaways:


·         Diversified profile is proving its value: snacks/food growth helping offset some temporary beverages category weakness

·         No change from 1Q20: 2020 guidance withdrawn given COVID-19 uncertainties, dividends and share repurchases remain


Current price: $137                          Price target: $153  

Position size: 2.23%                         1-year performance: +1%


Pepsi released its 2Q20 earnings this morning. Organic sales of -0.3% beat consensus expectations of a 3% decline. Its Frito-Lay and Quaker Foods divisions experienced some nice volume growth (and some pricing in snacks), while beverages pretty much across the globe saw volume contraction due to lower on premise & convenience stores sales. For the year, margins might contract a bit from 2019 due to additional virus disruptions and investments in manufacturing automation and distribution systems. COVID related expenses were a 250bps drag on operating margins this quarter. Which mean that removing the COVID impact, operating margins would have improved 50bps y/y. Sales next quarter are expected to improve sequentially in the low single digits, which we view as positive given the current trend in COVID cases in the US (and we think the management team has included that into its guidance for the quarter).

During the call, the management team highlighted focusing on the following factors to assess the health of its markets:


·         #1 overall mobility in the country

·         #2 universe of stores that are opened (mostly in developing markets). They have observed that when the infection rate goes up in a developing country, there’s about 10% to 15% of the stores that close which drives a lot of the performance

·         #3 where do people eat most of their meals (at home/outside)

·         #4 income/unemployment/government help – no impact in the US yet but they have seen some impact in other countries


The e-commerce shift happened faster than they expected prior to COVID. To adapt, PEP worked with all retailers to keep its products in stock, favoring best-selling SKUs and eliminating smaller SKUs. Pepsi has also adjusted its delivery schedules. The company is not providing a 2020 outlook due to COVID-19 but has seen an improvement during the quarter in its business performance and channel mix. Overall we remain positive on Pepsi as a long-term holding in the portfolio.


Thesis on Pepsi:

  • Global growth opportunity with about 40% of profits coming from outside the US. CSD is only 25% of sales (and Pepsi brand only 12%)
  • Strong market share in high growth emerging markets where there is low penetration and rising per capita consumption
  • Resilient snack business provides pricing power and visibility to future cash flows (more than half of sales are from snacks not beverages). CSD is only 25% of sales (and Pepsi brand only 12%)
  • Several Great brands driving global growth: Frito Lay, Quaker, Gatorade
  • Strong balance sheet and cash flows support a solid dividend yield and share buyback program


Tag: PEP

category: earnings

$PEP.US


Julie S. Praline

Director, Equity Analyst


Direct: 617.226.0025

Fax: 617.523.8118


Crestwood Advisors

One Liberty Square

Suite 500

Boston, MA 02109


www.crestwoodadvisors.com


Mike Arone’s Uncommon sense

Hi,

Attached is Mike Arone’s latest Uncommon Sense, which discusses the likelihood of rising corporate taxes in the US.  Over the past 5 years, all the margin improvement in the S&P500 is attributable to lower taxes, which has undoubtedly provided a boost to earnings and prices.  These trends will be important to watch and is part of our rationale for peak margins in the US.

Thanks,

John


John R. Ingram CFA

Chief Investment Officer

Partner


Direct: 617.226.0021

Fax: 617.523.8118


Crestwood Advisors

One Liberty Square

Suite 500

Boston, MA 02109

www.crestwoodadvisors.com