Medtronic 1Q FY21 earnings summary

Key Takeaways:


·         Quarterly organic sales decline 17%y/y on a comparable basis, better than expectations, showing a faster recovery than modeled earlier in the Covid crisis

·         Renewed focus on top line growth:

o   early signs of market share gains due to new product launches, focus on innovation

o   Pace of tuck-in M&A expected to accelerate (3 recently)

o   Cultural changes within the sales team as well: market share gains are now part of their metrics in FY22


Current Price: $104                             Price Target: $121   

Position Size: 2.72%                           TTM Performance: -1%


Medtronic released its quarterly earnings with a beat vs. expectations. Last quarter, sales expectations were for a worsening of the situation (lower than -25%) but the company achieved a (17%) – still a big decline but showing a faster recovery of the business (in Cardiac/vascular and Restorative Therapies).  With 52% of sales coming from the US – down in the low 20% vs the rest of the developed countries in the mid-single digits to mid-teens decline – Medtronic is affected by the high rate of COVID still impacting the US. The situation continues to evolve of course: Europe is back to seeing climbing cases and imposing some restrictions again. We still don’t have any guidance for the FY2021 year, but with so many moving pieces, this is not surprising.


During the video call (a first!), CEO Geoff Martha – on the job since the end of April – sounded particularly positive regarding the company’s renewed focus on top line growth, thanks to their broad innovation pipeline and recent share gains. There seems to be interest in accelerating the number of smaller acquisitions (most recent 3 added to $1B spent), as their balance sheet allows them to.


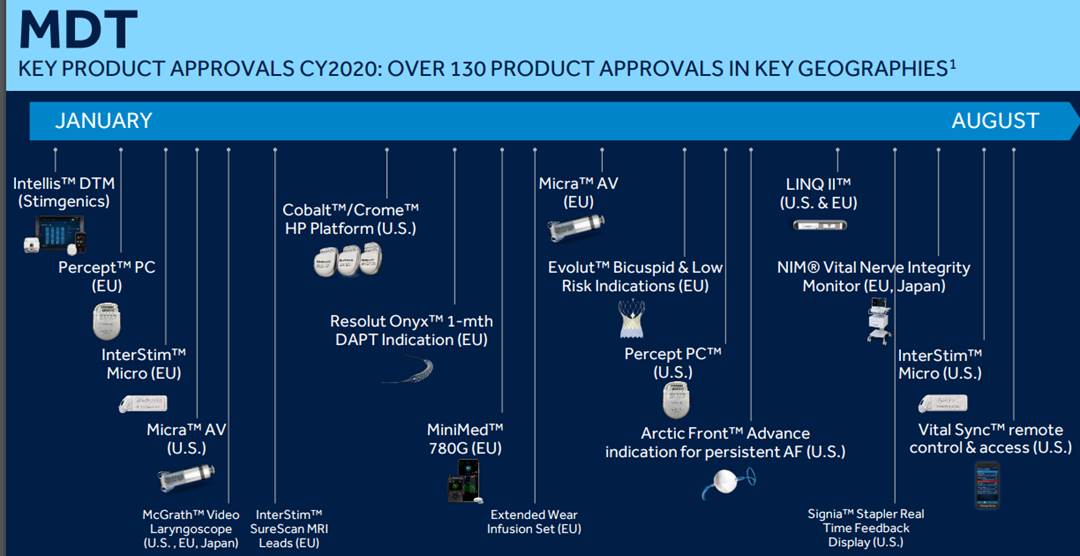
·         In the Cardiac/Vascular segment, sales were helped by the new Micra technology(transcatheter pacing system) and Cobalt and Crome platform (defibrillators), helping the company gain market share, and regaining share in TAVR.

·         The Minimally Invasive Technology segment was helped by the sales of ventilators (sales doubled y/y). Ventilators production increased to 1,000/week to meet demand. Emerging markets are currently driving the demand.

·         In Restorative Therapies, MDT is gaining share in Spine products, and the pending acquisition of Medicrea should push gains even more, expanding the offering with AI technology to personalized spine implants.

·         The diabetes segment (the smallest in revenues) has been a drag on MDT results for a while now. This quarter it was impacted by a delay in the new pumps in the US and continued competitive pressure. But there seems to be some light at the end of the tunnel: the Blackstone partnership and the Companion acquisition are positive news for this franchise. Companion Medical is the manufacturer of the InPen product, the only FDA approved “smart” insulin pen integrated with a diabetes management app. The Blackstone partnership provides funds to accelerate 4 R&D projects.


While margin expansion is possible, this will be kept to a minimum in the near term, as the management team puts efforts into R&D spending to drive future top line growth. Since the beginning of the year, 130 new products have been approved worldwide. Those new products have helped MDT gain 100bps of market share in the US in its heart business.


Overall we thought the tone of the call was positive and we hope to see some continued market share gains in the coming quarter, thanks to a renewed focus by the leaders on driving top line growth.


MDT Thesis:

·         Stands to benefit from secular trends (1) increased utilization from Obamacare (2) developed populations age

·         Strong balance sheet and cash flows. Increased access to non-cash should allow MDT to meaningfully increase their dividend

·         6% normalized Real Cash yield provides solid total return profile over next 2-3 years

·         Ownership interest aligned. Management incentivized to maximize shareholder returns – 14% 10yr average ROIC

Category: Equity Earnings


Tag: MDT


$MDT.US


Julie S. Praline

Director, Equity Analyst


Direct: 617.226.0025

Fax: 617.523.8118


Crestwood Advisors

One Liberty Square

Suite 500

Boston, MA 02109


www.crestwoodadvisors.com


TJX Q2 Results

Current Price:    $54                        Price Target: $70

Position Size:    3.5%                      TTM Performance: 3.5%


Key takeaways:

·         Revenue beat and EPS missed. Lower EPS was driven by a tax adjustment. They didn’t issue guidance for Q2, but top and bottom lines well exceeded internal plans.

·         Better than expected SSS aided by strong Home category sales – SSS for open-only stores were -3% w/ HomeGoods/HomeSense SSS at +20% and Marmaxx at -6%

·         Weakening trends at re-opened stores – they guided SSS trends for Q3 well below Q2, but low inventory levels (which should improve) are a big factor.

·         Seeing extremely plentiful inventory buying opportunities bodes well for the future.

·         Despite the Covid related headwinds they face right now, management’s tone on the call was extremely positive about long term outlook and positioning.

·         CEO Ernie Herrman said…”the way all of the retailers had to shut down, has resulted in tremendous pack-away opportunities which our merchants have really recently started taking advantage of…we have the utmost of confidence that as we go through this… given all the store closures we just think we are going to begin to take major market share.”


Additional Highlights:


·         Sales declined -31.8% YoY vs consensus of -33%, with “open-only” SSS of -3%.

·         2Q loss includes a significant negative impact from tax expense. The tax expense was primarily driven by a tax loss carry back benefit that was booked in Q1 and was reversed in 2Q due to their better than expected results.

·         For Q3, they are planning overall open-only SSS to be down -10% to -20%. This is in-line with the sales trends they’ve seen since the middle of July and through August month-to-date. This reflects lighter inventory, weaker foot traffic at Marmaxx and an anticipated slower back-to-school selling season. Initial re-opening trends benefited from pent-up demand and, to some degree, from stimulus, but trends weakened in large part to lower inventory.

·         Lighter inventory negatively impacting SSS trends…this is a short-term issue

o   Lower inventory is Covid related and not related to lack of inventory availability. Inventory issue exacerbated by stronger than expected sales in 2Q as it created a need to replenish store inventories faster than anticipated.

o   Seeing extremely plentiful inventory buying opportunities which should benefit them in future quarters. Seeing new vendors across all categories reach out to do business w/ them.

o   Covid is causing logistical bottlenecks in inventory flowing to stores due to supply chain and logistics challenges with some third-party affiliates.

o   Vendors and transportation providers ramping their businesses back up caused some logistical delays with merchandise arriving to distribution centers. 

o   As retailers stopped ordering and Covid shut down manufacturing, the flow of goods was disrupted which had prevented them from chasing hot categories the way they normally would. This should be a short-term issue w/ inventory in “hot” categories continuing to improve as manufacturing resumes.

o   They also lowered store inventory to promote social distancing with wider aisle spacing and fewer racks.

o   The inventory they do have is turning quickly which is a positive sign.

·         Traffic at Marmaxx is weak – This is also weighing on SSS trends. Covid is causing lower foot traffic as some customers are still not comfortable coming to stores. However the customers that are coming are buying and basket sizes are up. States where there have been a second wave are negatively impacting traffic trends. As traffic slowly normalizes and inventory improves, they are well positioned.

·         Adjusting inventories to align w/ current category demand trends…

o   Home is extremely strong. Shifting more inventory to home.

o   Apparel trends shifting as people are not buying business clothes. They are working to adjust their inventory to these category trends.

o   They are pivoting to “hot categories” – this has always been one of TJXs advantages. Centralized merchandising combined with high turns and constantly flowing goods to stores allows them to be nimble with inventory and respond to current trends. This has been a key part of their ability to drive LT positive SSS trends for decades. Covid has disrupted this, as discussed above, but this should be a short-term issue.

·         Merchandise margins were strong as markdowns were significantly lower than anticipated due to the greater than expected demand.

·         Nearly all stores worldwide open for business by the end of June as expected. Stores were only open a little more than two-thirds of the second quarter.

·         As competitors close stores confident they can capitalize on real estate opportunities and continue to take share.

·         No guidance other than SSS.

·         Dividend still halted, but committed to resuming.

·         Valuation: Balance sheet remains strong. The stock has recovered from troughs and is now down ~10% YTD. Valuation reasonable at >4% FCF yield on 2019.


Sarah Kanwal

Equity Analyst, Director


Direct: 617.226.0022

Fax: 617.523.8118


Crestwood Advisors

One Liberty Square, Suite 500

Boston, MA 02109

www.crestwoodadvisors.com


$TJX.US

[tag TJX]

[category earnings]


AFVZX – Q2 2020 Commentary

AFVZX Commentary – Q2 2020

Thesis

AFVZX is our only active manager in the large cap U.S. equity markets and applies a quality and value tilt to their investment strategy, holding roughly 50 companies. By utilizing DCF models, bottom-up fundamentals, and holding sector weights that are equivalent to their benchmark (S&P 500 Index), the fund generates alpha over time purely through stock selection. We continue to hold AFVZX because of the team’s ability to compare stocks across all sectors which enables them to generate strong returns over the long run.


[more]


Overview

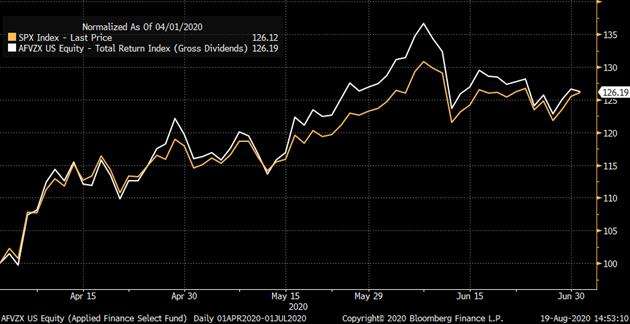
In the second quarter of 2020, AFVZX underperformed the benchmark (S&P 500 Index) by 41bps. Six of the eleven sectors outperformed the benchmark, while the rest underperformed. Underweighting of the largest market cap names was the main reason for underperformance, as relatively smaller capped stocks lacked in performance. The fund’s value tilt also detracted from returns.


Q2 2020 Summary

          AFVZX returned 20.13%, while the S&P 500 Index returned 20.54%

          Top contributors

o    Consumer Discretionary – APTV, LOW, DRI were main drivers

o    Financials – AMP and COF were main drivers

o    Industrials – All six holdings beat the XLI sector benchmark

          Top detractors

o    Information Technology – FISV, HPQ performed worst

o    REITs – HST, the largest lodging REIT in the U.S., has large exposure to business and leisure travel


Optimistic Outlook

          We continue to hold this fund and believe in our thesis due to the fund’s ability to outperform the index over the long run through strong stock selection and maintaining a quality and value investment tilt

          The fund managers believe there is good reason for the market rebound

o    U.S. Fed and Government involvement

o    Quicker reopening than expected, which has gone well so far

o    Hopeful and encouraging vaccine news

          The fund managers see the current market as rich in valuation, which could increase negative surprises; yet, equity risk premiums are still high


[Category Mutual Fund Commentary]


Micah Weinstein

Research Analyst


Direct: 617.226.0032

Fax: 617.523.8118


Crestwood Advisors

One Liberty Square

Suite 500

Boston, MA 02109

www.crestwoodadvisors.com


Home Depot Q2 Earnings

Current Price: $284                         Target Price: $324 (raised from $297)

Position size: 2.3%                          Performance since inception: +43%


Key Takeaways:

·         HD reported very strong Q2 results, beating on revenue and EPS which included elevated costs related to COVID-19.

·         Incredibly strong SSS for the quarter (overall SSS +23.4%; US SSS +25%), with similar trends extending into the first couple weeks of August. They are taking share in home improvement with sales that were well ahead of expectations (+8.8%).

·         Omni-channel strategy shines. E-Commerce sales were mid-teens % of sales in the quarter, up+100% YoY, with >60% of online sales picked up in store.

·         Mgmt. quote from call…”the home has never been more important to the customer”……”despite the significant uncertainty in the current environment, we do believe in the resilience of home improvement demand over the long term. The home typically represents our customers largest asset. The housing stock is aging, and we believe the capabilities we are investing in, across our interconnected platform will position us well to continue capturing market share in any environment.”


Additional Highlights:

·         Elevated opex (benefits/wages) used to support employees during the pandemic – was an additional $480m in Q2. This eroded margins in the quarter, but they should see improvement –increased benefits margins were a -125bps impact.  Despite this, op margins increased 10bps aided by higher sales volumes and strong expense control.

·         Saw healthy growth from both DIY and Pro customers

·         E-commerce channel was so strong that they had to temporarily convert a store fulfillment center to be an additional dedicated e-commerce direct fulfilment center.

·         Macro commentary:

o   Strong housing market heading into the pandemic continues – underpinned by low inventory, rising prices, low interest rates and aging housing stock. In normal, non-housing led recession, they would expect flat SSS.

o   Substantiating this, robust residential starts (+22.6%) and build permits (+19%) just reported.

·         SSS Details:

o   They saw broad strength across merchandise categories, big ticket items, geographies and customer cohorts (DIY & Pro).

o   By month, SSS were +27.3% for May, +27.3% for June and +21% in July.

o   Both ticket and transaction were up double digits. Ticket was +10% and transaction was +12%.

o   Big ticket (over $1000) transactions were +16%. Strength in appliances, riding lawn mowers, patio furniture offset weakness in products that require indoor installation which were impacted by Covid (e.g. kitchen installations).

o   13 of their 14 merchandizing departments posted double digit sss. Strongest was lumber, weakest was Kitchen & Bath which still had high-single-digit sss – that weakness driven by indoor installation headwinds w/ Covid .

o   Seeing significant increase in Pro sales as markets re-open from stay at home orders. Notable strength w/the “low spend Pro” – they were less impacted by the pandemic. Higher spend Pro impacted w/ restriction on permitting and inspections – that is continuing to rebound. Multifamily property managers are weakest – rebounding w/ re-opening but delays on major rehabs and capital projects due to social distancing and lack of access to units.

·         Capital allocation: suspended share repurchase, dividend maintained.

·         Valuation: Strong balance sheet, benefiting from strong housing trends but also has defensive qualities and trading at ~3.8% FCF yield on this year (fiscal 2021).


Sarah Kanwal

Equity Analyst, Director


Direct: 617.226.0022

Fax: 617.523.8118


Crestwood Advisors

One Liberty Square, Suite 500

Boston, MA 02109

www.crestwoodadvisors.com


$HD.US

[tag HD]

[category earnings]


CSCO Q4 2020 Results

Current Price: $42                            Price Target: $58 (lowering from $63)

Position size: 3.1%                          TTM Performance: -18%


Key Takeaways:

·         Top line and EPS beat overshadowed by weak top line guidance and CFO departure.

·         Macro environment is a headwind but the LT story is intact. Aging network infrastructure needs to be upgraded. Growing use of new technologies and increased data demand places increased importance on this.

·         Mix shift to software and recurring revenue should continue as an increasing number of their products are to be offered this way.

·         Cost cutting amidst headwinds to help preserve earnings power – mgmt. announced $1B in annual cost reductions to be implemented over next few quarters.

·         CEO Chuck Robbins said…” the pandemic has had the most impact on our enterprise and commercial orders driven by an overall slowdown in spending. We are seeing customers continue to delay their purchasing decisions in certain areas, while increasing spend in others until they have greater visibility and clarity on the timing and shape of the global economic recovery.”


Additional Highlights:  

·         Q4 sales -9% YoY and EPS +22%. FY20 rev -5% and EPS +4%. Q1 revenue guided to -9-% to -11%.

·         Generally weaker demand commentary relative to last quarter. For reference, Gartner expects global IT spending to decline -7.3% in 2020. Within this there are pockets of strength, like public cloud spending as companies shift IT budgets to areas of immediate need. For much of Cisco’s products the needs are less immediate, but the LT drivers still exist.

·         Advances in technology require updates to networks, but will occur over time and can be subject to the macro environment. CEO says…”I have had a lot of customers who are not at the center of this crisis who realized during this pandemic that they have a fair amount of technical debt, and they have a lot of aged equipment. And so we don’t know what the time frame is, but many of them have said this is a wake-up call, and this is going to actually give us air cover to talk to our senior leadership team about upgrading and building out a more robust, modernized infrastructure.” Right now, this is occurring more w/ public sector customers and larger, well capitalized enterprises and not w/ SMB’s which make up the their “commercial” business.

·         Positive commentary points to continued software/services mix shift and strength in new products –This includes strong demand for their Catalyst 9000, security, WebEx and other SaaS-based solutions. Software mix was 31% of revenue in Q4, w/ 78% of software sold as subscription (+8pp YoY). That means almost 1/4 of total sales is from software subscriptions sales (or close to $12B). Additionally, 27% of rev is services with much of that from maintenance/support which tend to be recurring. So overall recurring revenue could be 40% or more (they don’t break it out specifically). So while top line growth has been weak, the mix shift happening w/in their business should be supportive of their multiple and their margins. They intend to grow this mix over time…as they “accelerate the transition of the majority of our portfolio to be delivered as a service.”

·         Security is a bright spot. Security rev was +10% YoY. Security is a big and growing TAM for them and should be a key growth driver as this becomes a more meaningful piece of their business. It’s also a differentiator as competitors do not have the integrated security that they do. Their massive installed base is an opportunity to continue to cross-sell their security products.  

·         Momentum w/ web-scale cloud providers – the positive commentary from last quarter continued. This is an end market where they lost share to Arista in the past, but their positioning is improving w/ new products announced last Dec. That being said, this is still early stages – mgmt. indicated it may take a year or two for this to be a meaningful top line contributor.

·         Executive departure is concerning. Kelly Kramer, CFO (52 years old) is “retiring” and staying on until a replacement is found. She joined Cisco in 2012 and became CFO in 2015, the same year Chuck Robbins became CEO. With her departure, and the announcement at the end of June that the head of Strategy (Anuj Kapur) would be leaving – the leadership changes are starting to add up. Kapur only took on that role in 2018. Those changes come after Rob Salvagno, head of Cisco venture and acquisitions unit departed in Jan 2020 and a couple other execs in Dec 2019 that left as well. So there have been significant leadership changes made in the last 7 months or so. These changes coming amidst a strategy shift and continued acquisitions is a little concerning. Not seeing this talked about on the sell-side.

·         Valuation: trading at a 7.5% FCF yield on 2021. This is well below S&P average of <4%, for a strong balance sheet, high FCF generative business w/ a growing mix of software and recurring revenue. Despite macro headwinds, fundamentals continue to be supported by business transformation/digitization trends at a reasonable valuation while much else in tech has seen substantial multiple expansion. Additionally, their valuation is supported by a 3.4% dividend yield which they easily cover. They have ~$15B in net cash on their balance sheet, or >8% of their market cap.


Sarah Kanwal

Equity Analyst, Director


Direct: 617.226.0022

Fax: 617.523.8118


Crestwood Advisors

One Liberty Square, Suite 500

Boston, MA 02109

www.crestwoodadvisors.com


TIREX – Q2 2020 Commentary

TIREX Commentary – Q2 2020

Thesis

TIREX utilizes fundamental research to find properties in high barrier markets, with higher occupancy and rent growth. By focusing on quality companies and avoiding unnecessary risks, the fund obtains a strong track record that has outperformed the benchmark and REIT ETF over time. We continue to hold TIREX because of the team’s growth focus with asset concentrations in supply constrained markets. Lastly, TIREX was the lowest cost active manager screened, at 51bps.


[more]


Overview

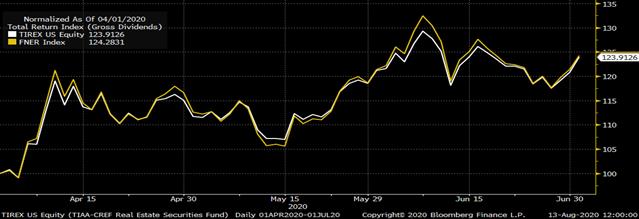
In the second quarter of 2020, TIREX outperformed the benchmark (FTSE Nareit All Equity REITs Index) by 11bps, driven by strong stock selection in single-family home, office, and data center REITs. Allocation to the lodging property sector also contributed to positive returns. Underweights to retail and infrastructure REITs partially offset these gains, though. In general, REITs closely related to a “stay-at-home” economy benefited most.


Q2 2020 Summary

          TIREX returned 13.36%, while the FTSE Nareit All Equity REITs Index returned 13.25%

          Contributors

o    Overweight to Invitation Homes, Inc. – single-family rental REIT

o    Underweight to Digital Reality Trust – data center REIT

o    Underweight to Public Storage – self-storage REIT

          Detractors

o    Overweight to Rexford Industrial Realty – industrial properties

o    Overweight to Hudson Pacific Properties, Inc – office REIT

o    Underweight to Simon Property Group – regional mall REIT


Optimistic Outlook

          We continue to hold this fund and believe in our thesis due to the fund’s goal to obtain long-term alpha through capital appreciation and current income

          By having a research-oriented investment process that focuses on cash flows and asset values we believe TIREX will continue to outperform its benchmark long-term

          The managers are effective when it comes to understanding and preparing for changes to the REIT landscape and where long-term sustainable growth exists


[Category Mutual Fund Commentary]


Micah Weinstein

Research Analyst


Direct: 617.226.0032

Fax: 617.523.8118


Crestwood Advisors

One Liberty Square

Suite 500

Boston, MA 02109
www.crestwoodadvisors.com


REEIX – Q2 2020 Commentary

REEIX Commentary – Q2 2020

Thesis

REEIX is driven through both top-down and bottom-up fundamental research that provides diversification within our full EM allocation. The fund looks for high quality companies across all market caps that have strong ESG scores. We like REEIX because of the consistent and repeatable process that allows the team to take advantage of companies with sustainable growth across all the Emerging Market (EM) landscape.


[more]


Overview

In the second quarter of 2020, REEIX outperformed the benchmark (MSCI Emerging Markets Index) by 22bps. China and Taiwan helped provide a boost to returns, while Brazil and India significantly underperformed. Strong stock selection within South Africa and India contributed to returns, yet a lack of exposure to China detracted from positive performance.


Q2 2020 Summary

          REEIX returned 18.30%, while the MSCI Emerging Markets Index returned 18.08%

          Contributors

o    Largest contributor was NCSoft, a South Korean gaming company

          Detractors

o    No exposure to Alibaba, a Chinese internet-service company

          Market volatility has allowed the fund managers to find relatively attractive stocks to allocate to


Outlook

          We continue to hold this fund and believe in our thesis due to the fund’s historically strong returns and understanding of Emerging Markets on both a macro and micro level

          In the medium to long-term, REEIX expects four factors to play a key role in EM equities

o    US dollar

o    Economic growth differentials between EM and International Developed Markets

o    Earnings growth

o    Valuations

          The team will continue to focus on high quality companies with strong balance sheets and cash flows

          5 focused themes

o    Domestic consumption

o    Health and wellness

o    Digitalization

o    Financialization

o    Infrastructure

[Category Mutual Fund Commentary]


Micah Weinstein

Research Analyst


Direct: 617.226.0032

Fax: 617.523.8118


Crestwood Advisors

One Liberty Square

Suite 500

Boston, MA 02109

www.crestwoodadvisors.com


HLMEX – Q2 2020 Commentary

HLMEX Commentary – Q2 2020

Thesis

HLMEX utilizes fundamental research to find companies with strong quality and growth metrics that can be compared across the global landscape. By focusing on investments with competitive advantages, long-term growth potential, quality management, and corporate strength, HLMEX offers diversity to our EM allocation while generating alpha over the long run. We continue to hold the fund because of the team’s conviction in high quality companies and managed risk through diversification and evaluation.


[more]


Overview

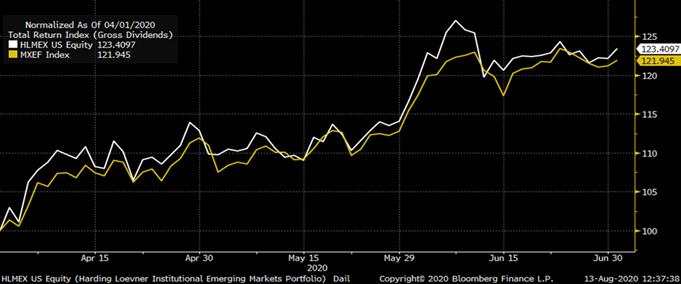
In the second quarter of 2020, HLMEX underperformed the benchmark (MSCI Emerging Markets Index) by 58bps largely due to an underweight allocation to China and Hong Kong. Stock selection in Information Technology, Health Care, and Consumer Discretionary also detracted from returns. Industrials and strong selection in Financials did help offset these losses, though. Regionally, India, Peru, and Thailand detracted from performance, while China contributed to returns.


Q2 2020 Summary

          HLMEX returned 17.50%, while the MSCI Emerging Markets Index returned 18.08%

          Underweight to China and Taiwan – 35% cap which was established in 2016

          Contributors

o    Techtronic Industries (Industrials), GF Banorte (Financials), & Sberbank (Financials)

          Detractors

o    CSPC Pharmaceutical Group (Health Care) & Sands China (Consumer Discretionary)

          One purchase this quarter – AirTAC (Taiwanese manufacturer of pneumatic equipment)

          One sale this quarter – Hankook Tire (South Korean company in Consumer Discretionary)


Outlook

          We continue to hold this fund and believe in our thesis due to the fund’s focus on quality by emphasizing earnings growth and strong cash flow to gain attractive returns over the long run

          Over past year, portfolio has shifted from being overweight in expensive stocks to underweighting this area – has created a headwind for 2020

          Continue to invest in durable growth – quality focus with attractive valuations


[Category Mutual Fund Commentary]


Micah Weinstein

Research Analyst


Direct: 617.226.0032

Fax: 617.523.8118


Crestwood Advisors

One Liberty Square

Suite 500

Boston, MA 02109

www.crestwoodadvisors.com


LISIX – Q2 2020 Commentary

LISIX Commentary – Q2 2020

Thesis

LISIX is a bottom-up, growth-based fund that completes the core satellite strategy within global equity. The fund is unique in that it focuses on individual stocks rather than markets and looks for reasonably priced companies with strong growth potential. We like LISIX because of the managers’ expertise in various market caps, geographies, and sectors which helps keep the fund diversified while providing strong upside and downside capture over time.


[more]


Overview

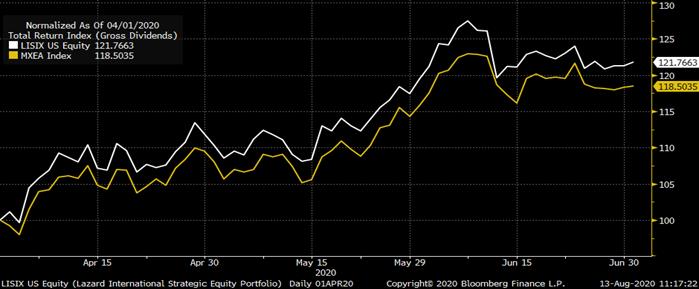
In the second quarter of 2020, LISIX outperformed the benchmark (MSCI EFEA Index) by 116bps. Quality factor tilt and stock selection in Financials and Utilities sectors contributed most to performance. While cheaper stocks continued to underperform, the fund sought out companies with strong financial productivity and inexpensive valuations. As valuation spreads between value and growth widen, the fund took advantage of cheaper stocks that helped provide balance to the portfolio, resulting in an overall relatively cheaper portfolio.


Q2 2020 Summary

          LISIX returned 16.04%, while the MSCI EAFE Index returned 14.88%

          Contributors

o    Strong stock selection and underweight to Japan

o    Volkswagen – German car company

o    SAP – German enterprise application software firm

o    ABB – industrial conglomerate situated in Switzerland

          Detractors

o    Kao – manufacturer of consumer staples products in Japan

o    Medtronic – medical devices located in Ireland

o    Compass Group – high-quality catering and support services company in the UK

o    Cash – largest detractor


Outlook

          We continue to hold this fund and believe in our thesis due to the fund’s strong stock selection, ability to find well valued companies, and expertise in various market caps, geographies, and sectors

          Historically, value has begun to outperform when their valuation is this cheap compared growth stocks and the global economy begins to accelerate

o    With economies continuing to reopen and government policy helping provide liquidity and demand, a long recovery could end up supporting value stocks

          Looking for buying opportunities going forward in relatively inelastic industries, strong franchises, and cyclicals


[Category Mutual Fund Commentary]


Micah Weinstein

Research Analyst


Direct: 617.226.0032

Fax: 617.523.8118


Crestwood Advisors

One Liberty Square

Suite 500

Boston, MA 02109
www.crestwoodadvisors.com


TCPNX – 2Q 2020 Commentary

TCPNX Commentary – Q2 2020

Thesis

TCPNX is a smaller fund that does not have as many assets under management compared to our other core mangers, enabling them to make more nimble and tactical decisions. By making small allocations to undervalued “riskier” asset classes (high-yield and non-dollar denominated debt), TCPNX diversifies our fixed income portfolio and generates superior returns to the benchmark (Barclays U.S. AGG). We like that the fund utilizes a bottom-up investment process through proprietary framework analysis, fundamental security review, and portfolio risk management.


[more]


Overview

In the second quarter of 2020, TCPNX outperformed the benchmark (Barclays U.S. AGG) by 61bps. The overweight to spread sectors were the largest contributor to performance. Allocation to other asset classes such as securitized credit also helped performance, while a neutral weight to credit relative to the index did not help relative performance much. Overall, the fund tends to invest in higher quality assets which were a headwind for this quarter, while low-rated, highly volatile bonds were stronger performers.


Q2 2020 Summary

          TCPNX returned 3.51%, while the U.S. AGG returned 2.90%

          Quarter-end effective duration for TCPNX was 5.80 and 6.04 for the U.S. AGG

          Three largest contributors

o    U.S. Small Business Administration DCPC, Structure Settlements, and High Yield bonds

          The top detractors

o    Airline Enhanced Equipment Trust Certificates, U.S. Treasury STRIPS, and long duration Multi-Family CMOs


Optimistic Outlook

          We continue to hold this fund and believe in our thesis due to the fund’s consistent and defensive approach that we expect to generate alpha through times of low volatility

          The fund believes that Fed involvement will keep the economy and market afloat and positive, yet if this support fades then the future could be very volatile

          TCPNX is focusing on increasing quality names – recently exited oil and exploration companies

[Category Mutual Fund Commentary]


Micah Weinstein

Research Analyst


Direct: 617.226.0032

Fax: 617.523.8118


Crestwood Advisors

One Liberty Square

Suite 500

Boston, MA 02109

www.crestwoodadvisors.com