MWTIX – Q2 2020 Commentary

MWTIX Commentary – Q2 2020

Thesis

MWTIX is an actively managed fund that provides a sector-based strategy while still maintaining fundamental research driven through issue selection. When compared to the benchmark (Barclays U.S. AGG), the holdings have similar duration and exposure, yet selection is focused around areas where other managers are not looking. Through sector rotation and active weighting, we expect MWTIX to generate alpha over time.


[more]

Overview

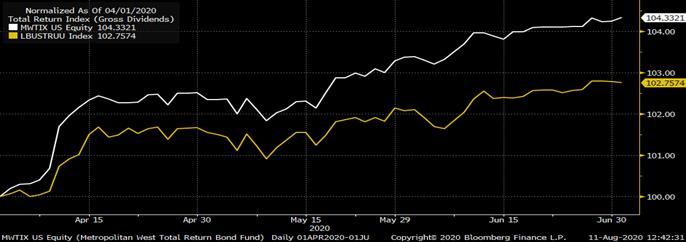
In the second quarter of 2020, MWTIX outperformed the benchmark (Barclays U.S. AGG) by 117bps. This outperformance was largely due to strong sector positioning and opportunistic repositioning. The relatively suppressed Treasury rates had little impact on performance, while an overweight to long-duration corporate credit carried returns through the second quarter. The small allocation to high-yield and EM debt also contributed to performance. Weights to securitized debt and TIPS also helped the fund outperform its benchmark for the quarter.


Q2 2020 Summary

          MWTIX returned 4.07%, while the U.S. AGG returned 2.90%

          Quarter-end effective duration for MWTIX was 5.4 and 6.04 for the U.S. AGG

          With much uncertainty in the future the fund will continue to seek attractive entry points to add exposures to high quality sectors that are resilient and can benefit from Fed action

o    Decrease to corporate credit – long-dated high-quality focus

o    Limited exposure to high yield – swelling of downgrades

o    Trimming MBS


Outlook

          We continue to hold this fund and believe in our thesis due to the fund’s defensive approach and minimal exposure to more vulnerable issuers and industries

          Going forward MWTIX is uncertain of what may come

o    Increased debt and industry disruptions will prevent a quick economic recovery

o    Stimulus and re-opening trends may help increase economic growth

          MWTIX has positioned itself to take advantage of relatively attractive prices during times of high volatility to generate strong returns


[Category Mutual Fund Commentary]


Micah Weinstein

Research Analyst


Direct: 617.226.0032

Fax: 617.523.8118


Crestwood Advisors

One Liberty Square

Suite 500

Boston, MA 02109

www.crestwoodadvisors.com


WATFX – Q2 2020 Commentary

WATFX Commentary – Q2 2020

Thesis

WATFX is an actively managed fund that finds overlooked areas of the market that can go against consensus views and add value. Through internal macro, credit, and fundamental research WATFX identifies undervalued securities and takes on more credit exposure to generate alpha over time. Through a diversified approach to interest rate duration, yield curve, sector allocation, and security selection, the fund dampens exposure to volatility.


[more]


Overview

In the second quarter of 2020, WATFX outperformed the benchmark (Barclays U.S. AGG) by 275bps. The allocation to investment grade corporate bonds contributed most to overall performance. EM debt, non-Agency RMBS, ABS, and TIPS also helped contribute to returns. Lastly, the fund’s duration, which is longer than the benchmark, also helped add to performance. The overall narrowing of spreads through numerous fixed income asset classes helped WATFX outperform the benchmark.


Q2 2020 Summary

          WATFX returned 5.65%, while the U.S. AGG returned 2.90%

          Quarter-end effective duration for WATFX was 6.8 and 6.04 for the U.S. AGG

          Lengthening of duration

          Reduction to the MBS space due to tightening spreads from Fed action

          Increasing allocation to investment-grade corporate bonds


Outlook

          We continue to hold this fund and believe in our thesis due to the fund’s diverse approach and strong top down-bottom up fundamental value investing over the long-term

          WATFX is expecting a longer “U-shaped” global economic recovery

o    The near-term shortfall will fade as policymakers continue to push for economic activity through stimulus packages

          The fund is excited to seek out opportunities as spreads widen and the Fed continues to support corporate credit markets


[Category Mutual Fund Commentary]


Micah Weinstein

Research Analyst


Direct: 617.226.0032

Fax: 617.523.8118


Crestwood Advisors

One Liberty Square

Suite 500

Boston, MA 02109

www.crestwoodadvisors.com


DBLTX – Q2 2020 Commentary

DBLTX Commentary – Q2 2020

Thesis

DBLTX utilizes a top down-bottom up process that focuses on MBS and Agency bonds. When compared to the benchmark (Barclays U.S. AGG), the holdings have lower duration and exposure to corporate bonds, reducing their sensitivity to interest rate movements and credit spreads. We expect attractive risk-adjusted return characteristics over the long term from DBLTX, especially during periods when corporate bonds’ spread increase and the yield curve steepens.


[more]


Overview

In the second quarter of 2020, DBLTX outperformed the benchmark (Barclays U.S. AGG) by 51bps, largely due to asset allocation – the fund maintained a large exposure to credit assets. After the sharp drop in March, securitized credit sectors continued to recover. Price declines and selling pressure in this sector during the first quarter resulted in wider spreads, which led to an attractively priced vehicle for investors to rally behind during the second quarter. Improvements in liquidity and investor sentiment also helped bolster non-Agency RMBS performance. Lastly, the Fed’s stimulus packages helped performance through the second quarter.


Q2 2020 Summary

          DBLTX returned 3.41%, while the U.S. AGG returned 2.90%

          Quarter-end effective duration for DBLTX was 3.18 and 6.04 for the U.S. AGG

          The top two performers were non-Agency RMBS and Agency RMBS assets

o    All sectors allocated positively to the fund’s return – CLOs and ABS made the smallest contribution due to their low weighting within the fund


Outlook

          We continue to hold this fund due to the approach and strong diversification factor within our core bond holdings – yet we are looking further into the holding as the year-to-date volatility and underperformance has made us reassess the approach

          DBLTX is a good position to hold due to its low duration which outperforms during periods of rising rates – Treasury yields are at an all time low and have a high possibility of steepening

          Historically, DBLTX has displayed stronger returns and lower volatility than the index

          DBLTX has had consistent strategy, allocation focus, and sector distribution


[Category Mutual Fund Commentary]


Micah Weinstein

Research Analyst


Direct: 617.226.0032

Fax: 617.523.8118


Crestwood Advisors

One Liberty Square

Suite 500

Boston, MA 02109

www.crestwoodadvisors.com


Black Knight 2Q20 Earnings

Current Price: $79            Price Target: $85 (raised from $80)

Position Size: 2.6%          TTM Performance: 32%


Key Takeaways:


·         Better than expected revenue and EPS. Full year guidance better than expected. Exceeded expectations on higher origination volumes and continued improvement in data and analytics sales.

·         Lower foreclosures is a headwind: as they indicated last quarter, they are seeing lower foreclosure-related volumes in their Specialty Servicing software business due to the foreclosure moratorium.

·         Data & Analytics accelerated (+21% YoY): Seeing continued improvement with cross-selling Data & Analytics (~15% of revenue), which could be a solid future growth driver for them.

·         CEO Anthony Jabbour said… “the solutions that we are driving in this digital mortgage world that we’ve been talking about many times on these calls…the pandemic has accelerated the need for them. So we’re just in a great spot right now.”


Additional Highlights:

·         Q4 Revenues were -1% and adj. EPS was +6%.

·         Mgmt. highlighted several new client wins in Servicing and Origination and the recent completion of the Bank of America implementation this past week.

·         Their stake in D&B is now worth $1.4B w/ the recent IPO. They invested just under $500m in their D&B stake ~1 year ago giving them a pre-tax unrealized gain of ~$900m.

·         Optimal Blue acquisition which enhances their origination and Data & Analytics businesses – expected to close in Q3.

·         Data analytics segment (~15% of revenue) revenues were up 21%, an acceleration from 16% last quarter. Driven by growth in their property data and portfolio analytics businesses.

o   EBITDA margin +970bps YoY.

o   Trending ahead of LT targets in recent quarters on strong cross-sales related to new client deals, as well as renewals. They continue to see promising momentum in this business.

o   Current situation is highlighting their unique data sets and analytics. They are the only company with real-time visibility into the majority of active mortgage loans in the US. This is helping w/ loan origination despite social distancing, and implementing forbearance plans. They’ve seen significant interest in and adoption of their expedite e-close and e-sign solutions as well as their loss mitigation solution since the beginning of the pandemic.

·         Software Solutions segment (~85% of revenue) down -4%.

o   Within this segment servicing (~70% of revenue) was down -12.5% driven by previously discussed headwinds – a client de-conversion and lower foreclosure related volumes due to the foreclosure moratorium as part of the CARES Act.

o   They continue to dominate first lien loans with leading share and are growing share in second lien loans. Market share for first mortgages is >60%.

o   Originations (~16% of total revs) made up of new loans and refi’s – revenues increased 36% in Q2 – an acceleration from +18% last quarter. Volumes were stronger than expected. Lower rates help this business. Growth driven by new clients, a tuck-in acquisition, as well as higher refinanced volumes in their Exchange and e-Lending businesses.

o   Segment EBITDA margin down 70bps YoY.

·         Full year 2020 outlook:

o   Revenues of $1,170 million to $1,184 million. Lower-end increased slightly – guidance reflects the expected lower foreclosure related volumes as a result of the foreclosure moratorium. ~$39m headwind in 2020.

o   Adj. EPS of $1.94 to $1.99 (previously $1.90 to $1.97), street at $1.93

o   Adj. EBITDA of $572 million to $583 million (previously $568m to $583m)

Valuation:

·         Trading at <4% FCF yield on 2021 –valuation is getting more expensive but supported by growth potential, strong ROIC with a recurring, predictable revenue model (>90% recurring revenue) and high FCF margins, which is aided by high incremental margins and capex which should taper as they grow.

·         $1B in net debt – that puts their leverage ratio at 1.7x. This will go up to >3x with Optimal Blue acquisition.

·         Capital allocation priorities include opportunistic share repurchases, debt pay down and acquisitions.

Thesis:

  • Black Knight is an industry leader with leading market share of the mortgage servicing industry. 
  • Stable business with >90% recurring revenues, long-term contracts and high switching costs.
  • BKI has high returns on capital and high cash flow margins.


.UA

[tag BKI}

[category earnings]

Sarah Kanwal

Equity Analyst, Director


Direct: 617.226.0022

Fax: 617.523.8118


Crestwood Advisors

One Liberty Square, Suite 500

Boston, MA 02109

www.crestwoodadvisors.com


$BKI.US

[category earnings]

[tag BKI]


BKNG 2Q Results

Current Price: $1,778      Target price: $2,400

Position Size: 1.8%          TTM Performance: -8%


Key Takeaways:

·         Better than expected results aided by cost cutting. Beat on revenue and EPS.

·         Demand continues to improve each month since April. Improved from April room nights down 85% YoY to July room nights down 35% YoY.

·         Seeing strongest trends w/ domestic driving travel and alternative accommodations (e.g. home rentals). Alternative accommodations were 40% of booked room nights. Europe and the US had the highest contribution to the improved domestic booking trends.

·         Weak environment strengthens their position w/ suppliers as they are a key source of demand. Dramatic demand mix shift away from business towards leisure benefits BKNG’s leisure focus.

·         CEO Glen Fogel said…”as business travel has been significantly curtailed…it may be a help to us in the long term. As the shift from business to leisure continues for a long time, we will be in a better position with our supply partners because we’re able to provide them with what they need, which is heads in beds.”


Additional Highlights:

·         Revenue down 84% and net income down 88%. Net income was $122M, but this includes a gain on marketable securities – excluding that, they had a net loss of $443m.

·         Room nights booked down 87% YoY. That number includes cancellations. Newly booked room nights, excluding the impact of cancellations, declined 68% in the quarter.

·         Improving trends – Once shelter-in-place rules were relaxed in a geography, they saw booking trends improve quickly. Saw the greatest negative impact from the virus in April as newly booked room nights in that month declined over 85% YoY. After April, room night trends steadily improved with newly booked room nights in July declining 35% YoY. Notably, this is better than EXPE, which reported a weakening in July compared to June.

·         Strength in domestic travel – booking trends were primarily driven by domestic travel with international trends seeing much more limited improvement. In July, they had slightly positive YoY growth for overall domestic newly booked room nights – though there were still many countries that had negative YoY growth rates. Domestic business obviously  benefiting from prohibitions/restrictions on international travel, which forces consumers who want a holiday to travel domestically. Note that “domestic” is just intra-country, so travel between countries w/in Europe is international.

·         Weakness in areas w/ new outbreaks – “in some regions, they’re dealing with new outbreaks after having significantly lowered their infection rates. As a result, after a period of relatively steady improvement in many geographies, in recent weeks, we are seeing these growth rates worsen in some countries.”

·         Cost cutting – big headcount reductions with more to come. Also cutting marketing expense which is the biggest part of their cost structure – typically ~30% of rev. This is an important lever for cutting costs. As direct traffic grows as a % of bookings (over 50% now and increasing), this is an area where margins can structurally improve over time.

·         Connected trip is a long-term growth driver – The long-term vision for them continues to be the “connected trip.” The idea is to be a platform for not just hotel, but a portal for all aspects of travel including flights, activities, restaurants etc. A key part of this is building up the “supply” (e.g. tour operators). The current environment could be a catalyst for supply as weaker travel trends spur suppliers to look to Booking as a necessary source of demand. They continue to invest behind this despite the current environment including their payment platform which enables payment to companies like tour operators through their platform.

·         Cost cutting and improved marketing efficiency likely to lead to profitability recovering before top line does. Additionally, the current environment may be a catalyst to traction in their new growth areas – alternative accommodations and “connected trip”.

·         Stock is cheap and expectations are reasonable. Trading at >5% yield on 2021. Which still presumes revenue well below 2019 baseline.


Sarah Kanwal

Equity Analyst, Director


Direct: 617.226.0022

Fax: 617.523.8118


Crestwood Advisors

One Liberty Square, Suite 500

Boston, MA 02109

www.crestwoodadvisors.com


$BKNG.US

[category earnings ]

[tag BKNG]


Zoetis 2Q20 earnings summary

Key Takeaways:


·         COVID-19 had less an impact on the US Companion segment than expected

·         Sales up 4% organic (FX impact -4%):

o   Companion animal +13% organic growth (US +19%, International +2%)

o   Livestock -5% organic (US -18%, International +4%)

·         Operating profit margin up 160bps

·         Q3 launch of disruptive technology diagnostic platform (Vetscan Imagyst)

·         Guidance raised due to Companion segment recovery


Share price: $161                     Target Price: $177 NEW (from $156)

Position size: 2.27%                TTM return: +30%


Zoetis released their 2Q20 results yesterday, with organic sales +4% organic (-4% FX impact), and a 4% increase in adjusted net income. Innovation was the driver of growth this quarter.

On the Companion Animal segment, their new drug Simparica Trio performed well in its full quarter of sales ($43M, vs. $15M in Q1 – with $100-125M targeted for the year), which was a pretty tough quarter for launching a new drug (limited rep sales, less vet visits). The drug also cannibalized less than expected the older Simparica drug, a positive surprise. Overall this segment recovered faster than expected from the Covid shutdowns.  


US Livestock product sales came down as meatpackers faced Covid related supply chain and manufacturing disruptions, and the food-service industry struggled with lockdowns. The company is expecting that this segment will remain under pressure throughout the rest of the year. The international livestock performed better as the diversity of the animal base mitigated some of the pressure.


The company is launching a new diagnostic system for in-clinic use called Vetscan Imagyst. This tool will use a combination of image recognition technology, algorithms and AI to deliver rapid detection of harmful parasites in pets. ZTS will charge a fee per read for each sample. This new toll will be launch towards the end of Q3 2020.


The resiliency of their pet business and ability to push innovation in the market were shown this quarter, and in our eyes justifies the premium valuation of the stock. We are raising our price target following a good quarter.


Guidance for 2020:

Revenue up 3%-6%

EPS $3.52-$3.68 from May guidance of $3.17-$3.42


Zoetis investment thesis:

·         Attractive industry profile: mid-single-digit growth rate, little generic threat, cash payers, pet sub-sector is very fragmented

·         ZTS is a leading diversified animal pharma company that continues to innovate to fulfill unmet animal needs

·         ZTS is growing above the industry rate and has proven resilient throughout economic cycle

·         Experienced management team has proven successful in increasing revenue and margins since the IPO in 2013

·         Good capital allocation strategy: M&A and capex spending have lifted sales and improved profitability


$ZTS.US

[category earnings] [tag ZTS]


Julie S. Praline

Director, Equity Analyst


Direct: 617.226.0025

Fax: 617.523.8118


Crestwood Advisors

One Liberty Square

Suite 500

Boston, MA 02109


www.crestwoodadvisors.com


Resmed 4Q FY20 earnings summary

Key Takeaways:


·         Good quarter with revenue up 10%, gross margin expansion of 60bps, operating profits up 24%

·         Strong ventilator sales (~10% of company sales) offsetting some sleep slowdown (~90% of sales) due to COVID

·         Gradual U-shaped recovery expected

·         Stock is weak today as next couple quarters see lower demand in ventilators that were supporting growth, and masks/devices take time to recover – stock had been a strong performer YTD, consolidation not surprising (we trimmed on valuation/position size at the end of June)


Current price: $179                     Price target: %179 (new from $168)  

Position size: 3.58%                    1-year performance: +56%


The company has manufactured 100,000 ventilators in 4Q, a rate we don’t expect to continue going forward. Resmed has partnered with Novartis, AstraZeneca, Orion and Boehringer on various inhalers. They now cover 90% of all inhalers in the US!

Software-as-a-service sales grew 7% this quarter, and is expected to keep growth in the mid-single-digits in the coming quarters as customers (mostly nursing facilities) struggle with COVID. The company accelerated the launch of its cloud-based remote monitoring software for ventilators across Europe, to allow doctor to remotely monitor patient’s conditions. The remote monitoring built into the devices pushed better compliance of usage by patients, and ability for clinicians to adjust the treatment. The greater push towards “value-based” reimbursement is also a trigger to get real feedback on treatment effectiveness.

Gross margin expanded 60bps thanks to product mix changes, partially offset by higher air freight costs. SG&A expenses went down 4% as the company saved on travel costs due to COVID-19.


The stock is down today as the tailwind from ventilator sales will fade in the coming quarters, combined with continued in-patient sleep labs below pre-COVID levels (~30% decrease in capacity). The management team reported a double-digit decline in new sleep patient diagnosis rate (COVID delaying doctor’s visits). Germany bounced back quicker (85% pre-COVID capacity), US at 70% while China behind at 50%. They are talking about a U-shaped recovery for their business. While in the US new patient starts is improving, the recovery is lagging expectations, on a stock that has performed very well YTD compared to peers. Their US resupply program with a recurring revenue stream is helping sales levels, providing some resiliency to revenue: around 80% of US mask growth comes from existing patients (not the case outside the US). In Western Europe and Asia, strict lock-downs, a smaller installed based, and payer constraints limits the resupply program (and thus masks growth this past quarter).


Outside the US, sales of ventilators lifted devices sales (+35%) thanks to contracts with national governments

Our long-term view on the stock is still valid, with the global sleep apnea market only ~20-30% penetrated, and market volume growth rate ~10% per year – an attractive market where Resmed and Philips play in duopoly. We are updating out estimate as we believe a recovery in FY21 will happen, and we roll forward our model.


FY21 guidance:

No gross margin expansion due to mix shift reversal and freight costs

SG&A to increase by low single digits

R&D growth in HSD to LDD

Tax rate 17-19%


Thesis on RMD:

  • Leading position in the underpenetrated sleep apnea space
  • Duopoly market
  • New product cycle
  • Returns of capital to increase: ~1% share buyback/year (back in FY18), dividend yield of 2%


$RMD.US

[category earnings] [category equity research] [tag RMD]


Julie S. Praline

Director, Equity Analyst


Direct: 617.226.0025

Fax: 617.523.8118


Crestwood Advisors

One Liberty Square

Suite 500

Boston, MA 02109


www.crestwoodadvisors.com


Disney Q3 Earnings Results

Current Price: $127         Price Target: $165

Position size: 1.5%          TTM Performance: -9.5%             


Key Takeaways:

·         Miss on revenue, but big beat on EPS as cost cutting and lower sports programming amortization mitigated losses from park closures.

·         Strong Disney+ performance – Overall, Disney+ continues to ramp better than expected w/ 60.5m subs currently. June 30 quarter end sub number (57.5m) was below expectations (59m), but current number is ahead.

·         Growing DTC plans – trialing pay-per-view DTC premier for Mulan in place of theaters, launching a Star-branded DTC service in international markets in calendar 2021 and planning an upcoming investor day related to DTC plans.


Additional Highlights:

·         Revenue was $11.8B vs $12.4B expected. Despite revenue down 42% YoY, driven largely by an 85% YoY drop in Parks segment revenue, Disney managed to post positive op income and FCF for the quarter. Op income was ~$1B vs expectations of about -$900M loss.

·         Collectively, management estimated COVID-19 had a net adverse op income impact of $2.9B, which was felt most in Parks segment. They were able to offset this across the business w/ cost cutting.

·         Overall, a very encouraging and upbeat call with an upcoming investor day in the coming months that mgmt. seemed very positive about. They’ll likely update Disney+ profitability guidance given it’s tracking way ahead of original targets. Additionally, the long-term speculation has been for a DTC model for ESPN – so this could be a potential topic.

·         Media:

o   Media Networks revenues for the quarter decreased 2% to $6.6 billion, and segment operating income increased 48% to $3.2 billion. Op income was up in Q3 due to higher results at both Broadcasting and Cable.

o   Broadcasting op. income was up due to lower programming and production costs, an increase in affiliate revenue, higher program sales and lower marketing costs. These increases were partially offset by lower advertising revenue.

o   Cable op income up due to increases at ESPN and FX Networks. ESPN benefited from lower programming and production costs and, to a lesser extent, higher affiliate revenue, partially offset by lower advertising revenue. ESPN’s lower programming costs were due to the deferral of rights costs for the NBA and MLB. The rights costs will be incurred as games are played in future quarters.

o   Several live sporting events have already returned to ESPN this quarter including Major League Soccer on July 8, Major League Baseball on July 23, and the NBA last Friday.

·         Parks, Experiences and Products:

o   Segment revenues decreased 85% to $1B, and segment op income decreased $3.7B YoY to a loss of $2B.

o   They are seeing a positive net contribution from re-opened parks in Orlando and Shanghai. Phased reopening of Shanghai, Paris, Tokyo, and Orlando, as well as the shopping and dining area at Disney Anaheim. Hong Kong opened then closed after less than 1 month due to government order.

o   Florida performing below expectations due to second wave of Covid, but still a positive net contribution. Shanghai performing better than expectations.

·         DTC:

o   Between Disney+, ESPN+, Hulu they now have >100m paying subs.

o   Int’l Star launch – in lieu of Hulu int’l. Will be a general entertainment offering under the Star brand in calendar year 2021. Primarily owned content from ABC Studios, Fox Television, FX, Freeform, 20th Century Studios and Searchlight.

o   60m subs at Disney+ was originally targeted for 2024, so they hit their 5 year target in about 8.5 months. And said they’re ahead of expectations in every geo, with big launches still ahead. They said India is 15% of subs. ARPU is $4.62, or $5.31 ex-India.

o   They launch Disney+ in the Nordics, Belgium, Luxembourg and Portugal in September, and in Latin America this November. And rolling out Disney+ Hotstar on September 5 in Indonesia, one of the world’s most populous countries. By year-end, Disney+ will be available in 9 of the top 10 economies in the world.

·         Studio:

o   Op income decreased as higher TV/SVOD distribution results, lower home entertainment marketing costs and lower film impairments were more than offset by lower theatrical distribution results. No significant titles released in the quarter. Lapping comparison of Avengers End Game from last year. No new TV and film production since March.

o   With Mulan they are primarily skipping theaters b/c of closures and going direct to platform on pay-per-view basis @ $30. This highlights their alternatives in their studio business. While studio has been a very profitable segment and is their content R&D factory, w/ DTC they can pivot on distribution and do so profitably. While they have no current plans to abandon the theater model and are considering this a test case, it’s important that they have options.

o   They need lower household penetration w/ DTC to be channel agnostic. With theater distribution, there is heavy marketing spending and their box office take rate is 45-50%. This is higher than other studios b/c of their clout w/~40% box office share and a heavy slate of blockbuster titles. So they would need to generate less than half the revenue w/ DTC release than theater release to achieve the same revenue. And the $30 per household grosses up to >$60 at the theater which is higher than typical household theater/movie spend, so from a household penetration perspective it would be even lower than 50% to be even. Additionally, a DTC launch could spur additional subs which have far higher lifetime value than their net profit after a 45% take rate at the theater. Finally, sidestepping the movie theater and having the direct transaction w/ the consumer gives them more data to drive other parts of their business…i.e. promos for consumer products or parks.

·         Balance sheet remains strong w/ plenty of liquidity.

·         No decision on dividend yet. Semi-annual and July dividend was suspended. They expect a decision in late Nov or early Dec.


Sarah Kanwal

Equity Analyst, Director


Direct: 617.226.0022

Fax: 617.523.8118


Crestwood Advisors

One Liberty Square, Suite 500

Boston, MA 02109

www.crestwoodadvisors.com


$DIS.US

[category earnings ]

[tag DIS]


CVS 2Q20 earnings summary

Key Takeaways:


·         “The environment surrounding COVID-19 is accelerating our transformation, giving us new opportunities to demonstrate the power of our integrated offerings and the ability to deliver care to consumers in the community, in the home and in the palm of their hand which has never been more important.” Said CEO Larry Merlo

·         Results lifted by the Health Benefits segment (increased sales and profits) and PBM

·         Retail segment weaker on lower volume and additional operating expenses

·         EPS and cash flow guidance for the year increased


Current Price: $64                            Price Target: $90

Position Size: 2.10%                        1-year Performance: +19%


CVS printed mixed results this morning with outperformance coming from their Health Benefits segment (+6.1% revenue growth y/y as it grew its medical members), which saw increased profitability (+141% y/y) driven by lower utilization rate (COVID impact of delaying elective surgeries, care visits). The company saw a shift in customer mix: less commercial as corporations furloughed employees/shrank workforce, and more people on Medicaid.

The PBM segment also delivered better results with higher volume in scripts. It retention rate for the 2021 selling season remains high at 98%. But the retail segment suffered from pantry destocking and additional operational expenses. The July trend in Retail looks to decelerate from June (+4.6% from +7.1%), similar to pharmacy trends (+1.9% in July vs. +12.4% in June).

During the call, the management team emphasized a greater focus on the flu vaccine season this year, as symptoms are close to the COVID symptoms, and the role their pharmacies can play in distributing those vaccines. Getting vaccinated against the flu could limit the public confusion as the flu season starts this fall. The COVID-19 is most likely accelerating the development of its integrated model of care vision (including telehealth and monitoring at home). The company currently has more than 1,800 drive-thru testing sites, and has launched a B-to-B testing program for corporations and colleges (40 signed up so far, with over 1,000 prospects). Interestingly, 40% of tested people through their site was not a CVS customer previously, which CVS intend to convert as they connect digitally. Overall we would say that CVS is on track with its 2022 target of integrating Aetna and normalizing EPS.


As a results of this quarter’s performance, the company is raising its FY20 EPS guidance:

·         EPS up to $7.14-$7.27 from $7.04-$7.17

·         Cash flow $11B-$11.5B from $10.5B-$11B


Thesis on CVS

  • Market leader: largest pharmacy benefit manager (PBM) in the US. This gives CVS scale advantage and negotiating power with pharma companies to obtain better drug pricing discounts. Also the largest US pharmacy retailer, giving it more touch points with consumers/patients. Finally, market share leader in long-term care pharmacy sector thanks to its Omnicare acquisition.
  • Stable and predictable top line and margin profile. CVS benefits from an ageing population in increasing needs of prescription drugs.
  • shareholder friendly, offering a 7% shareholder yield (5% share repurchase + 2.6% dividend yield)


$CVS.US

Category: earnings

tag: CVS


Julie S. Praline

Director, Equity Analyst


Direct: 617.226.0025

Fax: 617.523.8118


Crestwood Advisors

One Liberty Square

Suite 500

Boston, MA 02109


www.crestwoodadvisors.com


Colgate 2Q20 earnings summary

Key Takeaways:

·         Organic sales +5.5%

o   EM sales +2%

o   Developed markets: +8%

o   Hill’s pet nutrition +11.5% (are pets eating more now that their owners are with them all day?)

o   E-commerce sales +50% overall; US +200%, Hills +50%

·         Gross margin increased 120bps, operating margin up 30bps (increase in SG&A expenses was a negative)

·         2020 guidance not reinstated, most likely due to LatAm region uncertainty

·         Priority given to debt pay down over share repo in 2H20 – but good news! share repurchase activity to return in 2H


Current price: $76.9                Price target: $82 (from $77)  

Position size: 1.72%                1 year performance: +8% 


Once again Colgate delivered good organic growth, still benefitting from the pandemic impact on consumers staying at home in Europe and North America (less so in emerging markets as their lower growth rate shows). We should expect some of that pantry loading to go away in 2H (assuming no major second wave hitting Europe/North America), and sales level stabilize in the lower single digits range. FX continues to be a drag (-6%) and is forecasted to remain a negative this year. Profitability has seen the benefit of both volume (+2%) and price increases (+3.5%).

Colgate has a higher share of sales in oral care (58%) in the emerging markets (vs total company sales), and offers products in every price tier. So while Latin America struggles to recover from the COVID-19 crisis, likely impacting GDP growth, we can expect the consumers to trade down in price, which has been beneficial to Colgate in the past. During the last recession in Brazil, Colgate was able to gain market share in a pretty resilient category. The same happened in Russia (recession in 2015) and in Mexico (+170bps market share gain).

A testament of Colgate wide portfolio and resilient brands is its track record of positive organic growth, which has been positive every quarter but one since 2005.


Colgate has good cash management, with cash flows covering capex, dividend and share buyback needs. We updated our model and raise our price target to $82.


The Thesis on Colgate

  • High exposure to fast growing emerging markets (36% of Operating Profit from Latin America; 50%+ from EM)
  • Defensive Product set (soap and toothpaste). Product line less vulnerable to trade downs due to low private label exposure in the categories
  • Strong balance sheet (net debt/ebitda 1.4x) and highest ROIC in the sector
  • 2.64% dividend yield


$CL.US [tag CL] [category earnings]


Julie S. Praline

Director, Equity Analyst


Direct: 617.226.0025

Fax: 617.523.8118


Crestwood Advisors

One Liberty Square

Suite 500

Boston, MA 02109


www.crestwoodadvisors.com