JPIN – Q4 2020 Commentary

JPMorgan Diversified Return International Equity Commentary – Q4 2020

Thesis

JPIN’s focus on risk weighting enabled us to replace a market cap weighted index while still gaining exposure to international developed equity markets without deviating too far from the benchmark. Utilizing a multi-factor approach of value, quality, and momentum, JPIN has generated alpha through strong stock selection over time. Additionally, the fund helps diversify risk by weighting across 40 regional/sector buckets based on rolling risk statistics, which ultimately increases our exposure to active share and our risk-adjusted returns.


[more]


Overview

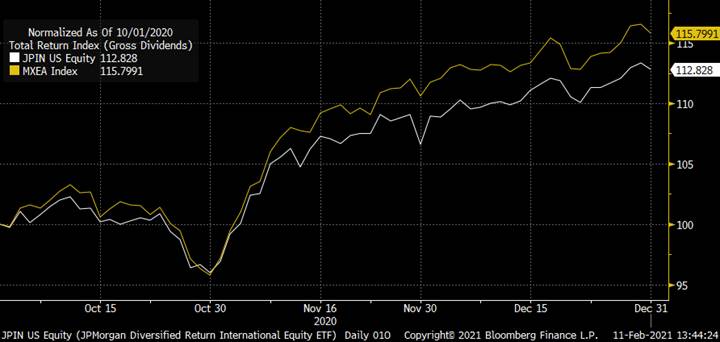
In the last quarter of 2020, JPIN underperformed the benchmark (MSCI EAFE Index) by 220bps largely due to factor exposure to Quality and Momentum. Value’s strong rebound did contribute to returns, though. Overweight to oil & gas benefited returns while and underweight to financials detracted. The fund’s overweight to Asia ex-Japan were also beneficial, yet the overweight to Japan detracted from overall performance.


Q4 2020 Summary

  • JPIN returned 13.85%, while the MSCI EAFE Index returned 16.05%
    • FTSE Developed ex North America Index returned 17.26%
  • Contributing sectors included oil & gas as the sector recovered during the quarter, while financials detracted
  • South Korea and New Zealand contributed to returns, yet Japan detracted


Optimistic Outlook

  • We continue to hold this fund and believe in our thesis due to the fund’s multi-factor approach, consistency in asset allocation, and historically strong stock selection
  • Going forward JPIN continues to see Momentum, Value, and Quality all as profitable factors
    • Value and Quality appear to be relatively cheap


[Category Mutual Fund Commentary]


Micah Weinstein

Research Analyst


Direct: 617.226.0032

Fax: 617.523.8118


Crestwood Advisors

One Liberty Square

Suite 500

Boston, MA 02109

www.crestwoodadvisors.com


Disney reported strong Q1 earnings

Current Price: $189     Price Target: $215

Position size: 2%          TTM Performance: +35%   

 Key Takeaways:

  • Broad beat – big profitability beat driven by better-than-expected results in DTC and parks.
  • Better than expected subscriber numbers across all streaming services – Disney+ has 95M subs ahead of expected 90M. They now have 146M subs across Disney+, Hulu and EPSN+. That is second only to Netflix, which has about 204M.
  • Parks showing promising signs of demand and open parks contributing to profitability


Additional highlights:

  • DTC decrease in operating loss was due to better subscriber numbers across Hulu, Disney+, ESPN+ and increased ad revenues.
  • Disney+ now has 95M subs ( goal is 230-260m Disney+ subs by 2024), Hulu is ~40M and ESPN has >12M. 

  • They had revealed 87M Disney+ subs at investor day at beginning of Dec, so subs up 8M in Dec alone. 

  • DIS DTC business generated $3.5B in revenue last quarter vs Netflix’s Q4 revenue of $6.6B.

  • Star International streaming service – announced at their investor day in December, is launching Feb. 23.

  • Disney+ ARPU down on mix given higher growth in lower ARPU international regions. Increasing prices in US and Europe by $1.

  • India is 1/3 of Disney+ – their Indian streaming service Disney+ Hotstar accounts for ~30% of global subscriptions, or about ~32 million customers.

  • Solid conversion from Verizon free promos. 

  • ESPN – in response to an analyst question about poor viewership of the Super Bowl (lowest in more than a decade), and what it means for ESPN. Chapek said they’re looking at the “long-term” trends of sports viewership and is mulling a “a more true ESPN direct-to-consumer” service. 

  • Parks re-openings…

    • Parks and resorts that were opened during the quarter all operated at significantly reduced capacities, yet all achieved a net incremental positive contribution during the period they were open – meaning revenue exceeded the variable costs associated with being open.

    • Walt Disney World Resort (FL) and Shanghai Disney Resort were open for all of Q1. 

    • Disneyland Resort (CA) was closed and the cruise business was suspended for the full quarter. 

    • Disneyland Paris was open until the end of October, or for about one-third of the quarter. 

    • Hong Kong Disneyland was opened until the beginning of December or for about two-thirds of the quarter.

    • Disneyland and Disneyland Paris are expected to stay closed until at least the end of this fiscal quarter. 

    • Disneyland Hong Kong may reopen in the quarter.

  • Vaccination rates – are the main determining factor for reopening parks. Chapek said vaccines would be a “game-changer” for Disney if they’re distributed to everyone who wants one this year. Though he expects you’ll see mask-wearing and social-distancing in Disney parks at least until the end of 2021, and probably 2022.

  • Attendance improving – Average daily attendance at Walt Disney World is growing – a sign demand for theme parks is strong. Attendance expanded “significantly” in the last three months of the year, compared to the previous quarter.


Sarah Kanwal

Equity Analyst, Director


Direct: 617.226.0022

Fax: 617.523.8118


Crestwood Advisors

One Liberty Square, Suite 500

Boston, MA 02109

www.crestwoodadvisors.com


$DIS.US

[category earnings ]

[tag DIS]

HLMEX – Q4 2020 Commentary

HLMEX Commentary – Q4 2020

Thesis

HLMEX utilizes fundamental research to find companies with strong quality and growth metrics that can be compared across the global landscape. By focusing on investments with competitive advantages, long-term growth potential, quality management, and corporate strength, HLMEX offers diversity to our EM allocation while generating alpha over the long run. We continue to hold the fund because of the team’s conviction in high quality companies and managed risk through diversification and evaluation.


[more]


Overview

In the fourth quarter of 2020, HLMEX outperformed the benchmark (MSCI Emerging Markets Index) by 352bps largely due to Financial holdings, specifically banks. Overall strong stock selection within the Consumer Staples and Energy sectors also contributed to returns. An overweight to Information Technology also helped returns, yet weak selection with the sector detracted from returns. Stock selection in India, China, and smaller EM regions along with strong selection in Industrials helped contribute to performance for the quarter.


Q4 2020 Summary

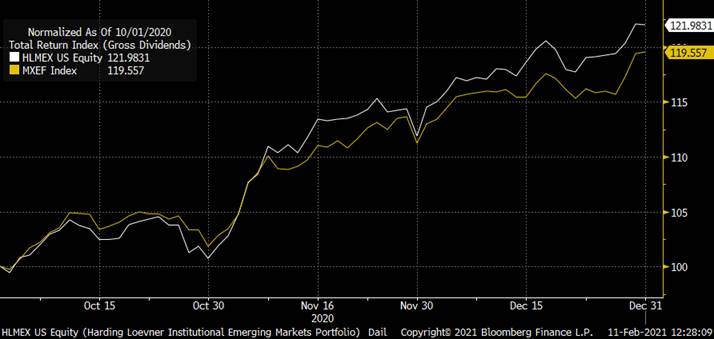
  • HLMEX returned 23.29%, while the MSCI Emerging Markets Index returned 19.77%
  • Contributors
    • Samsung Electronics, TSMC, HDFC Corp, Midea Group, Tencent
  • Detractors
    • Alibaba, CSPC Pharmaceutical Group, CD Projekt, 51Job Inc, Commercial International Bank


Outlook

  • We continue to hold this fund and believe in our thesis due to the fund’s focus on quality by emphasizing earnings growth and strong cash flow to gain attractive returns over the long run
  • Avoid falling into the momentum trap and sticking with quality names with low turnover (16% in 2020)
  • Made three new investments and sold 3 names during the quarter
  • Continue to invest in durable growth – quality focus with attractive valuations

[Category Mutual Fund Commentary]


Micah Weinstein

Research Analyst


Direct: 617.226.0032

Fax: 617.523.8118


Crestwood Advisors

One Liberty Square

Suite 500

Boston, MA 02109

www.crestwoodadvisors.com


REEIX – Q4 2020 Commentary

REEIX Commentary – Q4 2020

Thesis

REEIX is driven through both top-down and bottom-up fundamental research that provides diversification within our full EM allocation. The fund looks for high quality companies across all market caps that have strong ESG scores. We like REEIX because of the consistent and repeatable process that allows the team to take advantage of companies with sustainable growth across all the Emerging Market (EM) landscape.


[more]


Overview

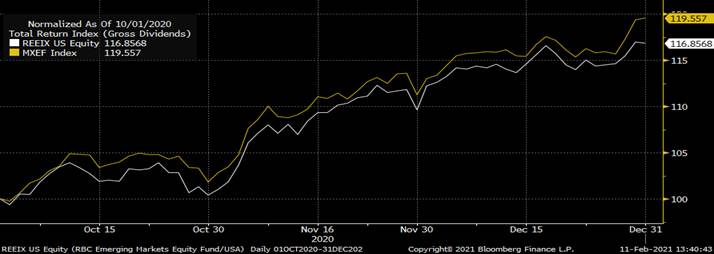
In the fourth quarter of 2020, REEIX underperformed the benchmark (MSCI Emerging Markets Index) by 291bps largely due to weak stock selection in China and Taiwan, although slightly offset by strong selection in Chile. Underweight to China was also beneficial to the fund’s returns. On a sector level, the fund’s selection in Information Technology detracted from returns, while selection within Financials benefitted performance. Allocation effect had no effect during the quarter.


Q4 2020 Summary

  • REEIX returned 16.86%, while the MSCI Emerging Markets Index returned 19.77 %
  • Contributors
    • Chile and Financials
  • Detractors
    • China, Taiwan, and Information Technology


Outlook

  • We continue to hold this fund and believe in our thesis due to the fund’s historically strong returns and understanding of Emerging Markets on both a macro and micro level
  • See potential for EM securities outperform the U.S. markets as the dollar weakens
    • Federal Reserve’s aggressive balance sheet expansion
    • Surge in U.S. fiscal deficit
    • The majority of EM regions have been relatively more successful than developed countries when it has come to eliminating COVID
  • Positive
    • India, Mexico, Brazil, Chile, China, Consumer and Financial sectors
  • Negative
    • Latin America
  • 5 focused themes
    • Domestic consumption
    • Health and wellness – long term beneficiaries due to COVID
    • Digitalization – will get a boost from increased online migration and connectivity
    • Financialization
    • Infrastructure – added “Green Infrastructure” as climate change has become a larger conversation across firms

[Category Mutual Fund Commentary]


Micah Weinstein

Research Analyst


Direct: 617.226.0032

Fax: 617.523.8118


Crestwood Advisors

One Liberty Square

Suite 500

Boston, MA 02109

www.crestwoodadvisors.com


LISIX – Q4 2020 Commentary

LISIX Commentary – Q4 2020

Thesis

LISIX is a bottom-up, growth-based fund that completes the core satellite strategy within global equity. The fund is unique in that it focuses on individual stocks rather than markets and looks for reasonably priced companies with strong growth potential. We like LISIX because of the managers’ expertise in various market caps, geographies, and sectors which helps keep the fund diversified while providing strong upside and downside capture over time.


[more]


Overview

In the fourth quarter of 2020, LISIX outperformed the benchmark (MSCI EFEA Index) by 114bps due to both allocation and strong security selection within Industrials. Consumer Staples and Health Care also contributed to performance, while Consumer Discretionary and Financials detracted. Regionally, the UK positively contributed to returns, while Asia ex-Japan had a negative effect on the fund’s performance.


Q4 2020 Summary

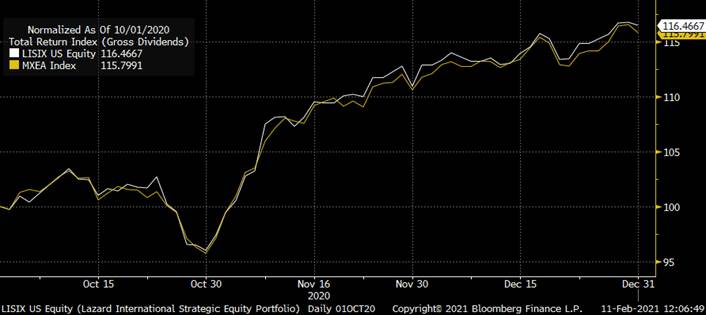
  • LISIX returned 17.19%, while the MSCI EAFE Index returned 16.05%
  • International markets as a whole saw a strong rebound upon vaccine news
    • Foreign currency strength also helped international stocks outperform dollar denominated stocks
  • The “value” factor also saw strong performance during the quarter as it began to rebound and outperform growth


Outlook

  • We continue to hold this fund and believe in our thesis due to the fund’s strong stock selection, ability to find well valued companies, and expertise in various market caps, geographies, and sectors
  • Europe is attractive given valuations, potential profit recovery, government stimulus, and political calm
  • Opportunities may be more balanced with a focus on “stay at home” and recovery stocks
    • Potential for value to lead stock returns – similar to 2011-2015
  • Encouraged by developments in Europe, yet remain underweight in Japan


[Category Mutual Fund Commentary]


Micah Weinstein

Research Analyst


Direct: 617.226.0032

Fax: 617.523.8118


Crestwood Advisors

One Liberty Square

Suite 500

Boston, MA 02109
www.crestwoodadvisors.com


HILIX – Q4 2020 Commentary

HILIX Commentary – Q4 2020

Thesis

Serving as a satellite holding, HILIX is a value style fund that takes advantage names that have underperformed recently and are cheaply priced. The team generates alpha by finding companies with strong fundamentals that are overlooked during times of low consensus expectations. We like that HILIX takes advantage of extremes and gains exposure to less efficient market caps by having more holdings and moderate active bets.


[more]


Overview

In the fourth quarter of 2020, HILIX outperformed the benchmark (MSCI EFEA Index) by 485bps due mainly to the fund’s allocation to Energy and Financials. An underweight to Health Care and Consumer Staples also contributed to return, as did strong stock selection within Industrials, Consumer Staples, and Information Technology. Selection in Developed Europe & Middle East ex UK also benefitted overall performance. Yet, exposure to Information Technology, selection within Materials, Communication Services, and Developed Asia Pacific ex Japan detracted from returns.


Q4 2020 Summary

  • HILIX returned 20.90%, while the MSCI EAFE Index returned 16.05%
  • Top issuer contributors
    • Dongfeng Motor Group
    • Bank of Ireland
  • Top issuer detractors
    • Barrick Gold
    • Not owning Banco Santander


Outlook

  • We continue to hold this fund and believe in our thesis due to the fund’s value and bottom-up, fundamental approach
    • The fund saw heavy underperformance during most of 2020, but has since began to rally back in Q4 2020 and Q1 2021 as the “value” style continues to rebound
  • The fund continues to focus on companies that are not trading at extreme valuations
    • New positions include Japan Airlines and BAE Systems – both have strong balance sheets and low valuations
    • Trimmed positions include Maersk and JSR – both trading at highs well above their fundamentals
  • Value has been underperforming for some time, yet historically it has proven to outperform through full market cycles


[Category Mutual Fund Commentary]


Micah Weinstein

Research Analyst


Direct: 617.226.0032

Fax: 617.523.8118


Crestwood Advisors

One Liberty Square

Suite 500

Boston, MA 02109

www.crestwoodadvisors.com


Pepsi 4Q 2020 earnings summary

Key takeaways:


Current price: $136                           Price target: $153  

Position size: 1.94%                         1-year performance: -6%


Overall Pepsi delivered a good quarter with sales beating expectations in a market still impacted by Covid disruptions (away-from-home channels). The stock is not reacting positively however as guidance for 2021 implies flat cash flows from 2020, and as the company focuses on repaying debt and spending more in capex, rather than share repurchases.


  • Organic sales growth of +5.7% (an acceleration from the 4% last quarter) – to end the full year organic growth at +4.3%. This is above competitor Coke who had -3% organic growth – a proof of PEP business model resiliency
    • Sales came above consensus of 4.3% – driven by volume and price/mix equally
    • Consumption at home remained strong throughout the quarter, but pressure remains in the foodservice channels.
    • Both snacks and beverages grew mid-single digits
    • North America grew +5% and International +6%
  • Overall profits increased 6% even with Covid-related costs:
    • Frito-Lay NA: decline due to Covid charges
    • Quaker Foods: profitability increased due to better revenue and productivity savings but also lower advertising expenses
    • Pepsi Beverages NA: profitability increased due to better revenue and productivity savings but also lower advertising expenses, and lower commodity costs
    • Latin America & Europe: FX impacted the cost of commodities and negatively impacted profits
    • Africa. Middle East & South Asia: profits growth driven by revenue growth and productivity savings, as well as the acquisition of Pioneer Foods
    • Asia Pac, Australia/NZ and China: growth from productivity savings and revenue growth


  • Bang Energy Drinks will no longer be distributed by Pepsi starting in Oct 2023
  • Gatorade Zero is now a $1B in sales brand
  • Covid had an impact on snacking on the go (impulse buy at convenience stores), that was high volume, high margin business. Now people take breaks at home, so Pepsi is selling more multi-pack, small portion format snacks


  • 2021 guidance:
    • Organic sales growth expected in the mid-single digits
    • High-single digits EPS growth
    • Cash flow outlook no longer provided
    • Dividend increase of 5% (total of $5.8B), share repurchase of $100M (vs. $2B in 2020)
      • Focus on capex and debt reduction to keep rating vs. buyback this year
      • Capex spending used to be around 5% of sales, now will run towards 6% for a couple of years
        • expand its digitalization of supply chain and selling system and IT
        • increase capacity
        • automation


Thesis on Pepsi:

  • Global growth opportunity with about 40% of profits coming from outside the US. CSD is only 25% of sales (and Pepsi brand only 12%)
  • Strong market share in high growth emerging markets where there is low penetration and rising per capita consumption
  • Resilient snack business provides pricing power and visibility to future cash flows (more than half of sales are from snacks not beverages). CSD is only 25% of sales (and Pepsi brand only 12%)
  • Several Great brands driving global growth: Frito Lay, Quaker, Gatorade
  • Strong balance sheet and cash flows support a solid dividend yield and share buyback program


Tag: PEP

category: earnings

$PEP.US


Julie S. Praline

Director, Equity Analyst


Direct: 617.226.0025

Fax: 617.523.8118


Crestwood Advisors

One Liberty Square

Suite 500

Boston, MA 02109


www.crestwoodadvisors.com


FIQSX – Q4 2020 Commentary

FIQSX Commentary – Q4 2020

Thesis

FIQSX is a large floating rate fund that has a strong historical returns and a tenured management team. By investing purely in senior bank loans, FIQSX further increases our potential upside gain, reduces our duration-risk, and decreases our interest rate risk. We like that the fund utilizes a bottom-up investment process through proprietary framework analysis, avoids high-yield corporate bonds, and allocates to relatively higher-rated securities within the floating rate security space.


[more]


Overview

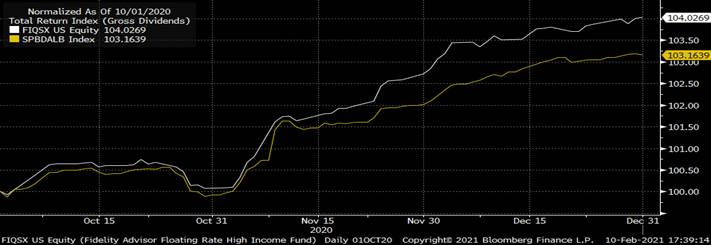
In the fourth quarter of 2020, FIQSX outperformed the benchmark (S&P/LSTA Leveraged Loan Index) by 23bps primarily due to security selection in oil & gas and nonferrous metals/minerals. Contrarily, allocation to cash and selection in business equipment & services and food service detracted from returns. A small allocation to high-yield credit performed in line with the benchmark, and thus had relatively no effect on overall performance.


Q4 2020 Summary

  • FIQSX returned 4.04%, while the Leveraged Loan Index returned 3.81%
  • Quarter-end effective duration for FIQSX was 0.17 and 0.11 for the Leveraged Loan Index
  • Largest contributors
    • California Resources – out-of-benchmark position in oil & gas
    • Murray Energy – out-of-benchmark position in thermal coal mining
  • Largest detractors
    • CEC Entertainment – out-of-benchmark position in restaurant industry
    • No owning American Airlines


Optimistic Outlook

  • We hold this fund due to its relatively high yield and shorter duration, especially as we believe that rates will increase in the coming years
  • Expect continued volatility, but for corporate fundamentals and supply-and-demand dynamics to improve
  • The team will continue to search for opportunities in the loan space, even as BB and B-rated securities have approached par
    • Opportunities for capital appreciation have become limited
    • New loans with a LIBOR floor are coming to market


[Category Mutual Fund Commentary]


Micah Weinstein

Research Analyst


Direct: 617.226.0032

Fax: 617.523.8118


Crestwood Advisors

One Liberty Square

Suite 500

Boston, MA 02109
www.crestwoodadvisors.com


EIBLX Commentary – Q4 2020

EIBLX Commentary – Q4 2020

Thesis

EIBLX is a large floating rate fund that has a strong historical returns and a tenured management team. By investing purely in senior bank loans, EIBLX further increases our potential upside gain, reduces our duration-risk, and decreases our interest rate risk. We like that the fund utilizes a bottom-up investment process through proprietary framework analysis, avoids high-yield corporate bonds, and allocates to relatively higher-rated securities within the floating rate security space.


[more]


Overview

In the fourth quarter of 2020, EIBLX underperformed the benchmark (S&P/LSTA Leveraged Loan Index) by 13bps primarily due to the fund’s higher-quality security exposure – the fund’s underweight to CCC-rated bonds detracted from overall performance. Small cash allocation and avoidance of airline credit also weighed negatively on returns. Yet, overweight to health care, education technology, specialty pharma, and home furnishing credits contributed to returns, as did the fund’s underweight to the Utility sector and underexposure to CLOs.


Q4 2020 Summary

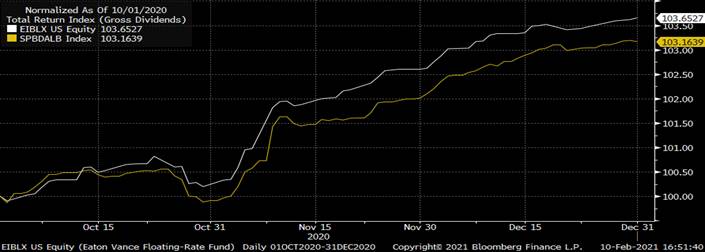
  • EIBLX returned 3.68%, while the Leveraged Loan Index returned 3.81%
  • Quarter-end effective duration for EIBLX was 0.26 and 0.11 for the Leveraged Loan Index
  • Three largest contributors
    • Envision Healthcare Hldg, Skillsoft Corporation, Serta Simmons Bedding LLC
  • Three largest detractors
    • Cash, American Airlines Group, Ameriforge Group Inc


Optimistic Outlook

  • We hold this fund due to its relatively high yield and shorter duration, especially as we believe that rates will increase in the coming years
  • New vaccines provide promise in seeing the economy and businesses reopen
  • Loan prices are forecasting for improvement going forward, and while there is potential for higher level of risks, management does not see this as something that will directly affect loans’ attractiveness


[Category Mutual Fund Commentary]


Micah Weinstein

Research Analyst


Direct: 617.226.0032

Fax: 617.523.8118


Crestwood Advisors

One Liberty Square

Suite 500

Boston, MA 02109

www.crestwoodadvisors.com


CSCO Q2 2021 Results

Current Price: $46                           Price Target: $58 

Position size: 2.8%                          TTM Performance: -1%


Key Takeaways:

·        Top line and EPS beat with better-than-expected revenue guidance.

·        Macro environment improving but still seeing uneven trends in enterprise – saw improvement in all major customer segments, but weakness persists w/ large customers in hard hit industries like retail and hospitality, while other sectors are improving. Saw continued improvement with commercial customers (SMBs). Public customers (i.e. gov) is an area of strength. And Service Providers (telecom/cloud) is improving driven by share gains with hyperscale cloud providers.

  • Secular drivers still in place – aging network infrastructure needs to be upgraded. Growing use of new technologies and increased data demand places increased importance on this.

·         Mix shift to software and recurring revenue continues as an increasing number of their products are to be offered this way.

·         Cost cutting to aid earnings power –  $1B in annual cost reductions to be implemented over next few quarters.

·         CEO Chuck Robbins said“we are seeing encouraging signs of strength across our business as the recovery takes shape, with all customer segments showing improvement in year-over-year growth rates”…” I am confident in our ability to capture the long-term opportunities ahead, in areas such as cloud, 400 gig, 5G, security, hybrid work and next-generation applications.”


Additional Highlights:  

·       Overall, business trends are improving and they are lapping easy compares this coming year amidst some aggressive cost-cutting initiatives, transition to software/subscription continues, valuation is inexpensive, and they have a high dividend yield (3.2%) that’s easily covered. 

  • Q3 revenue guided to 3.5%-5% w/ street expecting ~2.8%.
  • Strong gross margins – GM was 70%. The highest since 2006.
  • Total product revenue was $8.6 billion, down 1% – product revenue (>70% of total rev; rest is services) is comprised of Applications (flat), Security (+10%) and Infrastructure Platforms (down 3%). Infrastructure platforms is >50% of revenue and is the product area most impacted by the COVID environment.
  • Continue to see signs of gradual improvement led by order growth in Commercial, Public Sector and Service Provider businesses, which together account for nearly three quarters of product orders. The Enterprise market remains soft, driven by some elongated sales cycles and a continued pause in spending among some customers brought on by the pandemic.
  • Acacia acquisition should close next quarter. Gives them optical technology that should help their competitive position in 400G upgrades essential to meet bandwidth requirements and high-speed connectivity.

·       Improved demand commentary relative to last quarter…

    • Order trends have broadly improved QoQ across every region and customer segment.
    • From a product revenue perspective – saw strength in Catalyst 9K, data center switching, security, wireless and Webex (600 million quarterly average users) portfolios. Cat 9K momentum continues, up double-digits, aiding improvement in campus switching. Security revenue grew +10% Y/Y driven by good momentum in its cloud offerings, Duo and Umbrella.
    • “Looking ahead, we are cautiously optimistic, as recent surveys of IT spending indicate year-over-year IT budget growth for calendar 2021 and Cisco remains well-positioned among CIOs top forward-looking spending priorities, including network infrastructure, cyber-security software, as well as cloud migration and cloud infrastructure.”

·        Positive commentary points to continued software/services mix shift and strength in new products –This includes strong demand for their Catalyst 9000, security, WebEx and other SaaS-based solutions. Software mix is close to 1/3 of revenue ($3.6B in Q2), w/ 76% of software sold as subscription. That means almost 1/4 of total sales is from software subscriptions sales (or ~$12B). Additionally, 27% of rev is services with much of that from maintenance/support which tend to be recurring. So overall recurring revenue could be 40% or more (they don’t break it out specifically). So while top line growth has been weak, the mix shift happening w/in their business should be supportive of their multiple and their margins. They intend to grow this mix over time.

·        Momentum w/ web-scale cloud providers – the positive commentary from last few quarters continued. They disclosed that Webscale was 25% of Service Provider orders (larger than expected) and order growth accelerated, up >100% in Q2. This is an end market where they lost share to Arista in the past, but their positioning is improving w/ new products launched last year. That being said, this is still early stages – mgmt. indicated it may take a year or two for this to be a meaningful top line contributor. Could see performance vary quarter to quarter, due to the timing of large deals, but they are “incredibly confident” around their prospects in this area.

·        Valuation: trading at >7% FCF yield on fiscal 2021, which ends in July. This is well below S&P average of <4%, for a strong balance sheet, high FCF generative business (~30% FCF margins) w/ a growing mix of software and recurring revenue. Despite macro headwinds, fundamentals continue to be supported by business transformation/digitization trends at a reasonable valuation while much else in tech has seen substantial multiple expansion. Additionally, their valuation is supported by a 3.2% dividend yield which they easily cover. They have ~$16B in net cash on their balance sheet, or almost 8% of their market cap.


Sarah Kanwal

Equity Analyst, Director


Direct: 617.226.0022

Fax: 617.523.8118


Crestwood Advisors

One Liberty Square, Suite 500

Boston, MA 02109
www.crestwoodadvisors.com


$CSCO.US

[category earnings ]

[tag CSCO]