TCPNX – Q4 2020 Commentary

TCPNX Commentary – Q4 2020

Thesis

TCPNX is a smaller fund that does not have as many assets under management compared to our other core mangers, enabling them to make more nimble and tactical decisions. By making small allocations to undervalued “riskier” asset classes (high-yield and non-dollar denominated debt), TCPNX diversifies our fixed income portfolio and generates superior returns to the benchmark (Barclays U.S. AGG). We like that the fund utilizes a bottom-up investment process through proprietary framework analysis, fundamental security review, and portfolio risk management.


[more]


Overview

In the fourth quarter of 2020, TCPNX underperformed the benchmark (Barclays U.S. AGG) by 9bps primarily due to the headwind caused by the movement in credit spreads, which the fund has minimal exposure to. Allocations to U.S. Agencies and Agency Multi-Family MBS benefitted the fund, though. Additionally, all spread sectors nearly outperformed the equivalent U.S. Treasuries for the quarter. Yet lack of exposure to Industrials and Financials hurt performance, and the fund’s overweight to Utilities lagged compared to the other sectors.


Q4 2020 Summary

  • TCPNX returned 0.58%, while the U.S. AGG returned 0.67%
  • Quarter-end effective duration for TCPNX was 5.80 and 6.22 for the U.S. AGG
  • Three largest contributors
    • Airline Enhanced Equipment Trust Certificates, High Yield bonds, holdings in Kansas City Southern
  • The top detractors
    • Allocation to Utilities, U.S. Small Business Administration Development Company Participation Certificates, U.S. Treasury Separate Trading of Registered Interest and Principal of Securities


Optimistic Outlook

  • We continue to hold this fund and believe in our thesis due to the fund’s consistent and defensive approach that we expect to generate alpha through times of low volatility
  • Agreeing with the Fed in that there is not a big concern for a acceleration in inflation
  • Continue to maintain a duration neutral portfolio, with a focus on spread products, SBA, and Agency Multi-Family MBS debt as they are positioned to benefit going forward

[Category Mutual Fund Commentary]


Micah Weinstein

Research Analyst


Direct: 617.226.0032

Fax: 617.523.8118


Crestwood Advisors

One Liberty Square

Suite 500

Boston, MA 02109

www.crestwoodadvisors.com


WATFX – Q4 2020 Commentary

WATFX Commentary – Q4 2020

Thesis

WATFX is an actively managed fund that finds overlooked areas of the market that can go against consensus views and add value. Through internal macro, credit, and fundamental research WATFX identifies undervalued securities and takes on more credit exposure to generate alpha over time. Through a diversified approach to interest rate duration, yield curve, sector allocation, and security selection, the fund dampens exposure to volatility.


[more]


Overview

In the fourth quarter of 2020, WATFX outperformed the benchmark (Barclays U.S. AGG) by 132bps largely due to corporate credit positions and USD-denominated EM exposure. Lengthened duration, TIPS allocation, investment-grade corporates (and fallen-angels), agency MBS, structured products, and EM exposure all positively impacted performance. Poor yield-curve positioning was the only detractor during the quarter as yields began to steepen.


Q4 2020 Summary

  • WATFX returned 1.99%, while the U.S. AGG returned 0.67%
  • Quarter-end effective duration for WATFX was 6.9 and 6.22 for the U.S. AGG
  • Trimmed investment-grade corporate credit exposure as spreads continued to tighten
  • Trimmed TIPS exposure as 30-year breakeven inflation rates rose to highs


Outlook

  • We continue to hold this fund and believe in our thesis due to the fund’s diverse approach and strong top down-bottom up fundamental value investing over the long-term
  • Market have been rallying since the bottom in March – momentum will continue to carry the market forward
    • COVID resurgence and slack in the global economy will keep volatility around
  • The fund is excited to seek out opportunities as spreads widen and the Fed continues to support corporate credit markets

[Category Mutual Fund Commentary]


Micah Weinstein

Research Analyst


Direct: 617.226.0032

Fax: 617.523.8118


Crestwood Advisors

One Liberty Square

Suite 500

Boston, MA 02109

www.crestwoodadvisors.com


DBLTX – Q4 2020 Commentary

DBLTX Commentary – Q4 2020

Thesis

DBLTX utilizes a top down-bottom up process that focuses on MBS and Agency bonds. When compared to the benchmark (Barclays U.S. AGG), the holdings have lower duration and exposure to corporate bonds, reducing their sensitivity to interest rate movements and credit spreads. We expect attractive risk-adjusted return characteristics over the long term from DBLTX, especially during periods when corporate bonds’ spread increase and the yield curve steepens.


[more]


Overview

In the fourth quarter of 2020, DBLTX underperformed the benchmark (Barclays U.S. AGG) by 24bps, largely due to asset allocation within the securitized credit sectors – investment grade corporate bonds in the index outperformed. Yet, each sector within the fund generated positive returns, with commercial mortgage-backed securities and asset-backed securities performing best. CLOs and non-Agency RMBS also contributed to returns, yet minimally as they had already spiked back in the summer. Agency MBS was the only sector the detracted from performance due to a steepening curve and an investor focus on credit risk assets.


Q4 2020 Summary

  • DBLTX returned 0.43%, while the U.S. AGG returned 0.67%
  • Quarter-end effective duration for DBLTX was 3.33 and 6.22 for the U.S. AGG
  • The top two performers were commercial MBS and non-Agency CMBS
    • Both were under substantial pressure due to the pandemic, but spiked once there was positive vaccine news


Outlook

  • We continue to hold this fund due to the approach and strong diversification factor within our core bond holdings – yet we are looking further into the holding as the year-to-date volatility and underperformance has made us reassess the approach
  • DBLTX is a good position to hold due to its low duration which outperforms during periods of rising rates – Treasury yields were at all time lows in 2020, but have recently been steepening which is good news for DBLTX
  • Historically, DBLTX has displayed stronger returns and lower volatility than the index
  • DBLTX has had consistent strategy, allocation focus, and sector distribution

[Category Mutual Fund Commentary]


Micah Weinstein

Research Analyst


Direct: 617.226.0032

Fax: 617.523.8118


Crestwood Advisors

One Liberty Square

Suite 500

Boston, MA 02109

www.crestwoodadvisors.com


MWTIX – Q4 2020 Commentary

MWTIX Commentary – Q4 2020

Thesis

MWTIX is an actively managed fund that provides a sector-based strategy while still maintaining fundamental research driven through issue selection. When compared to the benchmark (Barclays U.S. AGG), the holdings have similar duration and exposure, yet selection is focused around areas where other managers are not looking. Through sector rotation and active weighting, we expect MWTIX to generate alpha over time.


[more]


Overview

In the fourth quarter of 2020, MWTIX outperformed the benchmark (Barclays U.S. AGG) by 53bps, largely due to issue selection across corporate credit – specifically consumer non-cyclical, communications, and energy. Selection in EM, municipal exposure, and allocation to low coupon agency MBS TBAs also positively attributed to returns. A strong annual return of 9.12% can mostly be contributed to Non-agency MBS exposure as the asset class saw strong recovery throughout 2020. CMBS and ABS were trimmed during the year and had minimal impact on the fund’s performance.


Q4 2020 Summary

  • MWTIX returned 1.20%, while the U.S. AGG returned 0.67%
  • Quarter-end effective duration for MWTIX was 5.66 and 6.22 for the U.S. AGG
  • Duration was trimmed during the year and was maintained at a range of 0.5-0.6 years short of the benchmark


Outlook

  • We continue to hold this fund and believe in our thesis due to the fund’s defensive approach and minimal exposure to more vulnerable issuers and industries
  • Opportunities
    • Pass-through pools – TBAs
    • Larger spread corporate bonds
    • Securitized credit – legacy non-agency MBS, high-rated CMBS
    • EM debt
  • MWTIX has positioned itself to take advantage of relatively attractive prices during times of high volatility to generate strong returns


[Category Mutual Fund Commentary]


Micah Weinstein

Research Analyst


Direct: 617.226.0032

Fax: 617.523.8118


Crestwood Advisors

One Liberty Square

Suite 500

Boston, MA 02109

www.crestwoodadvisors.com


Schwab Q4 results and recap of winter update

On 2/2, Schwab hosted their winter update for Q4.  Schwab posted strong quarterly earnings of $.74. beating estimate of $.69.  Key takeaways are:

  • Total client assets rose to $6.7t up from $4.0t at Q4 2019 with organic growth of 7%.
  • Trading, securities lending and margin lending surged during the quarter, helping interest income.  Schwab has handled this influx of retail business relatively well.


Despite lower interest rates, we remain optimistic that SCHW will grow EPS at a mid-teens rate through the cycle:

  • Grow AUM organically at ~6%
  • Stock market growth of ~6.5%
  • Increase margins due to scale and cost savings from merger.


Current Price: $55.8                         Price Target: $68 (up from $48)

Position Size:   2.13%                       Performance TTM: 20.2%


Q4 Highlights:

  • Total client assets rose to $6.7T, with core new asset growth of 7%. 
  • Net interest margin of 1.55% up from 1.34%
    • Average interest earning assets rose 72% ($462b) driven by market volatility and mergers.
    • Schwab acquired $166b in deposits from (USAA and TD) which will be transitioned to Schwab’s balance sheet at roughly $20b per year, so deposit growth will have a tailwind.
    • Revenue from securities and margin lending surged to 10% of total interest income adding 17bips to NIM.
    • Company remains levered to interest rates and higher interest rates would provide a huge tailwind for earnings.
  • Profitability – industry leader
    • ROTE 15% and 42.2% pre-tax profit margin.  Expect margins to expand over the next 2-3 years due to cost savings and scale from the mergers
    • Current expenses are elevated due to mergers
  • Capital allocation
    • Schwab plans to build capital on the balance sheet due to rising deposits and mergers, which may temper share buybacks.
    • Dividend yield of 1.29%
    • Valuation is attractive at 20x earnings.  Target price set at 23x.

Schwab Thesis:


  • Expect Schwab’s vertically integrated business model to drive AUM growth.  Schwab has averaged 6% organic core net new asset growth as retail clients and advisors are attracted to Schwab’s low cost trading and custody services.
  • Conservative, well-managed firm who is a leader in online trading and focused on leveraging platform. 
  • Schwab has experience material AUM growth with USAA and TD Ameritrade mergers.  Expect SCHW to reduce costs and continue to leverage platform.


Please let me know if you have any questions.

Thanks,

John


$SCHW.US


John R. Ingram CFA

Chief Investment Officer

Partner


Direct: 617.226.0021

Fax: 617.523.8118


Crestwood Advisors

One Liberty Square

Suite 500

Boston, MA 02109

www.crestwoodadvisors.com


Fortive 4Q 2020 earnings summary

Key Takeaways:


Current Price: $69                       Price Target: $83 NEW  

Position Size: 2.06%                    1-year performance: +2%


  • During the fourth quarter, Fortive business returned to growth across all segments, and profitability continued to improve
    • Organic growth of +0.7%, reported growth (includes acquisitions and FX) +4.9%
    • Adjusted grows margin +160 bps y/y
    • Adjusted operating margin +100bps
    • Adjusted EPX +18.6% y/y
    • FCF +39% y/y
  • Results per region varied: Asia Pacific saw low single digits growth (China + high single digits), Western Europa had high single digits growth, and North America was the only negative being down slightly
    • Customer site access has been difficult, slowing down growth
  • Fortive has significantly reduced its leverage post Vontier spin-off:
    • Debt reduction of $3B
    • Net debt/EBITDA stands at 1.3X (from 2.5X), which leaves room for future acquisitions – FTV is willing to stretched its balance sheet to up to 3.5X for the right deal
    • Fortive’s strategy to move its portfolio towards more technology focused businesses (higher growth/higher recurring revenue) has taken a big jump forward with the spin-off of Vontier
    • Recurring revenue now 39% of sales
  • FY21 guidance:
    • Organic growth of 4-7% (total reported 6.5%-9.5%)
    • Adjusted operating margin of 22%-23%
    • Adjusted EPS +15%-22%
    • FCF won’t grow as much in 2021 as the company is facing a $50M headwind related to the CARES Act (paying back some taxes), and less working capital improvements as it is growing some new businesses
  • We increased our price target to reflect the good guidance for 2021


FTV Thesis:

  • Market leader:
    • Leadership position in most of the markets they serve
    • Experienced leadership team
    • Above industry margins with strong cash flows
  • Quality:
    • FCF yield ~5%
    • Organic growth target of 3-3.5% (4-5% in last 2 quarters after being under the target in prior quarters)
    • M&A strategy to enhance top line growth
    • Margins expansion from new products introduction, continued application of the Fortive Business Systems and M&A integration
  • Shareholder friendly:
    • Management team focused on shareholder wealth creation through top line sustainability and margin expansion

$

FTV.US

Category: earnings

Tag: FTV


Xylem 4Q2020 earnings summary

Key takeaways:


Current Price: $98                      Price Target: $117

Position Size: 2.79%                  Performance: +49% (since inception on 04/07/20)


Xylem reported its 4Q 2020 earnings this morning, with sequential improvements in all of its markets. Sales came better than previously guided (-2%  on an organic basis vs. -8% to -6%), as demand is stabilizing. The US continuous to have some softness due to Covid, and the delay in projects deployments. New projects have been temporarily delayed due to site access restrictions, which should ease towards the end of Q2. Their analytical and advanced solutions businesses saw high single digits growth and partly offset the decline in new projects starts. Total backlog is up 16% on an organic basis, which is encouraging for the upcoming quarters.

On the profitability side, productivity improvements of 520bps only partially offset some of the negative effects of lower volume (-390bps) and cost inflation (-250bps), but margin still came above guidance. So while top line was below 2019 levels, the company saw overall FCF grow 5% over the prior year, thanks to multiple years of efforts to improve its working capital. On the capital allocation front, dividend was raised by 8%.


CEO quote:

  • “backlog in our advanced digital solutions grew 70% year-on-year. Although it’s from a small base, the trajectory is clear. It puts us in a very attractive position as we grow not only in software platforms but in all will be digitally enabled parts of our portfolio”
  • “Short-cycle orders and project activity are definitely beginning to pick-up but are still likely to be limited by COVID impacts in the near term.”


Additional 4Q20 results:

Organic growth by end-markets:

  • Utilities: -3%
  • Industrial: -3%
  • Commercial: flat
  • Residential: +15%


Organic growth by regions:

  • US: -6%
  • Emerging markets: -2%, with China leading at +18%
  • Western Europe: +6%


Xylem provided its initial 2021 guidance, which we believe is conservative due to the continued Covid environment:

  • Organic sales of +3% to +5% (and for 1Q 2021 should be 1% to 3%)
  • Adjusted operating margin between 11.5% and 12.5% – still below 2019 level, mostly due to mix: lower margin business recovering faster than higher margin one
  • The order trends appears to be recovering, and backlog growth is significant (+16%).


Xylem’s investment thesis is:


  • Xylem has strong sustainable secular growth drivers in a fragmented industry:
    • Access to clean water is a necessity
    • Population growth & urbanization
    • Aging infrastructure


  • More defensive sales base thanks to:
    • 50% of sales to utility sector
    • sticky client base due to high switching costs
    • high level of replacement parts demand
    • Long-term contracts with ½ of the revenue base recurring


  • Margin expansion overtime from productivity efforts


  • M&A strategy has increased their scope in the water cycle


  • Valuation is attractive today


XYL.US

Category: earnings

Tag: XYL


Visa Q1 Earnings

Current price: $208        Target price: $226

Position size: 3.7%          TTM Performance: 2%


Key takeaways:

  • Beat estimates – Beat driven by solid top-line results and lower than expected op expenses and client incentives.
  • Sequential volume improvement – with very strong debit and e-commerce spending globally, partially offset by weaker credit and in-store spending.
  • Cross-border still a headwind but improving improvement here is key as this is their biggest Covid headwind driven by travel restrictions.
  • CFO Vasant Pabhu said, “As we approach the first anniversary of the pandemic, where do we stand across our key business drivers relative to where we might have been had the pandemic never happened? Global payments volume is four points to five points short of where we might have been. Debit has outperformed helped by accelerated cash displacement and credit is still a drag. In the US, we are actually back to our pre-pandemic growth trajectory, with debit significantly ahead offsetting credit underperformance.”


Additional Highlights:

  • Revenues were down 6% YoY driven by cross-border headwinds (down 21% YoY or -33% YoY excluding intra-Europe), but partially offset by volume growth. Operating expenses were down 10%, leading to margin improvement (lower advertising, administrative, and personnel costs).
  • While cross-border spending did improve for the quarter, it remains depressed, led by travel spending, as the majority of borders remain closed. 
  • Cross border spending drives International transaction revenues which are >25% of total net revenues. As such, the steep drop is offsetting growth in service revs and data processing revs. As travel restrictions lift with the vaccine rollout, Visa will see a recovery in this meaningful piece of revenue.
  • Within the US, Total volumes are up slightly YoY driven by growth in debit while credit has lagged. Stimulus checks helping with this. Card present transaction are down YoY, while card not present, ex-travel is up as consumers shift spending online w/ lack of travel spending benefiting other categories.


  • Growth areas…
    • Consumer payments – digitizing the $18 trillion spent in cash and check globally. Continuing to grow acceptance (including contactless penetration) and grow credentials with traditional issuers, fintechs and wallets.
    • New Flows – $185 trillion in B2B, P2P, B2C and G2C. P2P, which represents $20 trillion of the opp., was Visa Direct’s first use case and continues to grow substantially. A key area of future growth is cross-border P2P, or remittance. Four of the top five global money transfer operators were onboarded in fiscal year 2020, TransferWise, Western Union, Remitly, and MoneyGram. In B2B, Goldman Sachs recently signed on to Visa’s B2B Connect for cross-border B2B money movement w/ corporate clients.
    • Value-added services – a few services with notable progress this quarter. As e-commerce explodes, interest in Cybersource remains strong for merchants, as well as from fintechs and acquirers looking to leverage Visa’s capabilities. This quarter, two additional leading acquirers signed on to use Cybersource, KBank in Thailand and NAB in Australia.
  • Spend categories – across categories, growth was relatively consistent with the prior quarter. Categories which have been growing above their pre-COVID levels have remained elevated including food and drugstores, home improvement, and retail goods. For categories that are the hardest hit by this pandemic including travel, entertainment, fuel and restaurants, spending remained depressed with year-over-year declines consistent with last quarter.

While COVID has been a headwind for Visa, particularly in cross border volumes – the long-term thesis is intact. Visa is a high moat, duopoly company with extremely high FCF margins (approaching 50%), strong balance sheet and continued runway for secular growth driven by the shift from cash to card/digital payments. Trading at >3% FCF yield. 


Sarah Kanwal

Equity Analyst, Director


Direct: 617.226.0022

Fax: 617.523.8118


Crestwood Advisors

One Liberty Square, Suite 500

Boston, MA 02109

www.crestwoodadvisors.com


$V.US

[category earnings]

[tag V]


Travelers Q4 2020 results

On 1/20, Travelers reported a Q4 EPS of $4.91, soundly beat estimates of $3.20.  Positives for the quarter were improved margins, return on equity of 18.4% and book value growth of 14%.  Gains in pricing remain strongest in a decade which bodes well for future profitability.


Travelers is a high quality, disciplined underwriter of insurance that is focused on returning capital to shareholders through dividends and share buybacks. 


Current Price: $138                                Price Target: $160 (raised from $135)

Position Size:   1.67%                              TTM Performance: +6.7%


Thesis Intact. Key takeaways from the quarter:


  1. Core business results were solid, beating estimates

·         Combined ratio improved 5.7 points to 86.7%

·         Net premiums increased 3% for quarter and 2% for the 2020

·         Strong pricing with renewal premiums up

    • Business +7.3%
    • Bond & specialty +10.9%
    • Personal Insurance +8.2%
    • International +9.7%

·         The industry has faced several headwinds – higher cat losses, negative tort trends and falling yields.  As a result industry wide pricing has been strongest in 10 years.


  1. Total net Investment Income rose $47m due to strong returns in private equity investments as returns from fixed income investments fell $36m.


  1. Strong financial position
    • Debt to capital ratio of 20.7%
    • Most of debt is long term – just issued a 30yr bond yielding 2.5%
    • 97.9% of fixed income portfolio is investment grade with average rating of AA
    • Strong rankings from rating agency relative to peers


  1. TRV continues to return capital with dividend yields 2.45% and shareholder yield over 4%
    • During Q4, TRV repurchased 1.4m shares for $201m.  Full year, TRV repurchased 5.2m shares for $672m. 
    • Over past 10 years shares outstanding have fallen 53%!
    • Management has a long history of employing capital wisely! Instead of investing in mature business with spotty pricing, they are returning excess capital to shareholders


  1. Current valuation of 12.4 P/E is close to historical mean.  Price target represents 13.5x 2022’s estimated earnings.


The Thesis on TRV:

  • We expect TRV will be able to grow book value per share in the mid-single digits over the near-medium term, and generate ROE in the 10-14% range
  • Industry leader with disciplined underwriting and investment portfolio track record  
  • Consistent returns in the low to mid double digits
  • Responsible capital allocation and proven desire to act in the best interests of shareholders


Please let me know if you have any questions.

Thanks,

John


$TRV.US

[tag TRV]


John R. Ingram CFA

Chief Investment Officer

Partner


Direct: 617.226.0021

Fax: 617.523.8118


Crestwood Advisors

One Liberty Square

Suite 500

Boston, MA 02109

www.crestwoodadvisors.com


Sensata 4Q2020 earnings summary

Key Takeaways:


Current Price: $54               Price Target: $61

Position Size: 2.18%           1-year Performance: +17%


Sensata released its 4Q2020 earnings this morning. Organic sales were up 5.3% (+7.1% including FX benefit) but operating income margin decreased due to Covid-related costs, higher incentive compensation and “Megatrend” investment spending (electrification, smart & connected).

Sales growth by segment was as follow:

  • Automotive organic sales +4.4%: ST outgrew the market by 970bps – growth from emissions, electrification and safety
  • HVOR organic revenue +16.2% y/y: outgrew the market by 990bps – growth from China VI emissions regulations, operator controls
  • Industrial & other: organic revenue +7.7%: growth from HVAC, 5G and supply chain restocking 
  • Aerospace organic growth -25%


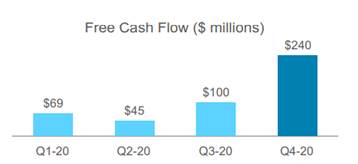
Free cash flow increased throughout the year, thanks in part to better working capital management (better management of inventory levels), and a recovery in top line growth.


Sensata’s content in electric vehicles represents a 20% lift from traditional internal combustion engines. The components made allow longer range and faster charging times, critical for EV increased adoption. In the chart below we can see on the left components that carryover from traditional engines, while on the right, new components specific to EV:


Sensata continues to expand its electrification capabilities beyond electric vehicles, such as charging infrastructures, energy management expertise, industrial and grid opportunities. As such, they just acquired Lithium Balance, to expand into battery management and energy storage solutions in the heavy vehicle and industrial markets.


For 2021, Sensata expects a return to growth for all their end markets, especially North America autos. Organic revenue growth is expected to be between 10-15%, operating margin to expand from 18.5% to 20.7% due to volume and productivity improvements. Their 2021 margin guidance would be below 2019 levels, but reflect the current shortage in semiconductors globally (25-50bps impact).


Overall the quarter is as expected, seeing a recovery in most segment, except aerospace. The stock underperformed the market today as guidance for the year did not beat expectations. We still believe the long-term thesis is intact.


The Thesis on Sensata

  • Sensata has a clear revenue growth strategy (content growth + bolt-on M&A)
  • ST is diversifying its end markets exposure away from the cyclical auto sector over time through acquisitions, also expanding its addressable market size
  • ST is a consolidator in a fragmented industry and still has room to acquire businesses
  • Margins should expand as the integration of the prior two deals is under way, regardless of top line growth, and efficiencies in manufacturing are continuously pursued as they are gaining scale
  • ST is deleveraging its balance sheet post acquisitions, leaving room for future M&A or a return to share buybacks, and improving EPS growth


Tag: ST

category: earnings

$ST.US


Julie S. Praline

Director, Equity Analyst


Direct: 617.226.0025

Fax: 617.523.8118


Crestwood Advisors

One Liberty Square

Suite 500

Boston, MA 02109


www.crestwoodadvisors.com