Visa Q2 Earnings

Current price: $234        Target price: $260

Position size: 3.7%          TTM Performance: 30%


Key takeaways:

  • Beat estimates earnings and revenue beat
  • Cross-border still a headwind but improving –driven by travel restrictions but Europe opening travel this summer w/ vaccines should be key to improvement.
  • Payment volumes continue to improve and their net revenue and profits are at 2019 levels even as a rebound in travel (especially cross-border travel), still remains ahead of them.
  • No guidance
  • CEO Al Kelly said, “we believe we are starting to see the beginning of the end and the recovery is well underway in a number of key markets around the world… Cross-border travel is the slowest sector to return, but there are some green shoots that offer real indication of people looking to see the world.”


Additional Highlights:

  • Revenues were down 2% YoY driven by cross-border headwinds (down 11% YoY or -21% YoY excluding intra-Europe), but mostly offset by growth in payments volume and processed transactions. Payments volume for the quarter increased 11% fueled by continued strength in debit as well as improving credit spending.
  • Quotes from the call…
    • “The pandemic has accelerated the digitization of cash, and we see the impact in debit and tap-to-pay. When we look at cash usage in the last 12 months just on the Visa brand, such as with ATM withdrawals, we see that global debit cash volumes have decreased by 7%, while debit payment growth has grown – payments volume has grown 16%, both on a constant dollar basis. This 20-point gap is more than double the historic gap in growth rates and relatively consistent globally, demonstrating cash digitization in both mature and emerging regions.”
    • “There is significant pent-up demand for travel, in particular personal travel” and “The decline in travel is temporary, and we’re starting to see some early signs of recovery.” The vast majority of the travel Visa captures on their credentials is consumer, and they are the global leader in travel co-branded cards.
  • Tailwinds building – pending travel recovery, re-opening beneficiary, accelerated cash digitization and growing e-commerce penetration…
    • The most notable sign of a domestic recovery was card-present spend growing 4% which is up 3% over 2019, an 8 point acceleration from Q1 led by retail and restaurant spending.
    • Credit has improved without debit slowing, pointing to accelerated cash displacement. The credit improvement was helped by increases in retail, travel, restaurant and entertainment spending mostly starting in early March as restrictions were relaxed in many states.
    • Spend categories trends are starting to shift – for categories that were hardest hit by this pandemic including travel, entertainment, fuel and restaurants, spending remains depressed but is improving with re-opening.
    • Cross border spending drives International transaction revenues which are >25% of total net revenues. As such, the steep drop is offsetting growth in service revs and data processing revs. As travel restrictions lift with the vaccine rollout, Visa will see a recovery in this meaningful piece of revenue. While cross-border spending did improve for the quarter (3 points better than Q1), it remains depressed (75% of 2019 levels), led by travel spending (down 55% YoY, still at 39% of 2019 levels), as the majority of borders remain closed.
  • Crypto opportunity:
    • “leaning into in a very, very big way, and I think we are extremely well positioned”
    • Enabling purchases, enabling conversion of a digital currency to a fiat on a Visa credential, helping financial institutions and fintechs have a crypto option for their customers and upgraded their infrastructure to support digital currency settlement
    • They have over 35 digital currency platforms/wallets that are working with them
    • Working with Central Banks as digital currency is being explored in many nations
  • Growth in “buy now, pay later”…
    • Nascent but growing
    • Visa is working with third party providers as well as offering their own proprietary platform that would allow issuers to offer their own buy now, pay later capability
    • Potential for value-added services, data analytics to augment a provider’s underwriting or risk products to help some of the third-party providers.
    • “we’re doing a lot in this space. We’re committed to it… I can’t predict exactly where it’s going to land, but we are going, to the degree it takes off, we’re going to be there to be part of it.”
  • Growth areas…
    • Consumer payments – digitizing the $18 trillion spent in cash and check globally. Continuing to grow acceptance (including contactless penetration) and grow credentials with traditional issuers, fintechs and wallets. In the last two years, they’ve grown their credentials to 3.6B and physical merchant locations to over 70m, up 7% and 34%, respectively. Notably, “merchant locations” only count partners like PayPal and Square each as one. LT opportunity to grow the pie for digital payments w/ the 1.7 billion unbanked.
    • New Flows – $185 trillion in B2B, P2P, B2C and G2C. P2P, which represents $20 trillion of the opp., was Visa Direct’s first use case and continues to grow substantially. Visa Direct transactions grew almost 60% in 2Q. A key area of future growth is cross-border P2P, or remittance. Four of the top five global money transfer operators were onboarded in fiscal year 2020, TransferWise, Western Union, Remitly, and MoneyGram. In G2C, for example, Visa Direct supported the US government’s disbursements of economic impact payments to nearly 13 million Visa prepaid credentials so far this year.
    • Value-added services – includes consulting, technology platforms (e.g. Cybersource, issuer processing, and risk identity and authentication), data and insights, and card benefits, all which will improve with the recovery. Opportunity to increase penetration w/ existing clients. In fiscal year 2020, more than 60% of their clients used at least five value-added services from Visa and more than 30%used 10 or more.
  • While COVID has been a headwind for Visa, particularly in cross border volumes – the long-term thesis is intact. Visa is a high moat, duopoly company with extremely high FCF margins (approaching 50%), strong balance sheet and continued runway for secular growth driven by the shift from cash to card/digital payments and new payment flow opportunities. Getting more expensive, trading at <3% FCF yield.


Sarah Kanwal

Equity Analyst, Director


Direct: 617.226.0022

Fax: 617.523.8118


Crestwood Advisors

One Liberty Square, Suite 500

Boston, MA 02109

www.crestwoodadvisors.com


$V.US

[category earnings]

[tag V]
 

Fortive 1Q21 earnings summary

Key Takeaways:


Current Price: $72                       Price Target: $83  

Position Size: 2.06%                    1-year performance: +39%


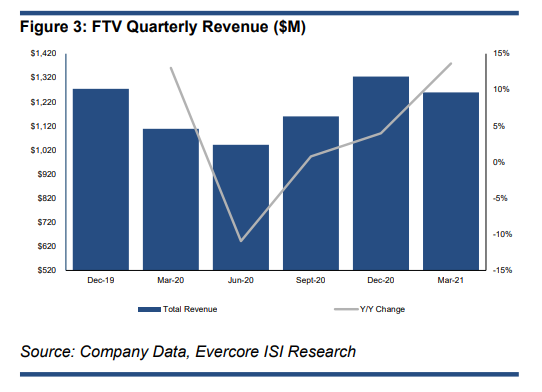
Fortive reported sales and EPS above expectations last evening, but guidance for 2Q and implied 2H21 growth rates are driving the stock down today. We think guidance is conservative due to limited visibility, and see 1Q a proof FTV has a portfolio of brands of  quality.

  • Organic growth of +9% (+13.6% reported includes FX and acquisitions)

o    All three segments had positive sales growth:

Ø   Advanced Healthcare Solution +11% organic (24% of revenue): high growth in China (+50%) for ASP. Elective procedure were 91% of pre-covid levels globally – reassuring for continued growth in coming quarters. Landauer (radiation safety) has grown its EBIT margin 2.5X since acquisition

Ø  Precision Technologies +12% organic (36% of revenue): Tektronix had broad based growth in the low double-digits to mid-20% across geographies

Ø  Intelligent Operating Solutions +6% organic (41% of revenue): broad strength in China for Fluke, expansion in Western Europe for Intelex, and overall better customer site access

o    Software-as-a-service products had low double-digit growth

o    Increased exposure to software and healthcare provides higher recurring revenue base, and sequential expansion as covid restrictions end


  • Adjusted gross margin +90bps y/y, limited impact from higher commodity and logistics costs
  • Adjusted operating margin +240bps
  • Adjusted EPS $0.63, +37% y/y
  • FCF $144M, +50% y/y, driven by strong earnings growth


Fortive has significantly reduced its leverage post Vontier spin-off:

  • Net debt/EBITDA stands at 1.2X
  • $5B in liquidity available
  • We should expect some M&A back on the table


FY21 guidance:

  • Organic growth raised to +7% to +10% (vs +4% to +7%)
    • 2Q organic 16-19%, implies 2H21 slows down to 5-7%, which we think is due to limited visibility as we exit Covid
    • Q2 quarter guidance is in-line with consensus expectations – margins would see 250bps impact from investments in growth projects and digital transformation
    • Company could benefit from the proposed Infrastructure bill
  • Adjusted operating margin of 22-23% (unchanged)
  • Adjusted EPS raised to $2.50-$2.60 from $2.40-$2.55 (+20-24% y/y)


V-shaped recovery for FTV:


FTV Thesis:

  • Market leader:
    • Leadership position in most of the markets they serve
    • Experienced leadership team
    • Above industry margins with strong cash flows
  • Quality:
    • FCF yield ~5%
    • Organic growth target of 3-3.5% (4-5% in last 2 quarters after being under the target in prior quarters)
    • M&A strategy to enhance top line growth
    • Margins expansion from new products introduction, continued application of the Fortive Business Systems and M&A integration
  • Shareholder friendly:
    • Management team focused on shareholder wealth creation through top line sustainability and margin expansion

$

FTV.US

Category: earnings

Tag: FTV


Julie S. Praline

Director, Equity Analyst


Direct: 617.226.0025

Fax: 617.523.8118


Crestwood Advisors

One Liberty Square

Suite 500

Boston, MA 02109


www.crestwoodadvisors.com


S&P Global reports strong Q1 2021 results

On 4/29, S&P Global announced impressive Q1 earnings with EPS up 24%.  Key takeaways are:

  • Revenue up 13% to $2.0b
  • Expense growth of 2% and operating margins increased 450 basis points!
  • All four businesses grew revenue and increased operating margins


Current Price: $391.69                    Price Target: $450 (increased from $410)

Position Size:   2.88%                         Performance since add on 2/3/21: +21.0%


2021 Q1 Highlights:

  • Ratings
    • Revenue grew 23% and operating profit rose +32%
    • Margins increased 440 bps to 67.5% (after rising 450bps last quarter!)
    • Global bond issuance up a healthy +9% with surging bank loans +70% and High Yield +111% issuance
    • No S&P rated investment-grade issuer defaulted in 2020
  • Market Intelligence
    • Revenue grew 4% Operating profit rose +13%
    • Margins increased 260 bps to 33.5%
  • Platts
    • Revenue grew 5% and operating profit rose +15%
    • Margins increased 520 bps to 58.1%
  • S&P Dow Jones Indices
    • Revenue grew 4% and operating profit rose 7%
    • Margins increased 70 bps to 71.3%


Growth initiatives

  • Implementing ESG offerings across platform – ESG revenues up 40%
  • China analytic platform – 22 ratings in 2020 and 18 ratings this quarter
  • Technology expertise – Kensho AI initiatives
    • RiskGuage, ProSpread, Riskcasting Indices, Moonshot index, Kensho Scribe and many others combining data and analytics
  • Merger with IHS Markit remains on track for closure in second half of 2021

Capital allocation

  • SPGI has a current yield of .79%
  • SPGI has repurchased 14% of outstanding shares over past 5 years
  • Currently, share buybacks are on hold with the pending merger of IHS Markit.  SPGI has $4.5b of cash piled up on the balance sheet.  Expect majority to be returned to shareholders post merger.


S&P Global Investment Thesis:

  • S&P Global is a highly profitable company that has established businesses with deep moats in attractive industries
  • S&P Global is focused on shareholders and returns 75% of free cash flow in dividends and share buybacks
  • Over the past several years, S&P Global has demonstrated an enviable history of revenue growth and margin expansion
  • With the merger of IHS Markit, S&P Global will combine many unique data sources, enhance data analytics capabilities, and broaden addressable markets.


Please let me know if you have any questions.


Thanks,

John


$SPGI.US


John R. Ingram CFA

Chief Investment Officer

Partner


Direct: 617.226.0021

Fax: 617.523.8118


Crestwood Advisors

One Liberty Square

Suite 500

Boston, MA 02109

www.crestwoodadvisors.com


Resmed FY21 Q3 earnings summary

Key Takeaways:


Current price: $194                     Price target: $236  

Position size: 2.54%                    1-year performance: +28%


  • Top line flat y/y, missing consensus as the recovery in core business is slow to pick up and ventilator sales no longer tailwind (and also provide tough comparison y/y)
    • Adjusting for the $35M sales in ventilators last quarter (due to covid) – sales growth would have been +1% (mostly outside of the US at +6%, as the US benefited less from ventilator sales)
      • No ventilators sales this quarter, as previously guided
    • New patients starts still struggling with the pandemic to recover, but sequential improvements into April in the US
      • US devices sales were -2% despite market share gains from competitors facing supply issues
      • Pent-up demand will be met with more at-home testing – likely to come back over time rather than all at once
      • Rest of world devices sales still impacted by Covid/lockdowns -18% (ex-FX) – especially large markets in France & Germany
    • Masks resupply program still resilient
      • US masks sales +7% lifted by resupply but facing tough y/y comps as last year saw beginning of customer stocking
      • Ex-US market flat
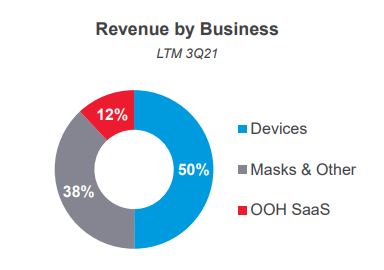
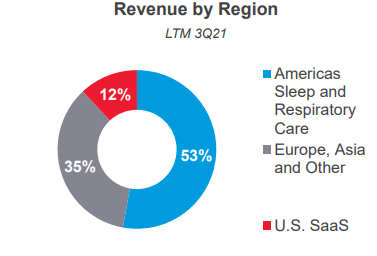
    • Software-as-a-service business: 5% growth with stabilization trend in patient flow in out-of-hospital setting


  • The Agency for Healthcare Research & Quality (AHRQ) report publish on April 1 shows draft finding on CPAP therapy being not positive, but Resmed believes it is lacking real world outcomes, and the American Academy of Sleep Medicine thinks they did not use all available evidence – final report should come before year-end. This is important as reimbursement adjustments could be made pending this report.


  • Gross margin fell slightly by 40bps y/y due to mix impact (less ventilator sales), transition to a new site in Singapore and higher freight costs
  • To offset that, SG&A fell 7%, thanks to lower travel expenses and cost management strategy
  • $255M in tax reserves for a proposed settlement with the Australian Tax Office related to prior transfer pricing issues
  • Operating cash flow was lower y/y due to working capital requirements
  • Buyback likely to start again in FY22


  • Guidance for next quarter is for low single digits growth sequentially
  • FY22 guidance: double digit revenue growth in 2H2022, thanks to new product launch (AirSense 11) – guidance this early is unusual but needed to clarify the impact of ventilator sales from Covid, and recovery in core business from there.


Our long-term view on the stock is still valid, with the global sleep apnea market only ~20-30% penetrated, and market volume growth rate ~10% per year – an attractive market where Resmed and Philips play in duopoly. This temporary set back is a bump on the road and we believe Resmed will performance well as the world reopens post-Covid, with greater emphasis on respiratory health.


Capital allocation remains on track with long-term targets announced by management:


Thesis on RMD:

  • Leading position in the underpenetrated sleep apnea space
  • Duopoly market
  • New product cycle
  • Returns of capital to increase: ~1% share buyback/year (back in FY18), dividend yield of 2%


$RMD.US

[category earnings] [category equity research] [tag RMD]


Julie S. Praline

Director, Equity Analyst


Direct: 617.226.0025

Fax: 617.523.8118


Crestwood Advisors

One Liberty Square

Suite 500

Boston, MA 02109


www.crestwoodadvisors.com


Apple Q2 Earnings


Current Price: $133                                                    Price Target: $157

Position Size: 7.2%                                                     TTM Performance: +85%


Key Takeaways:


  • Strong beat across product segments – revenue record in each geographic segment and strong double-digit growth in each product category
  • Big improvement in China – 87% YoY growth; lapping earlier lockdowns than US.
  • Increased buyback – added $90B to the existing share repurchase program.
  • Upping investment in US plans – took their 5 yr. target spend from $350B to $430B – investments will “create 20K jobs” and support “American innovation and drive economic benefits,” including a new North Carolina campus and investments in silicon engineering and 5G technology.
  • No specific guidance again – June quarter revenue is expected to be up strong double digits, which includes a negative supply constraint impact of $3 billion to $4 billion (semi shortages primarily affecting the iPad and the Mac).
  • CEO Tim Cook said, “If you look at how the iPhone did around the world, we had the top five models of smartphone in the US, the top two in urban China, four out of the top five in Japan, the top four in the UK and the top six in Australia. And so it was a sort of across the board in some really key countries, we did really, really well. I do think that the 5G cycle is important. And we’re in the early days of it…”


Additional highlights:


  • This impressive growth is not just about lapping easy compares – They saw incredible growth across all product categories this quarter, but not b/c demand collapsed last yr. Covid did have a negative impact last year, particularly w/ iPhones and especially in China where lockdowns occurred earlier, but overall 2Q sales were up slightly last year driven by services and wearables. And sales in each product category this quarter were all well ahead of Q2 2019.  See chart below for segment growth details.
    • iPhone – Sales were up 66% vs last yr and up 54% vs Q2 2019. iPhone 12 was a key growth driver and lapping China shut down. Saw a record number of upgraders for a March quarter. Later launch of new iPhone models also shifted some demand to this quarter.
    • Mac – the last three quarters for Mac have been its three best quarters ever fueled by the M1 chip. Just announced redesigned Macs – the first major change to the computer’s exterior since 2012.
    • iPad – grew very strong double digits to its highest March quarter revenue in nearly a decade. Just announced iPad w/ M1 chip and 5G.
    • Wearables – strong performance from both Apple Watch Series 6 and Apple Watch SE. Just announced air tags and new Apple TV 4K
    • Services – record quarter in each geography; now at 660m subs, up 145m from last yr. Just introduced Apple Card family and adding podcast subscriptions. Saw a return to growth on Apple Care as stores have re-opened.
  • Putting in perspective growing installed base & new chips – Apple continues to significantly expand their installed base. And they have multiple new products being launched and more in the pipeline (e.g. AR glasses, Apple car) that could be key drivers of LT growth….and, importantly, a growing services business tied to all these products. Part of what differentiates Apple is they design their own silicon for the processor chips that are the brains of their iPhones and iPads and now their Macs, which gives them better control over performance and feature integration in their devices. This has proven to give them an advantage with the way they design their products and an advantage with developers. So, now they have Macs, iPhones and iPads running the same underlying technology which should make it easier for Apple to unify its apps ecosystem, including allowing iPhone and iPad apps to run on Macs. This advantage and the relevance of their ecosystem gets more and more important as computing power in phones increases, 5G delivers better connectivity and, as a result, we have the ability to use their devices in enhanced ways (w/ increased revenue opportunities) ….like apps that take advantage of augmented reality and IoT related technologies.
  • Despite increase in price, Apple is still not expensive…
    • Trading at 4.1% FCF yield on 2021 and a 0.7% dividend yield w/ another >4% of their market cap in net cash on their balance sheet.
    • For reference, pre-pandemic in Jan 2020, Apple was trading at ~4.7% FCF yield and 1% dividend yield with ~7% of their market cap in net cash.
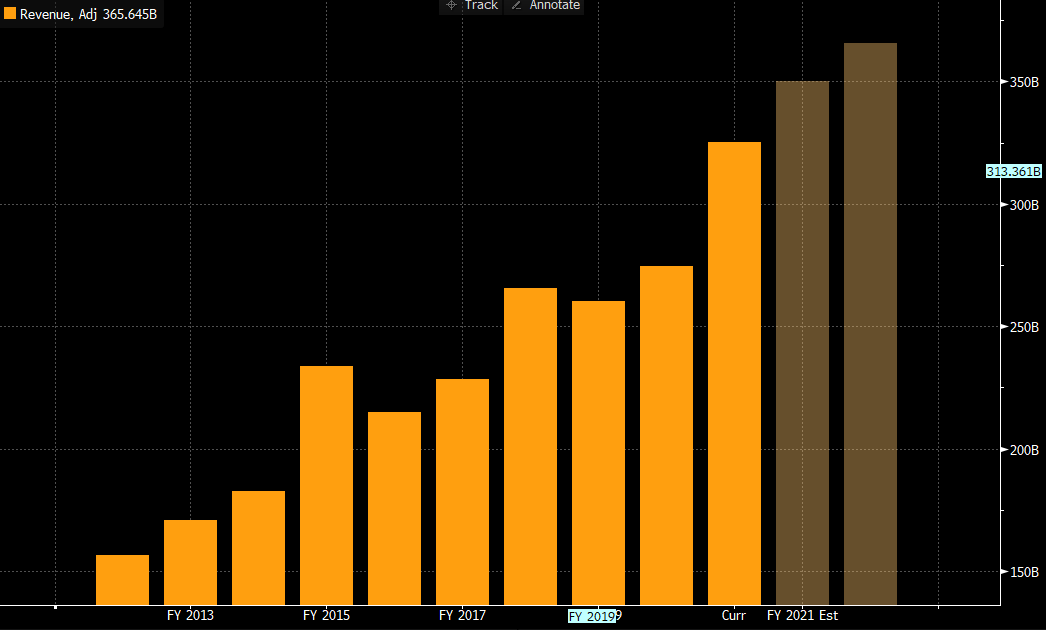
    • For the full year 2021 (ends in Sept) and for 2022, the growth trajectory for revenue and for FCF has steepened from the last few years. See charts below. “Curr” = trailing twelve months.


$AAPL.US

[category earnings]

[tag AAPL]


Sarah Kanwal

Equity Analyst, Director


Direct: 617.226.0022

Fax: 617.523.8118


Crestwood Advisors

One Liberty Square, Suite 500

Boston, MA 02109

www.crestwoodadvisors.com


Syneos (SYNH) 1Q 2021 earnings summary

Key Takeaways:

Current Price: $83.5                          Price target: $107

Position size: 1.68%                          Performance since inception: +15%          


  • Sales back in positive territory +4%
  • Backlog at record levels
  • Operating profits and cash flows higher
  • Guidance for the year maintained


This morning Syneos released its 1Q 2021 earnings results. While the quarter was good and comments on the call were promising for 2021-2022, the stock is trading down 4% as guidance was not increased for the year.

Sales returned to positive growth ~+4% overall, with clinical trials segment up 3.9% organically and commercial still negative -1.8% (but a 720bps sequential improvement). The management team expects a acceleration in sales growth throughout the year, driven by backlog (up 22.5% this quarter) in Covid and non-Covid trials. Covid is only 4% of backlog (and $25M in revenue last year). They currently have 22 Covid-related projects, with an additional 23 more. Covid is created interest in their integrated platform.

 In clinical solutions, they experienced a record level of awards, and patient enrollment remains high. On the commercial side, consulting services is seeing double digits revenue growth, and the entire segment should see double digits organic growth in 2Q, while both commercial and clinical trials should grow mid-single-digits in the second half of the year. Syneos continues to invest in the decentralized trial model to grow its business – Illigworth being the latest addition on this front.

Its Syneos One offering is gaining traction with small and mid-sized customers and we should see some of that towards 2H2021, and the Synteract acquisition is increasing exposure to emerging biopharma as well. On the large pharma side, capabilities and penetration is good, and Syneos scale (vs. top player) is not an issue for large pharma customers. On the balance sheet front, the company continues to deleverage, now at 4.1X, and with a target of 3-3.5X by the end of year.

Overall we remain positive on Syneos and expect the recovery to accelerate throughout the year to see the investment thesis play out.


Investment Thesis:

I. Secular growth:

    1. Increasingly sophisticated and highly-regulated environment with government increasingly focused on drug pricing à biotech and large pharma need to reduce fixed costs
    2. Growing research and development (R&D) spending environment:
      • Growing portion of R&D outsourced to Contract Research Organizations (CROs)
      • Pharma/biotech clients choosing fewer & higher quality CROs (expertise and scale)
    3. Syneos has robust backlog predicting good growth for next 2 years
      • Recovery in clinical trials post-covid

II. Competitive advantages:

    1. Only company integrating clinical trials (Contract Research Organization -CRO) and commercialization solutions (CCO):
      • Offer customized solutions and possibility to lower time to market
    2. Top 3 market share within fragmented CRO market
    3. Global scale – allows to compete for larger trials, with expertise in complex diseases
    4. Diverse client base (large to small pharmaceuticals)

III. Attractive valuation: 45% upside

    • Driven by secular growth drivers and margin expansion


Julie S. Praline

Director, Equity Analyst


Direct: 617.226.0025

Fax: 617.523.8118


Crestwood Advisors

One Liberty Square

Suite 500

Boston, MA 02109


www.crestwoodadvisors.com


Stryker (SYK) 1Q 2021 earnings summary

Key Takeaways:

Current Price: $260                          Price target: $293

Position size: 2.54%                        1-year Performance: +40%          


Stryker released its 1Q 2021 earnings last evening. Sales were up +4.7%, including its recent Wright acquisition, and +1.8% organically – finally in positive territory. Growth in the US was more subdued (+1% vs international growth of +15% due to timing of the pandemic starting earlier outside of the US). The management team noted an acceleration in demand towards the end of the quarter, a reassuring trend for the coming quarters. Order book activity is firming up as well as we entered April. Hips and knees surgeries are returing to the mid-single-digits growth in April (a trend JNJ mentioned as well), which is encouraging but not surprising as this is a big profit center for hospitals. On the margin front, operating margins declined 160bps over 2019 levels, as the company integrates Wright Medical and ramp up spending to fuel future growth. Overall the recovery in SYK businesses in happening, with future innovation likely to drive growth. Margins expansion is momentarily limited as the company spends on R&D. We remain bullish on the company’s future and maintain our position in the stock.


  • Guidance in sales for 2021 remains unchanged at +8% to +10% vs. 2019 levels, implying an acceleration throughout the year
  • The management team reiterated their operating margin expansion of 30-50bps over 2019 levels
  • EPS for the year was raised as the Wright integration is rolling up faster than planned.
  • So far competitor’s launch of knee robots have not taken market share away from them (JNJ launching Velys approved in January 2021, Zimmer launch of Rosa), but rather brought more interested and validation to this category
  • Mako robot seeing good growth in the US but also outside of the US where regulatory approval was gained in 2020
  • CEO quotes:
    • “The other thing that makes us very confident on the full-year outlook is the order book for capital equipment, both large capital and small capital, which is both picking up. So overall, we’re feeling bullish.”
    • “We are encouraging divisions to ramp up some of their spending to make sure that we are properly positioned for growth, that would also include spending in innovation. And so we are making sure that we are not doing anything to hold back product development and other innovation spending that frankly will be needed to really fuel growth even towards the end of this year or even early into next year.”


   SYK Thesis:

  • Consistent top and bottom line growth in the mid and upper single digits respectively
  • Continued operating leverage of current infrastructure
  • Strong balance sheet and cash flow used in the best interest of shareholders


$SYK.US

[category earnings] [tag SYK]


Julie S. Praline

Director, Equity Analyst


Direct: 617.226.0025

Fax: 617.523.8118


Crestwood Advisors

One Liberty Square

Suite 500

Boston, MA 02109


www.crestwoodadvisors.com


MSFT Q3 Results


Current Price:   $254                     Price Target: Raising to $290 (from $255)

Position Size:    7.7%                     TTM Performance: 49%


Key takeaways:

  • Broad beat with 19% YoY revenue growth. Despite beat, stock trading off a bit after hitting an all-time high ahead of earnings.  
  • Azure continues to be key growth driver – Azure continues to take share in the public cloud with revenue ahead of expectations at +46% YoY in constant currency. A slight deceleration from +48% last quarter.
  • Teams strength – users doubled to 145M monthly active users.
  • CEO, Satya Nadella said, “Over a year into the pandemic, digital adoption curves aren’t slowing down. In fact, they’re accelerating and it’s just the beginning. Digital technology will be the foundation for resilience and growth over the next decade. We are innovating and building the cloud stack to accelerate the digital capability of every organization on the planet.”


More details to come…


Sarah Kanwal

Equity Analyst, Director


Direct: 617.226.0022

Fax: 617.523.8118


Crestwood Advisors

One Liberty Square, Suite 500

Boston, MA 02109

www.crestwoodadvisors.com


GOOG Q1 Earnings Update

Current Price: $2,434     Price Target: $2,750 (increased from $2,210)

Position Size: 4.6%         TTM Performance:+96%


Key takeaways:

  • Broad beat with total net revenue up 35% on search growth accelerating to +30% YoY and YouTube accelerating to 49%.
  • Digital ad spending surging seeing broad based growth in ad revenue as companies return to spending with vaccine rollout.
  • Cloud strength continues – revenue +46% YoY with segment losses narrowing
  • Capex spending resuming– after reducing spend on offices and data centers last year, they are resuming their spending levels. Notably, they largely plan to return to the office in September and not maintain a big WFH presence. Lots of tech firms coming out w/ greater degree of return to office than expected.
  • Big buyback announced – $50B repurchase authorization announced.


Additional Highlights:

  • Some quotes from the call…
    • data suggests that investment in startups is at an all-time high”
    • “we are seeing an acceleration in the shift to digital”
    • “consumers are spending more time online, they’re buying more online, they were willing to try new brands and they’re eager to support local businesses, SMBs. So, searches for support local businesses are up significantly since last year. And we’ve been focused really on helping SMBs with simpler tools, so they can actually embrace digital a lot faster. And that’s where we have really invested over the year, making everything simpler. We had a very wide range of solutions to help them get online, get discovered across all of our key products, Search, Maps, YouTube and so on. And there is multiple, multiple fascinating stories from them coming back to us.”
  • More ad tailwinds to come…
    • Consumer activity ramping as global economy re-opens, aided by government stimulus
    • Hardest hit industries, like travel, brick-and-mortar retail, restaurants and entertainment, are significant sources of ad spend and are just starting to ramp back up
    • Some geographies further behind on re-opening or facing renewed shutdowns w/ a re-acceleration of cases, so ad spend recovery is delayed
    • SMBs are becoming more digitally capable post-pandemic
  • TAC – Total traffic acquisition costs down slightly. Content acquisition costs for YouTube are a big driver of this.
  • Op margin expansion: sizable operating leverage again. Q1 operating margin was 36% (off of net rev), up 230bps QoQ.
  • No commentary on 2H outlook – “it is too early to tell” how consumers  will  behave. However, they have some easy compares ahead and broad ad momentum as the global economy re-opens in stages and marketing budgets ramp up.
  • “Search & Other” revenue ($32B) accelerated to +30% (from +17% last quarter).
    • Particular strength in retail (local searches +80% YoY)
    • Seeing strong interest from users looking to plan their next trip, even before they’re ready to book. GOOG helping airlines add routes in response to consumer destination interest.
    • Maps will be adding over 100 AI powered improvements this year, such as indoor live view, which helps you navigate airports, transit stations and malls using augmented reality.
    • Google News Showcase – their $1 billion investment in the news industry…they’ve added more than 170 publications across 12 countries with more coming soon. Trying to get ahead of regulators.
  • YouTube ad sales ($6B) were +49%,
    • YouTube Shorts, their competitor to TikTok, logged 6.5 billion daily views as of March, up from 3.5 billion at the end of 2020.
    • According to a recent study by Ipsos, 77% of respondents said they used YouTube in 2020 to learn a new skill.
    • Growing faster than search revenues as advertisers are turning to streaming platforms like YouTube to reach people who are no longer watching TV and as audiences become more fragmented. 
    • In the U.S., >100 million people watch YouTube and YouTube TV on their TV screens each month. 
    • YouTube helps advertisers reach younger audiences they can’t reach anywhere else – YouTube reaches more 18- to 49-year-olds than all linear TV networks combined.
  • Network ad revenues: $6.8B, +30% YoY. This is revenue from ads placed on sites other than their own, like an ad placed on the NYT site.
  • Google cloud = Google Cloud Platform (“GCP”) + Google Workspace (i.e. collaboration tools): was $4B, +46%.
    • They don’t break out GCP growth separately. All we know is the growth rate was again “meaningfully above” the Cloud segment overall. Very positive commentary on GCP – they are accelerating their investment in this business.
    • Called out 3 trends driving their strong cloud results…
      1. Data cloud – their expertise in real-time data, AI & ML are helping them win customers like Twitter and HSBC
      2. Customer focus on operational efficiencies & reduction of IT costs in a multi-cloud environment
      3. Hybrid work – GOOG continues to deliver helpful innovations to enable hybrid work with Google Workspace. This includes digital tools for front line workers like nurses and retail store workers, as well as new security offerings. These innovations have helped grow their revenue per seat and the number of seats in the last quarter.
  • Capex – will be up YoY after big cuts last year. In 2021, in the US alone, they plan to invest over $7 billion in offices and data centers
  • ESG – Continue to make progress on their sustainability goals. They matched their operations with 100% renewable energy for the past four years and they are working towards operating on carbon-free energy round the clock by 2030.
  • Valuation – They ended the quarter with $110B in net cash, that’s ~7% of their market cap. The stock is still reasonably valued, trading at a ~3.4% FCF yield on 2021.


$GOOGL.US

[category earnings ]

[tag GOOGL]


Sarah Kanwal

Equity Analyst, Director


Direct: 617.226.0022

Fax: 617.523.8118


Crestwood Advisors

One Liberty Square, Suite 500

Boston, MA 02109

www.crestwoodadvisors.com


Schwab Q1 earnings

On 4/22, Schwab hosted their spring update detailing exceptionally strong quarterly earnings. The merger with TD Ameritrade and the surge in retail activity have driven Schwab’s business trends:

  • Total client assets rose to $7.1t up 6% QoQ
  • Core new asset growth shot up 24% QoQ, totaling $148.2b inflows for the quarter which is more than last year’s flows!
  • Revenue up 13% QoQ   
  • Trading (up 45%) and margin lending (up 20%) surged during the quarter, helping revenues.


Current Price: $67.8                         Price Target: $78 (up from $68)

Position Size:   2.41%                       Performance TTM: 95.1%


Schwab is building scale and platform as premier asset gather. 

  • Transfer ratio of 1.6, means that 1.6x the assets came to Schwab from competitors than left Schwab
  • Schwab recorded 1,597k new households for Q1, up 92%. 
  • Schwab is succeeding with millennials.  70% of new-to-firm households were under the age of 40.

TD Ameritrade merger

  • One-time costs are a bit higher (+$600m) than expected and now targeting $2.0b-$2.2b total costs. 
  • Scope of back-office data/hosting/software Integration has increased with surge in retail activity
  • Estimates for recurring synergies have increased +$800m to an expected $4.3b-$4.8b annually

Net interest margin of 1.48% down from 1.55%

  • Average interest earning assets rose 60% ($465b) driven by market volatility and mergers.
  • Schwab remains levered to rising rates:
    • Increase 50bips in 5-year UST will increase revenues by 8%
    • Increase of 25bips in Fed Funds Rate will increase revenues by 15%

Profitability – industry leader

  • ROTE of 24% and pre-tax profit margin of 47.4%.  Expect margins to continue to expand over the next 2-3 years due to cost savings and scale from the mergers
  • Current expenses are elevated due to mergers

Capital allocation

  • Schwab plans to build capital on the balance sheet due to rising deposits and mergers, which may temper share buybacks.
  • Dividend yield of 1.05%


Schwab Thesis:


  • Expect Schwab’s vertically integrated business model to drive AUM growth.  Schwab has averaged 6% organic core net new asset growth as retail clients and advisors are attracted to Schwab’s low-cost trading and custody services.
  • Conservative, well-managed firm who is a leader in online trading and focused on leveraging platform. 
  • Schwab has experience material AUM growth with USAA and TD Ameritrade mergers.  Expect SCHW to reduce costs and continue to leverage platform.


Please let me know if you have any questions.

Thanks,

John


$SCHW.US


John R. Ingram CFA

Chief Investment Officer

Partner


Direct: 617.226.0021

Fax: 617.523.8118


Crestwood Advisors

One Liberty Square

Suite 500

Boston, MA 02109

www.crestwoodadvisors.com