CSCO Q3 2021 Results

Current Price: $52                           Price Target: $58 

Position size: 2.8%                          TTM Performance: 15%


Key Takeaways:

  • Top line and EPS beat with better-than-expected revenue guidance. EPS guidance for next quarter was a slight miss driven by cost pressures from semi supply issues.
  • Robust demand is key positive despite short-term headwind from chip shortages which are weighing on revenue and margins. If not for these semi supply chain issues, revenue and EPS guidance would have been higher.
  • Secular drivers ramping – they are seeing early momentum in the ramping of key technology transitions (Wifi 6, 5G, 400 gig, edge) that are catalysts to companies modernizing their aging network infrastructure. They’ve been investing behind these big market transitions for a long-time, they’re finally starting to come to life and will be long-term growth drivers for their business.
  • Mix shift to software and recurring revenue continues as an increasing number of their products are to be offered this way. They now have one of the largest software businesses in the industry with an annual run rate well over $14B, about 81% of that is SaaS.
  • CEO Chuck Robbins said“we are experiencing the strongest demand in nearly a decade” and “the next phase of the recovery and the future of work will be heavily reliant on our technology.”


Additional Highlights:  

  • Sales of $12.8B (+7% YoY) and EPS of $0.83 beat Street expectations ($12.57B and $0.82, respectively).
  • Quotes from the call…
    • “These results reflect a return to a strong spending environment and an economic recovery that has gained momentum driven by vaccine rollouts and the easing of restrictions. As the economy has improved, customers have increased their investment across our portfolio to prepare for the upturn and return to office.”
    • “Customers are turning to us to help them create the trusted workplace of the future.”
  • Supply chain issues & inflation – component availability is holding back revenue, they absorbed some cost increases to meet demand and started to make some limited price increases. They think this will last through the end of the calendar year – if it’s longer, they will look to make further price increases to offset. They don’t think the demand they’re seeing from customers is being impacted by over-ordering.
  • Improving demand in hardest hit industries – “we’ve actually seen double-digit growth in hospitality and healthcare and retail and we’ve even seen the cruise lines making significant purchases as they prepare to go back out.”

  • Growing mix of recurring revenue should expand their multiple –Software mix is close to 1/3 of revenue w/ 81% of software sold as subscription. That means over 1/4 of total sales is from software subscriptions sales (or ~$14B). Additionally, ~27% of rev is services with much of that from maintenance/support which tend to be recurring. So overall recurring revenue could be ~45% or more (they don’t break it out specifically). They have a growing “as-a-service” portfolio driving the mix shift happening w/in their business which should be supportive of their multiple and their margins. The majority of our total revenue growth in the quarter came from recurring revenue streams.
  • Momentum w/ web-scale cloud providers – the positive commentary from last few quarters continued. Webscale was again ~25% of Service Provider orders, w/ order growth up 25%. This is an end market where they lost share to Arista in the past, but their positioning is improving w/ new products launched last year. That being said, this is still early stages – mgmt. indicated it may take a year or two for this to be a meaningful top line contributor. Could see performance vary quarter to quarter, due to the timing of large deals, but they are “incredibly confident” around their prospects in this area. Recently extended their webscale product offering – broadened their Silicon One platform from a routing focused solution to one which addresses the webscale switching market, offering the highest performance, programmable routing and switching silicon on the market.
  • During Q3, they closed three acquisitions (Acacia Communications, IMImobile, Dashbase) consistent with their strategy of complementing R&D with targeted M&A to strengthen their market position growth areas.
  • Valuation: trading at >7% FCF yield on fiscal 2022, which ends in July. This is well below S&P average of ~4%, for a strong balance sheet, high FCF generative business (~30% FCF margins) w/ a growing mix of software and recurring revenue. Fundamentals continue to be supported by business transformation/digitization trends (which are accelerating) at a reasonable valuation while much else in tech has seen substantial multiple expansion. Additionally, their valuation is supported by a 2.8% dividend yield which they easily cover. They have ~$12B in net cash on their balance sheet, or >5% of their market cap.


Sarah Kanwal

Equity Analyst, Director


Direct: 617.226.0022

Fax: 617.523.8118


Crestwood Advisors

One Liberty Square, Suite 500

Boston, MA 02109

www.crestwoodadvisors.com


$CSCO.US

[category earnings ]

[tag CSCO]

Fortive Investor Day summary

Yesterday, Fortive held its Virtual Analyst Day, providing us with a summary of their performance in the last 5 years, and their plan for the upcoming 5. Overall it was pretty positive, and we continue to think this stock should outperform its peers. Recent M&A activity has made its core business performance a bit more difficult to assess, followed by the pandemic, but as we move forward post divestments, we should get a better picture of the quality of its various underlying bsuinesses.


How has Fortive evolved in the last 5 years. Here their next 5 years plan:

  • Revenue growth went from GDP/GDP+ to mid-single digits, with MSD growth rate for next 5 years
  • Recurring revenue from 18% to 38% (and next 5 year target of 45-50%), and software from minimal to 13% of sales (to reach 20% in 5 years)
  • Gross margin went from 49% to 58% (and next 5 years target to reach 60%)
  • EBITDA from 23% to 24% (and next 5 years target in high 20s)
  • FCF guidance for 2021 of $970M to reach over $1.6B in 5 years


Three key areas of focus for their Fortive Business System (FBS) – a toolbox set in place to seek outperformance:

  1. Innovation: partnered with Pioneer Square Labs to nurture start-ups that will ultimately be part of FTV’s portfolio. >$2B in market opportunities have been discovered via these innovation initiatives
  2. Software: to improve business processes, and drive dollar retention. SO far they have seen 400bps in net dollar retention.
  3. Data analytics: identified $250M in projects in 2020, driving the next generation of products.


How good is Fortive at integrating acquired businesses? Here’s the example of ASP, acquired from JNJ:

FTV had to create their critical business infrastructure, including HR systems, CRM systems, legal entities and transferring business licenses. 10,000 customer contracts were converted, 77 logistics hubs were reduced to 28 (and keeping deliveries on time). The integration process was planned to take 24 months but was done in 10. The customer installed base had been declining prior to acquisition, and is now on track to expand by 6pts between end 2019-end 2021.


Segment review:

Advanced Healthcare Solutions: The company in 2021 is expected to see $1.2B in revenue, gross margin of mid-50%, EBIT margin of low-20%,  and market size of $10B and growth of mid-single-digits

Changes made in this segment since 2016:

  • Total addressable market grew from $1.1B to $10B
  • Revenue grew from $170M to $1.2B
  • Recurring revenue from less than 5% to 70%
  • Operating margin from 20% to mid-20%


Precision Technologies: expect 2021 revenue to reach $1.8B, gross margin in the low 50%, EBIT margin 21-22%, market size of $14B with growth of LSD.

Macro drivers:

  • Internet-of-things
  • Growth in wired and wireless communications
  • Need for higher power density given electrification and sustainability push


Intelligent Operating Solutions:

2021 guidance: $2.1B revenue ($1.2B in 2016), 66% gross margin, 27-28% EBIT margin, $19B addressable market (%7B in 2016), growing in the mid-single-digits.

Secular drivers:

  • an ageing technician workforce
  • increasing penetration for software-enabled solutions
  • connectedness through the proliferation of sensors
  • risk/sustainability management complexity
  • competition driving need for productivity improvements
  • explosion of data.


The theme of sustainability was one of the main pillars of their annual investor presentation, a trend that has accelerated most in the last 18 months than in the past 2 decades.

Their 5 pillars are:

  1. Empower an inclusive and diverse team
  2. Invest in communities served
  3. Protect the planet
  4. Work and source responsibly
  5. Operate with principle


FTV increased its goal of reducing scope 1 and scope 2 carbon emissions by 50% 2025 (vs. 40% by 2030).

Similar to Crestwood, FTV is working on increasing its diversity, inclusion and equity.


A snapshot of Fortive’s portfolio:


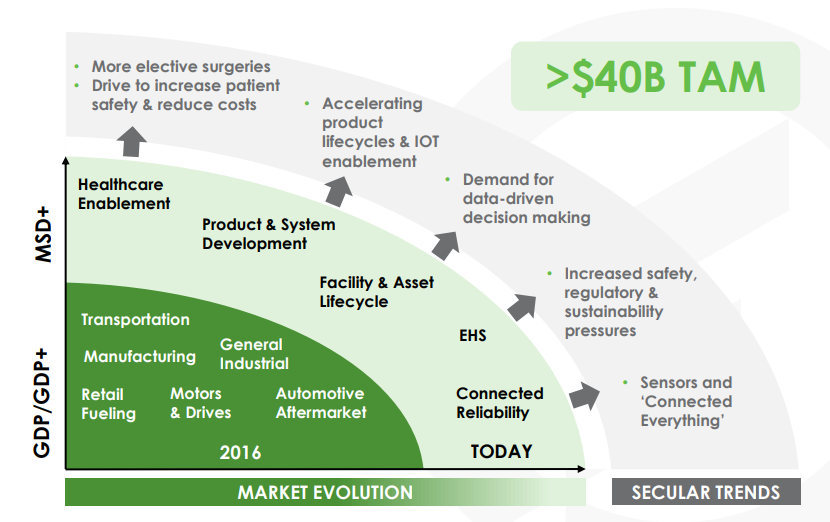
How do they look at their Total Addressable Market (TAM):


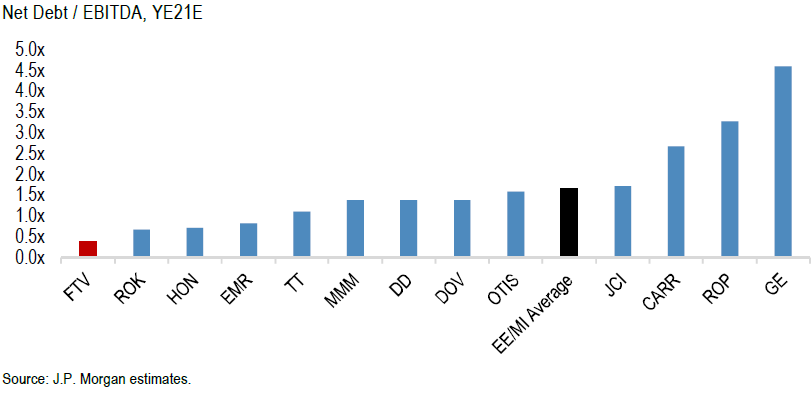
Regarding the balance sheet, Fortive has the lowest leverage vs. peers:


FTV Thesis:

  • Market leader:
    • Leadership position in most of the markets they serve
    • Experienced leadership team
    • Above industry margins with strong cash flows
  • Quality:
    • FCF yield ~5%
    • Organic growth target of 3-3.5% (4-5% in last 2 quarters after being under the target in prior quarters)
    • M&A strategy to enhance top line growth
    • Margins expansion from new products introduction, continued application of the Fortive Business Systems and M&A integration
  • Shareholder friendly:
    • Management team focused on shareholder wealth creation through top line sustainability and margin expansion

$

FTV.US

Category: earnings

Tag: FTV


Julie S. Praline

Director, Equity Analyst


Direct: 617.226.0025

Fax: 617.523.8118


Crestwood Advisors

One Liberty Square

Suite 500

Boston, MA 02109


www.crestwoodadvisors.com


Home Depot Q1 Earnings

Current Price: $312                     Target Price: $340

Position size: >2%                        Performance since inception: +57% (4/16/20)


Key Takeaways:


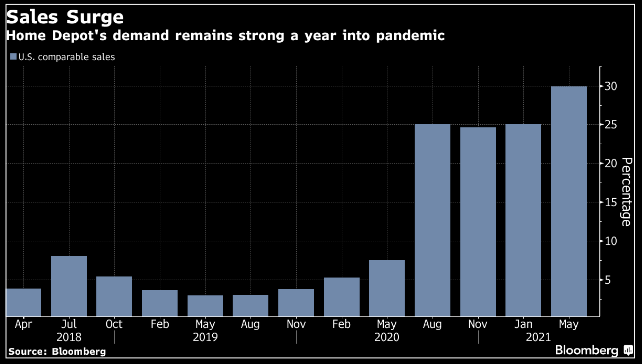
  • Crushed SSS expectations w/ an incredible 31% comparable store sales increase. No doubt there are some stimulus checks being spent at HD. They continue to take share in home improvement.
  • Talk of “peak growth” not concerning  – they face tough SSS comparisons ahead, but multiple secular tailwinds persist.
  • DIY strength continues and Pro growth is accelerating after pent-up demand from social distancing caused a delay in inside projectsThey had double-digit growth with both Pro and DIY customers – “Pros continue to tell us that project demand is strong, and their backlogs are growing.”
  • Omni-channel strategy continues to shine. E-Commerce sales are mid-teens % of sales and up +27% YoY, with 55% of online sales picked up in store.
  • Still not giving guidance
  • Mgmt. quote from call…”we’re at post-World War II housing availability, so you know, two months of supply versus historical average of six, that situation won’t be resolved in near-term. It’s going to take time for that to be resolved, so I think that supports continued growth in home values which, we know, as home values grow, people feel good about investing in their home overall. So that alone is, I think, a very positive outlook for home improvement as you move forward.”


Additional Highlights:

  • Talk of “peak growth” not concerning
    • Growth rate slowing doesn’t mean the business is shrinking or that the multiple will contract. While the rate of growth (after this extraordinary year!) will clearly slow, their business will continue to grow over time. They will be lapping difficult comparisons this coming year, which could lead to some negative SSS results in the near-term. However, this commentary is really just about short-term cadence of growth and not about their long-term opportunity to continue to consolidate a fragmented market in home improvement w/ DIY & Pro, grow their more nascent MRO business (particularly after HD Supply acquisition) and leverage their best of breed omni-channel model.
  • Secular tailwinds persist – rising household formation, record low inventory, higher input costs (materials & labor), stimulus = higher home prices. And higher home prices plus an aging housing stock drive remodeling spend.
    • The bottom line is we need to build more homes. With the backdrop of rising household formation, demand for second homes and an aging home stock, Sam Khater, chief economist at Freddie Mac said, “We should have almost four million more housing units if we had kept up with demand the last few years. This is what you get when you under-build for 10 years.” US housing starts are at a 1.6-1.7m annual rate. Permits are running ahead of starts.
    • Inventory of existing homes for sale is also at a low…two-month supply vs long-term avg of ~6 months (foreclosure moratorium is helping keep inventory low; it’s set to expire in June but could be extended again).
  • Higher inflation = higher SSS = higher operating leverage: SSS had a +375bps impact from inflation driven primarily by lumber and copper. This had a negative impact on gross margins; they are passing through pricing, the negative impact was driven by mix (i.e. lumber is a relatively lower margin item). The net effect for them is growing operating profit dollars. In other words, they benefit. The negative impact of inflation would be if the higher prices started to impact overall demand, but there are no signs of that happening and long-term secular demand drivers are strong. Op margins increased by 380bps in the quarter; natural leverage on higher volumes and inflation added to that.
    • What’s happening with lumber? Perfect storm of supply chain issues and higher demand…
      • Demand rising as new construction and remodeling is booming aided by monetary and fiscal stimulus. Storm repairs have also been a big driver.
      • Sawmill cutting capacity is the supply bottleneck & that might not improve soon – timber gets cut, transported to saw mills which produce lumber. Timber is plentiful, even oversupplied in some areas, but sawmill capacity is tight. This time last year, 40% of sawmills in N America were shut. They didn’t fully re-open until December. Sawmill capacity is still ~15% below where it was in 2006, that was the peak and was the last time this many homes were being built. There isn’t much new sawmill capacity planned, the lead time is fairly long and shortages in the necessary equipment and the labor to operate it are both a hurdle. Tight supplies and high prices could last into 2022 as storm related demand abates but general housing strength continues.
      • Transportation is also feeding into higher prices.
    • Wages/labor shortages – they got out ahead of wage increases, so not seeing a big impact and, overall, not having an issue finding labor. During fiscal 2020, they  invested ~$2 billion on enhanced compensation and benefits for associates – they made about half of those increases permanent.
  • Best of breed omni-channel model drives productivity 
    • By adding specialized warehouse capacity (plan to increase fulfillment sq footage by 70% this yr.) and enhancing digital capabilities (online and in the store), HD is uniquely positioned to leverage their existing retail footprint (not really growing stores) and drive steadily high ROIC that is ~45% (which is incredible).
    • They dominate the category, are the low cost provider, have a relentless focus on productivity and can continue to flow an increasing amount of goods through their big box stores w/ omni-channel. This is a highly efficient model as 55% of online sales are picked up in-store which HD can fulfill from the store or nearby warehouses.
    • Their express car and van delivery service that covers over 70% of the U.S. population.

·        Capital allocation: they’ve resumed share repurchases and remain committed to growing their dividend over time – they increased it 10% last quarter.

·        Valuation: Strong balance sheet, benefiting from strong housing trends but also has defensive qualities and a reasonable valuation, trading at ~4.4% forward FCF yield.


Sarah Kanwal

Equity Analyst, Director


Direct: 617.226.0022

Fax: 617.523.8118


Crestwood Advisors

One Liberty Square, Suite 500

Boston, MA 02109

www.crestwoodadvisors.com


$HD.US

[tag HD]

[category earnings]


Disney Q2 earnings


Current Price: $170     Price Target: $215

Position size: 2%          TTM Performance: +35%   


 Key Takeaways:

  • Revenue was a slight miss, but they beat on earnings w/ weaker than expected Disney+ subscriber numbers – after a few quarters of big beats on subs, this quarter they beat on Hulu and ESPN subs and missed on Disney+ subs. The stock was down on this news. Weaker numbers not concerning and are partly impacted by delayed launch in LATAM and Covid related content delays.
  • They had 104m Disney+ subs vs expectations for 109m subs. Despite this quarters numbers, overall Disney+ is still ramping way faster than expected, faster than NFLX and with no change to long term targets.
  • Positive commentary on theater re-openings – announced two films opening exclusively in theaters in Aug (Free Guy) and Sept (Shang-Chi) amidst “recent signs of increased consumer confidence in movie-going.”
  • Parks are recovering – parks are open (except Paris), operating at capacity limits, showing promising signs of future demand and open parks contributing to profitability. Shanghai Disney Resort is operating above FY ’19 levels.


Additional highlights:

  • They now have 159M subs across Disney+, Hulu and EPSN+. That is second only to Netflix, which has about 204M. Disney+ now has 104M subs, Hulu is ~42M and ESPN has ~14M. Goal is 230-260m Disney+ subs by 2024.
  • Weaker subscribers not concerning – subs this month were weaker than expected and they gave sub guidance for Q2 below consensus. Weaker numbers in part driven by Covid crisis in India and by pushed back launch in Latin America (timing the launch w/ key sports content). Despite that, in general they are ramping faster than anyone expected, they’re still in the early stages of their global rollout.
  • ARPU was lower than expected but should steadily rise over time – ARPU at Disney+ Hotstar was down significantly versus Q1 due to lower advertising revenue as a result of the timing of IPL cricket matches and the impact of COVID in India (~1/3 of Disney+ subs). They had planned price increases in some markets that were put in place at the end of the quarter that haven’t had an impact yet. Lower Disney+ fees are largely driven by lower fees outside the US, but they will gradually continue to raise prices over time and they have ways (other than sub fees) to make money off of their content w/ advertising, parks and consumer products (especially w/ content like Pixar, marvel, star wars).
  • Flexibility is a key component of their distribution strategy. They have 3 approaches for distributing films. 1) Release in theaters with a simultaneous offering via Disney+ Premier Access, 2) release straight to Disney+, and 3) traditional exclusive theatrical releases. Hybrid releases mitigated the impact of theater closures, but theaters are re-opening and they intend to continue to use this model.  
  • Content updates…
    • Returning to full production at their studios
    • Searchlight’s Nomadland (now on Hulu) took home Oscars for Best Actress, Best Director (w/ Chloe Zhao becoming the first woman of color to win the award), and Best Picture.
    • Pixar’s Soul (now on Disney+) took home Oscars for Best Animated Feature and Best Original Score
    • Moving more content to ESPN+ over time will mitigate cord cutting“While our overall strategy is still very supportive of our Linear business, given the important economic value it drives for the company, we are also building out our ESPN+ Direct-to-Consumer offering. And with every deal we make, we are considering both the Linear and DTC components.” They’ve had some recent key ESPN+ additions w/ UFC, NFL, NHL, MLB, the PGA Tour, La Liga and Bundesliga (Spanish & German soccer leagues).
  • Park re-openings…everything but Paris is open. Parks and resorts that were opened during the quarter all operated at significantly reduced capacities, yet all achieved a net incremental positive contribution during the period they were open – meaning revenue exceeded the variable costs associated with being open. They are not seeing labor shortages in terms of bringing cast members back to the parks.


Sarah Kanwal

Equity Analyst, Director


Direct: 617.226.0022

Fax: 617.523.8118


Crestwood Advisors

One Liberty Square, Suite 500

Boston, MA 02109

www.crestwoodadvisors.com


$DIS.US

[category earnings ]

[tag DIS]


Update on Semi Shortage

Thought I would send a note with some thoughts on the chip shortages we are seeing that are effecting a wide range of products from cars to game consoles to appliances…


Why do we have shortages? Perfect storm of a structural increase in long-term demand and a short-term imbalance in the supply chain.

  • Pandemic demand shift – demand increased for a wide range of semiconductor intensive products as the pandemic accelerated digital transformation and increased demand for electronics tied to from work/learn from home and for home appliances, TVs etc. Accelerated demand in many areas will have a long tail (e.g. 5G, IoT).
  • Rapid demand recovery coupled w/ lean inventories – The auto industry is a perfect example of this. Heading into the pandemic, autos were already weak then Covid weakened demand further. The problem arose when demand suddenly picked up in Q4. The long and complex auto supply chain, w/ tight inventory mgmt., couldn’t respond to the demand swing quickly (particularly w/ increased semi demand from other places, see previous bullet)…from chip production to car production, it takes ~6 months with several tiers of suppliers in between.
  • Stockpiling – there is inventory hoarding that is making a tight supply situation even worse, in part to ensure supply b/c of geopolitical tensions and in part in response to supply chain disruption due to Covid.
    • Huawei, for example, began building up inventory to buffer themselves from US sanctions set to cut them off from key suppliers. Overall, China’s chip imports increased ~15% to ~$380B in 2020, up from $330B in 2019.
  • Confluence of weather and disasters
    • Semi manufacturing can be water intensive. Taiwan suffered its worst drought in decades…TSMC, one of the 3 largest foundries is located there.
    • A plant in Japan that’s a major provider of automotive chips was damaged by fire in March.
    • Weather related power outages at Texas facilities impacted TSMC auto chip supplies and Samsung SSD controllers for PCs.


What is it impacting?

  • Shortages are particularly apparent in certain areas like lower end chips (like display IC’s and power mgmt. chips vs CPUs & GPUs), but the impact is pervasive b/c they go into a lot of stuff…laptops, webcams, printers, contactless payment equipment, TVs, air purifiers, cars, washer/dryer etc.


Implications?

  • Tons of spending aimed at increasing semi manufacturing…including in mature nodes.
    • Intel unveiled plans in March to spend $20B to build two new factories in Arizona.
    • TSMC ramping its capex to $100B over the 3 yrs., including about $30B in 2021 (~80% of the 2021 capital budget will be allocated for advanced process technologies, including 3-nanometer, 5-nanometer, and 7-nanometer), from a record $17B last year.
    • Samsung plans to spend $116B over the next decade to compete w/ TSMC.
    • SMIC has plans for a $2.35B plant with funding from the city of Shenzhen.
    • US, Europe and China are all being aggressive about building domestic capacity, aided by gov’t stimulus.
      • Biden looks to spend $50B to support semiconductor manufacturing/research and may offer tax incentives for a proposed $12B TSMC plant in Arizona and a potential $17B Samsung facility in Texas.
      • The EU has a goal to double chip production to 20% of the global market by 2030. They are looking for TSMC and Samsung to potentially build advanced semi fabs there.
      • China has a 5 yr. plan that includes significant spending aimed at producing cutting-edge chips.
  • Inflation – shortages are leading to higher prices. Goldman estimates that this could have a 3% impact on effected goods…chips are an important production input to ~12% of GDP…so they say this could boost inflation by 40bps…
  • Delaying revenue – For example, the car industry expects a negative $61B impact this year and Apple said it would see a $3-4B revenue hit as it would impact availability of Macs and iPads.
  • Capacity expansions increasing talk of next cycle – The semiconductor industry has cycles that are generally supply driven (though it is less cyclical than it used to be), so the massive increases in supply bode watching, particularly w/ mature nodes.


How long will it last?

  • Opinions vary, but this could last into 2022, maybe 2023. The bottom line is that this is temporary as there are massive amounts of supply set to come on. Timeline also varies by type of chip. Massive amounts of supply are coming on that will alleviate this, but adding capacity takes time. TSMC forecast in April the shortages could extend into 2022, but said they would see some improvements next quarter.


Sarah Kanwal

Equity Analyst, Director


Direct: 617.226.0022

Fax: 617.523.8118


Crestwood Advisors

One Liberty Square, Suite 500

Boston, MA 02109

www.crestwoodadvisors.com


$AAPL.US

[category equity research]

[tag AAPL]


CCI Q1 2021 Results


Current price: $183          Target price: $201 (up from $190)

Position size: 2.3%           TTM Performance: 16%


Key takeaways:

  • Encouraging guidance – CCI beat estimates and raised full year guidance.
  • Solid AFFO/share growth – should be low-double-digits in 2021. Carrier investments in 5G are increasing; higher growth targets aided by recent VZ tower deal.
  • 11% dividend increase – ahead of long-term 7-8% dividend growth target
  • 5G investment cycle is (finally) ramping…CEO Jay Brown said, “Following a period of building excitement and anticipation, we have seen a significant increase in activity as our customers have started to upgrade their networks to 5G at scale.”


Additional highlights:

  • They now anticipate 11% growth in AFFO/share for the full year 2021 (a recent VZ tower agreement aided this), meaningfully above their long-term annual target of 7% to 8%. They expect to grow the dividend in line w/ AFFO growth.
  • Quote from the call….
    • “We’re obviously very, very encouraged by the activity that we’re seeing among the carriers. We’re not surprised by the urgency that our customers are showing in deploying 5G. The level of commitment that they showed during the C-band auction was really a clear sign that they’re going to invest heavily in 5G. And so, the activity we’re seeing I think just flows from that. We’re seeing that turning to actions as they’re deploying significant amounts of 5G networks and we’re really encouraged by the activity that we’re seeing.”
  • CCI can leverage the synergistic value of their shared infrastructure (>40K towers; ~ 80Ksmall cells on air or committed in backlog; 80K route miles of fiber concentrated in the top U.S. markets) to increase capacity utilization w/ continued lease up activity, growing their ROIC, AFFO/share and dividends. With LT AFFO/share growth of 7-8% and ~3% dividend yield, they should compound total returns double-digits over a long period of time as demand for their shared infrastructure offering across towers, small cells and fiber is all tied to robust mobile data growth (~ 30% annually).
  • Multi-year tailwinds to drive leasing activity > 5G, spectrum deployment & densification
    • Data demand drives the need for additional spectrum and the only way spectrum can meet demand is to deploy it on towers and small cells.
    • Densification – In addition to deploying more spectrum, cell site densification has always been a key tool that carriers have used to add network capacity to get the most out of their spectrum assets by reusing the spectrum over shorter and shorter distances. The nature of wireless networks requires that cell site densification will continue as the density of data demand grows, particularly given the higher-spectrum bands that have been auctioned in recent years.
    • 5G Spectrum deployment – Leasing activity will increasingly be driven by spectrum deployment for 5G. Mid-band (C-band) and high-band (mmWave) spectrum are both are relevant for 5G and will drive lease up activity for CCI.
      • Mid-band (C-band) spectrum deployment –C-band is often referred to as the “goldilocks” band as it is an ideal balance between bandwidth and propagation (i.e. its ability to carry more data and travel far distances). It can be deployed via towers and small cell. Carriers just spent a lot of money at recent c-band auctions, now they need to spend to deploy the spectrum – they announced a significant new VZ tower agreement related to this.
      • High-band (mmWave) spectrum is significantly more capacity, but over a fraction of the geographic coverage area (lower propagation) which is why it needs to be deployed using small cells connected to fiber, making it ideal for dense urban areas. This densification is a driver of additional leasing. Growth in small cells should drive improving returns as they expect decreasing capital intensity for growth within their small cell and fiber business. With small cells there are “anchor nodes” and “colocation nodes” – the first “anchor” nodes are a lower ROI and additional nodes on existing infrastructure have higher incremental margins. So as lease-up activity continues, their ROI improves.
    • 5G phones as a catalyst – CEO says ” we saw an important milestone and the march towards greater network densification, when Apple announced that all iPhone 12 models sold in the US support millimeter-wave spectrum bands…This announcement reminds me a lot of 2007. At the time the wireless carriers in the US had accumulated a vast supply of 3G capable spectrum, but there were no use cases identified requiring that much capacity. At the time phones were used for talking and in limited cases texting. Ringtones were the exciting feature you could download to personalize your device. Then Apple launched the original iPhone and the world changed.” The introduction of the iPhone kicked-off an era of wireless innovation that spurred unprecedented investments in wireless networks. 
    • The situation is similar now. The new iPhone was launched for spectrum bands that are not yet deployed at scale. The use cases for 5G are few, but as the iPhone 12 proliferates, the installed base grows the incentive for new applications to be created and for the relevant spectrum to be deployed. Step function increase in latency and bandwidth will spur innovation and efficiencies across industries. CCI makes money off of the infrastructure and Apple makes money off of the applications.
  • Balance sheet strength – They continue to methodically reduced the risk profile of their balance sheet. In Q1, they lowered weighted average borrowing costs and extended the average maturity of their debt. Since they achieved their initial investment grade credit rating ~ 5 yrs ago, they have increased average debt maturity from 5 yrs to 10yrs, reduced average borrowing costs to 3.1% from 3.8%, increased mix of fixed-rate debt to > 90% from < 70% and reduced reliance on secured debt to ~15% from ~50%. No meaningful near term debt maturities and ~$4B of undrawn capacity on their revolving credit facility.
  • Reasonably valued, trading at ~3.7% 2021 AFFO yield.


Sarah Kanwal

Equity Analyst, Director


Direct: 617.226.0022

Fax: 617.523.8118


Crestwood Advisors

One Liberty Square, Suite 500

Boston, MA 02109

www.crestwoodadvisors.com


$CCI.US

[category earnings]

[tag CCI]


Black Knight 1Q21 Earnings

Current Price: $74           Price Target: $96

Position Size: 2.3%          TTM Performance: +6%

 Key Takeaways: 

·      Q1 results that beat on revenues and adjusted EPS and they raised guidance for FY21. The revenue beat was driven by strong growth in data and analytics. 

·       Data & Analytics strength (+17% YoY): Seeing continued improvement with cross-selling Data & Analytics (~15% of revenue), which could be a solid future growth driver for them.

·       Lower foreclosures is a headwind: as they indicated last quarter, they are seeing lower foreclosure-related volumes in their Specialty Servicing software business due to the foreclosure moratorium. This should ease 1H22.


 Additional Highlights:

  • Q1 revenues of $350m, +20% and adjusted EPS growth of 19%. Organic revenue growth was 9% – highest rate since 2016, despite transitory headwinds related to the foreclosure moratorium.
  • Very positive commentary about YTD new customer wins in each segment and some recent product innovations. New clients drove 10 points of organic growth. Everything else (annual price escalators, loan growth, origination volumes, foreclosure volume transitory headwind) all netted out to ~1% headwind – that gets you from the 10% down to the reported 9% organic growth. So super high quality, new client, new solution driven quarter.
  • Their stake in D&B is now worth $1.3B. They invested just under $500m in their D&B stake ~1 year ago giving them a pre-tax unrealized gain of >$800m.

Data analytics segment (~15% of revenue) revenues were up 17%. Driven by growth in their property data and portfolio analytics businesses.

  • Organic revenue growth of ~11%
  • EBITDA margin +480bps YoY.
  • Trending ahead of LT targets in recent quarters on strong cross-sales related to new client deals, as well as renewals. They continue to see promising momentum in this business.
  • Current situation is highlighting their unique data sets and analytics. They are the only company with real-time visibility into the majority of active mortgage loans in the US. 

Software Solutions segment (~85% of revenue) up 21% YoY.

  • Organic growth of ~9%
  • Within this segment servicing (~70% of revenue) was up 4% – new client loan growth helped offset foreclosure moratorium headwinds.
  • They continue to dominate first lien loans with leading share and are growing share in second lien loans. Market share for first mortgages is >60%.
  • Originations (~16% of total revs) made up of new loans and refi’s – revenues increased 90% b/c of Optimal Blue acquisition, new clients, higher consulting revenues and higher origination volumes.
  • Segment EBITDA margin increased 80bps YoY.
  • Acquired the NexSpring cloud-based loan origination platform – a digital lending platform designed specifically for mortgage brokers that will be integrated with Empower.

Increased Guidance: FY 21 revenues expected to be +14% to 15% on organic growth of 6% to 8%. Prior range was +13% to 15% on organic growth of +5% to 7%. Includes a full year foreclosure moratorium headwind of approximately $12 million compared to 2020.

Valuation:

·       Trading at ~3.5% FCF yield on 2021 –valuation has gotten less expensive more recently and is supported by growth potential, strong ROIC with a recurring, predictable revenue model (>90% recurring revenue) and high FCF margins, which is aided by high incremental margins and capex which should taper as they grow.

·       Leverage ratio at 3.3x

·       Capital allocation priorities include debt pay down, opportunistic share repurchases and acquisitions.

Thesis:

  • Black Knight is an industry leader with leading market share of the mortgage servicing industry. 
  • Stable business with >90% recurring revenues, long-term contracts and high switching costs.
  • BKI has high returns on capital and high cash flow margins.


.UA

[tag BKI}

[category earnings]

Sarah Kanwal

Equity Analyst, Director


Direct: 617.226.0022

Fax: 617.523.8118


Crestwood Advisors

One Liberty Square, Suite 500

Boston, MA 02109

www.crestwoodadvisors.com


$BKI.US

[category earnings]

[tag BKI]


Berkshire Hathaway Q1 2021 results

On 4/30, Berkshire Hathaway reported their 2021 Q1 results followed by their annual meeting for shareholders.   Key takeaways from the quarter are as follows:


  • Berkshire reported $7.02b operating earnings versus $5.87b from prior year
  • Buffett repurchased $6.6b of shares about 1%  
  • Cash on books increased to $145B represents $62 per BRK/B shares or 21% of value. 


Current Price: $284                         Price Target: $330 (raised from $300)

Position Size: 3.0%                          TTM Performance: 65.2%


Highlights from Berkshire’s annual meeting:

  • Greg Abel will succeed Warren Buffett as CEO

Buffett quote regarding retirement: “People talk about the ageing management at Berkshire,” he said. “I always assume they’re talking about Charlie, when they say that. But I would like to point out that in three more years [when Munger turns 100], Charlie will be ageing at 1 per cent a year. No one is ageing less than Charlie.”

  • Munger said Bitcoin is “disgusting and contrary to interest of civilization.”
  • Buffett said they are “seeing very substantial inflation”
  • Buffett criticized Robinhood for “taking advantage of the gambling instincts of society”
  • SPACs make it hard to find acquisitions at a bargain until this period ends


Highlights from quarter – solid cyclical rebound

  • Railroads – YoY revenue rose 5.1% and earnings fell -5.8% with pandemic slowdowns
  • Berkshire energy – YoY revenue up 31% and earnings up 63%
  • Manufacturing, service and retail – Profits rose 15% YoY
  • Insurance revenues rose 4.29% and profits up 109% YoY though BRK’s insurance profits are very lumpy.


Valuation:  Berkshire is selling at a 18% discount to intrinsic value using sum of the parts.  Their cash of $145b represents $62 per share for B shares. 


Berkshire remains a core holding, is currently undervalued, defensively positioned and cyclically sensitive to the economic recovery.


Please let me know if you have any questions.


Thanks,

John


($brk/b.us)


John R. Ingram CFA

Chief Investment Officer

Partner


Direct: 617.226.0021

Fax: 617.523.8118


Crestwood Advisors

One Liberty Square

Suite 500

Boston, MA 02109

www.crestwoodadvisors.com


REEIX – Q1 2021 Commentary

RBC Emerging Market Equity Fund Commentary – Q1 2021

Thesis

REEIX is driven through both top-down and bottom-up fundamental research that provides diversification within our full EM allocation. The fund looks for high quality companies across all market caps that have strong ESG scores. We like REEIX because of the consistent and repeatable process that allows the team to take advantage of companies with sustainable growth across all the Emerging Market (EM) landscape.


[more]


Overview

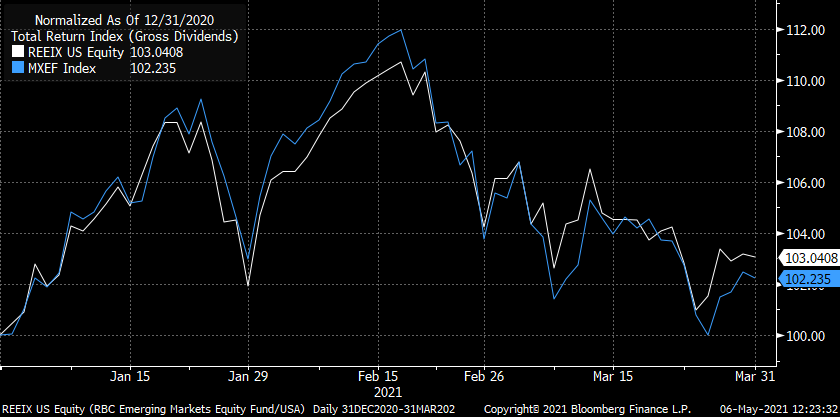
In the first quarter of 2021, REEIX outperformed the benchmark (MSCI Emerging Markets Index) by 75bps largely due to strong stock selection and regional allocation. Exposure to Chile, Saudi Arabia, and the UAE contributed, as did the fund’s relative underweight to China. Stock selection overall contributed to returns, especially in Consumer Discretionary and Information Technology. General sector allocation delivered mixed results and exposure to Turkey, Colombia, and the Philippines detracted from returns. Stock selection within Financials also detracted from overall performance.


Q1 2021 Summary

  • REEIX returned 3.04%, while the MSCI Emerging Markets Index returned 2.29%
  • Contributors
    • Region: Chile, Saudi Arabia, UAE, South Africa, China (underweight)
    • Sector: Consumer Discretionary, Information Technology
  • Detractors
    • Region: Turkey, Colombia, Philippines
    • Sector: Financials


Outlook

  • We continue to hold this fund and believe in our thesis due to the fund’s historically strong returns and understanding of Emerging Markets on both a macro and micro level
  • Possible reversal in the strength of the U.S. dollar due to aggressive balance sheet expansion by Fed, surge in US fiscal deficit, and a rally in cheaper valued asset classes
  • Promising earnings and economic growth expected in the EM region
  • 5 focused themes
    • Domestic consumption
    • Health and wellness – long term beneficiaries due to COVID
    • Digitalization – will get a boost from increased online migration and connectivity
    • Financialization
    • Infrastructure – added “Green Infrastructure” as climate change has become a larger conversation across firms


[Category Mutual Fund Commentary]


Micah Weinstein

Research Analyst


Direct: 617.226.0032

Fax: 617.523.8118


Crestwood Advisors

One Liberty Square

Suite 500

Boston, MA 02109

www.crestwoodadvisors.com


HLMEX – Q1 2021 Commentary

Harding Loevner Emerging Market Fund Commentary – Q1 2021

Thesis

HLMEX utilizes fundamental research to find companies with strong quality and growth metrics that can be compared across the global landscape. By focusing on investments with competitive advantages, long-term growth potential, quality management, and corporate strength, HLMEX offers diversity to our EM allocation while generating alpha over the long run. We continue to hold the fund because of the team’s conviction in high quality companies and managed risk through diversification and evaluation.


[more]


Overview

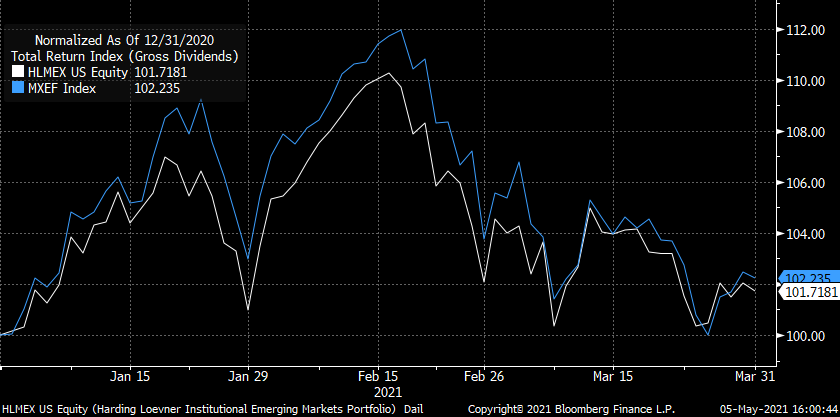
In the first quarter of 2021, HLMEX underperformed the benchmark (MSCI Emerging Markets Index) by 57bps largely due to allocation to Financials, specifically across Latin America. Selection in Communication Services and lack of exposure to Utilities also detracted from overall performance. Energy and Information Technology on the other hand contributed to returns. Poor stock selection in India, overweight to Brazil, and lack of exposure to Saudi Arabia hurt returns. Underexposure to China and strong selection in Russia, though, helped returns.


Q1 2021 Summary

  • HLMEX returned 1.72%, while the MSCI Emerging Markets Index returned 2.29%
  • Contributors
    • Novatek, Techtronic Industries, Hon Hai Precision, EPAM, and Lukoil
  • Detractors
    • Midea Group, New Oriental, Localiza, LG Household & Health Care, and CD Projekt


Outlook

  • We continue to hold this fund and believe in our thesis due to the fund’s focus on quality by emphasizing earnings growth and strong cash flow to gain attractive returns over the long run
  • Global determination to improve climate, especially through electric vehicles
  • The fund has increased its upper limit for China and Hong Kong to the higher of China’s weight in the MSCI EM Index or 35%
  • Continue to invest in durable growth – quality focus with attractive valuations
    • Only purchase this quarter was CGS (Country Garden Services), a property management company


[Category Mutual Fund Commentary]


Micah Weinstein

Research Analyst


Direct: 617.226.0032

Fax: 617.523.8118


Crestwood Advisors

One Liberty Square

Suite 500

Boston, MA 02109

www.crestwoodadvisors.com