TCPNX – Q2 2021 Commentary

Touchstone Impact Bond Fund Commentary – Q2 2021

Thesis

TCPNX (currently yielding 1.29%) is a smaller fund that does not have as many assets under management compared to our other core mangers, enabling them to make more nimble and tactical decisions. By making small allocations to undervalued “riskier” asset classes (high-yield and non-dollar denominated debt), TCPNX diversifies our fixed income portfolio and generates superior returns to the benchmark (Barclays U.S. AGG). We like that the fund utilizes a bottom-up investment process through proprietary framework analysis, fundamental security review, and portfolio risk management.


Graphical user interfaceDescription automatically generated with low confidence


[more]


Overview

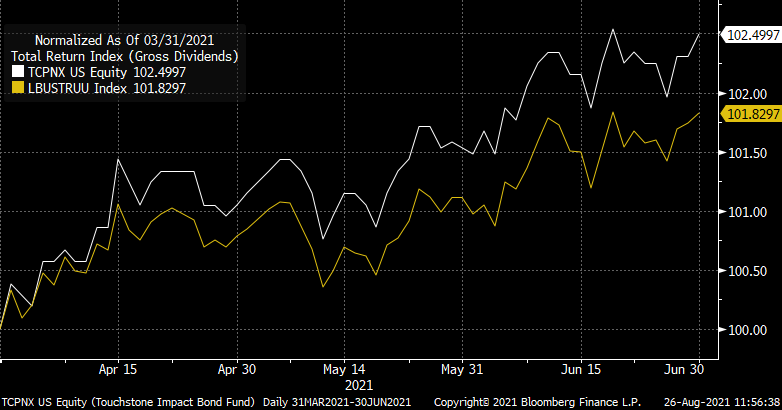
In the second quarter of 2021, TCPNX outperformed the benchmark (Barclays U.S. AGG) by 67bps primarily due to strong sector selection and allocation. The fund’s overweight to spread products, multi-family MBS, and U.S. agencies contributed to returns. A slight overweigh to credit also brought positive returns for the fund. The fund’s large underweight to U.S. Treasuries underperformed spread products, as did agency single-family MBS products, both greatly contributing to overall performance. Exposure to credit was mixed for the quarter. Higher-quality names acted as a headwind, yet historically volatile issuers in the credit space were a tailwind.


Q2 2021 Summary

  • TCPNX returned 2.50%, while the U.S. AGG returned 1.83%
  • Quarter-end effective duration for TCPNX was 6.40 and 6.58 for the U.S. AGG
  • Three largest contributors
    • Small Business Administration (SBA) Development Company Participation Certificates (DCPC), the transportation industry, and agency single-family MBS
  • The top detractors
    • Long BBB-rated credit. Oil Field Services companies, and CMBS


Optimistic Outlook

  • We continue to hold this fund and believe in our thesis due to the fund’s consistent and defensive approach that we expect to generate alpha through times of low volatility
  • Continue to maintain a duration neutral portfolio, with a focus on investment grade credit and Agency Single Family MBS debt as they are well pricedChart, line chartDescription automatically generated


[Category Mutual Fund Commentary]


Micah Weinstein

Research Analyst


Direct: 617.226.0032

Fax: 617.523.8118


Crestwood Advisors

One Liberty Square

Suite 500

Boston, MA 02109

www.crestwoodadvisors.com


WATFX – Q2 2021 Commentary

Western Asset Core Bond Fund Commentary – Q2 2021

Thesis

WATFX (currently yielding 1.55%) is an actively managed fund that finds overlooked areas of the market that can go against consensus views and add value. Through internal macro, credit, and fundamental research WATFX identifies undervalued securities and takes on more credit exposure to generate alpha over time. Through a diversified approach to interest rate duration, yield curve, sector allocation, and security selection, the fund dampens exposure to volatility.

A picture containing textDescription automatically generated


[more]


Overview

In the second quarter of 2021, WATFX outperformed the benchmark (Barclays U.S. AGG) by 36bps largely due to the fund’s duration and yield-curve positioning, as well as its investment-grade credit exposure. Spreads tightened in corporate credit and structured products which contributed to overall performance. In general, risk assets performed well for the quarter as inflation data came in surprisingly strong and the FOMC meeting in June resulted in rate hikes being pulled forward.


Q2 2021 Summary

  • WATFX returned 2.19%, while the U.S. AGG returned 1.83%
  • Quarter-end effective duration for WATFX was 7.10 and 6.58 for the U.S. AGG
  • Trimmed duration, agency MBS, and investment-grade and “plain-vanilla” high yield debt
  • Increased allocation to EM debt (US dollar-denominated corporate and sovereign bonds), reopening high-yield sectors, residential and commercial structured products, and banks loans


Outlook

  • We continue to hold this fund and believe in our thesis due to the fund’s diverse approach and strong top down-bottom up fundamental value investing over the long-term
  • Expecting global GDP growth to be strong, with higher inflation as the world economy continues to open
  • Spread products should benefit most from reopening
  • The fund is excited to seek out opportunities as spreads widen and the Fed continues to support corporate credit markets


ChartDescription automatically generated


[Category Mutual Fund Commentary]


Micah Weinstein

Research Analyst


Direct: 617.226.0032

Fax: 617.523.8118


Crestwood Advisors

One Liberty Square

Suite 500

Boston, MA 02109

www.crestwoodadvisors.com


MWTIX – Q2 2021 Commentary

MetWest Total Return Bond Fund Commentary – Q2 2021

Thesis

MWTIX (currently yielding 1.01%) is an actively managed fund that provides a sector-based strategy while still maintaining fundamental research driven through issue selection. When compared to the benchmark (Barclays U.S. AGG), the holdings have similar duration and exposure, yet selection is focused around areas where other managers are not looking. Through sector rotation and active weighting, we expect MWTIX to generate alpha over time.


[more]


Overview

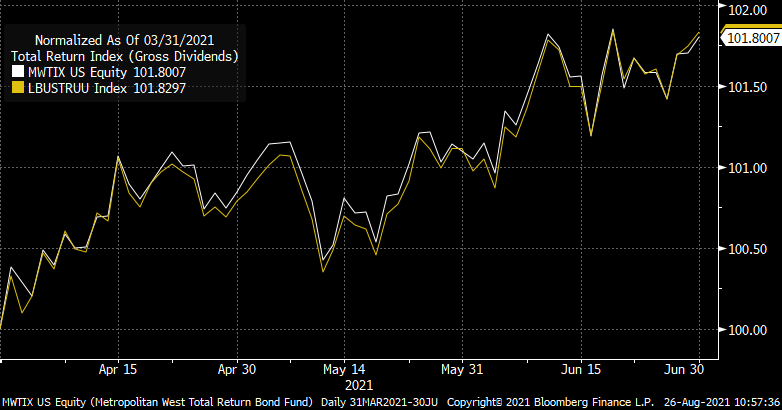
In the second quarter of 2021, MWTIX was roughly in line with the benchmark (Barclays U.S. AGG). The fund’s decision to shorten duration compared to the index modestly weighed on returns in the second quarter. Additionally, an underweight to corporate credit and overweight to residential agency MBS detracted from performance. However, strong issue selection within corporate credit helped offset some of the drag, specifically in non-cyclicals and communications. A small allocation to high yield debt and non-agency MBS contributed to returns. ABS and CMBS has little to no impact on overall performance.


Q2 2021 Summary

  • MWTIX returned 1.80%, while the U.S. AGG returned 1.83%
  • Quarter-end effective duration for MWTIX was 6.04 and 6.58 for the U.S. AGG
  • Strategy has returned to a more defensive and liquid one due to continued risks and uncertainty around COVID
    • Credit: moving to higher quality products, reducing tight commodity-exposed names/sectors, and swapping into shorter maturities


Outlook

  • We continue to hold this fund and believe in our thesis due to the fund’s defensive approach and minimal exposure to more vulnerable issuers and industries
  • Focus remains on sectors that offer stability and wider spreads
    • Securitized – agency MBS TBAs, legacy non-agency MBS, AAA-rated SASB (CMBS space)
      • Opportunities in AA- and A-rated SASB with good LTV (loan-to-value) ratios are becoming attractive
    • CLOs (attractive yields) and EM debt (cheaper entry point)
  • MWTIX has positioned itself to take advantage of relatively attractive prices during times of high volatility to generate strong returns


[Category Mutual Fund Commentary]


Micah Weinstein

Research Analyst


Direct: 617.226.0032

Fax: 617.523.8118


Crestwood Advisors

One Liberty Square

Suite 500

Boston, MA 02109

www.crestwoodadvisors.com


DBLTX – Q2 2021 Commentary

DoubleLine Total Return Bond Fund Commentary – Q2 2021

Thesis

DBLTX (currently yielding 3.13%) utilizes a top down-bottom up process that focuses on MBS and Agency bonds. When compared to the benchmark (Barclays U.S. AGG), the holdings have lower duration and exposure to corporate bonds, reducing their sensitivity to interest rate movements and credit spreads. We expect attractive risk-adjusted return characteristics over the long term from DBLTX, especially during periods when corporate bonds’ spread increase and the yield curve steepens.

Graphical user interfaceDescription automatically generated with medium confidence


[more]


Overview

In the second quarter of 2021, DBLTX underperformed the benchmark (Barclays U.S. AGG) by 24bps, largely due to two factors: duration positioning and asset allocation. The fund’s lower duration than the index, especially in the corporate bonds and U.S. Treasury space detracted from returns. All sectors in the fund generated positive returns, with non-agency CMBS contributing most to overall performance. Agency residential MBS also contributed to performance.


Q2 2021 Summary

  • DBLTX returned 1.59%, while the U.S. AGG returned 1.83%
  • Quarter-end effective duration for DBLTX was 4.22 and 6.58 for the U.S. AGG
  • The top two performers were non-Agency CMBS and Agency residential MBS
    • Increase in travel and leisure activity in the U.S. as well as duration-related price increases


Outlook

  • We continue to hold this fund due to the approach and strong diversification factor within our core bond holdings
  • DBLTX is a good position to hold due to its low duration which outperforms during periods of rising rates – Treasury yields were at all-time lows in 2020, increased during Q1 2021, but dropped again in Q2 2021
  • Historically, DBLTX has displayed stronger returns and lower volatility than the index
  • DBLTX has had consistent strategy, allocation focus, and sector distribution

Chart, line chartDescription automatically generated


[Category Mutual Fund Commentary]


Micah Weinstein

Research Analyst


Direct: 617.226.0032

Fax: 617.523.8118


Crestwood Advisors

One Liberty Square

Suite 500

Boston, MA 02109

www.crestwoodadvisors.com


CRM Earnings update

Current Price: $268          Price Target: $320

Position size: 2.5%           Return since inception (8/11): +11%


Key Points:

  • Beat expectations – Reported a top and bottom line beat. Revenues were $6.3B, up 23% YoY. Op margins expanded 20bps. Guiding to +24% FY21 revenue growth.
  • Attrition improved – was between 8% and 8.5%, an improvement from last quarter’s 9% to 9.5%.
  • More details on Slack strategy coming at Dreamforce/analyst day – “with Slack, we’re bringing a whole new dimension to salesforce.”
  • Setting the stage for margin expansion – mgmt. continually reiterated their focus on cost discipline and efficient growth.
  • Extremely positive demand commentary – saw strong demand across all of their products, regions and customer sizes. Sales cloud growth accelerated to 15% YoY, service cloud growth has accelerated to 23% and industry cloud growth was 58% (~$2B ARR, but an increasing part of the mix).
  • Contracted revenues underscore demand strength and provide visibilityRemaining performance obligation (RPOs), representing all future revenue under contract, ended Q2 at ~$36B, +18% YoY. And Current RPOs or cRPO (all future revenue under contract that is expected to be recognized as revenue in the next 12 months) was ~$18.7B, up 23% YoY.


  • Quotes from the call
    • “Our products are more relevant than ever. I have never seen this kind of momentum in the business. Honestly, that’s because CRM is more strategic now than it’s ever been. Every digital transformation begins and ends with a customer and that’s why around the world more and more companies are putting their trust in salesforce to help them get back to growth; that’s the agenda on every CEOs mind.”
    • “IDC just released their April 2021 SaaS vendor ratings that survey more than 2,000 companies worldwide and salesforce is rated #1 in trust, #1 in product, #1 in industry specialization, and #1 in value for the price.”
  • ESG comments…
    • They’ve progressed from being a “net zero company” to being “fully renewable.”
    • “A lot of the companies that I met with [recently] were mostly Fortune 100 CEOs, they crave to have that same net zero and renewable profile, which is very exciting to see the world having this kind of sustainability focus.”
    • Companies are using salesforce’s sustainability cloud to track their carbon footprint and other climate related initiatives.
  • Reasonable valuation & strong balance sheet
    • Expect CapEx to be ~3% of revenue in FY ’22 resulting in FCF growth of ~15% to 16% – excluding the anticipated impact of M&A, this would have be +22% to 23%.
    • Net leverage ratio <2x. During the quarter they issued $8 billion of senior notes (to fund Slack deal) with a weighted average interest rate of 2.25 % and weighted-average maturity of 20 years. Concurrent with that, S&P upgraded their credit rating to A+.
    • Trading at ~8x calendar ’22 revenue. Inexpensive given multiple secular tailwinds driving double-digit growth at scale for a high-quality, high moat company trading at a big discount to peers.


Investment Thesis:

  • Strong moat – dominant front office software that is mission critical and productivity enhancing to customers with high switching costs and an ecosystem advantage
  • Solid long-term secular growth drivers – digital transformation, multi-cloud, industry verticals and international expansion
  • Improving unit economics – growth strategy should yield higher quality (lower attrition) and higher recurring revenue cohorts which should improve margins over time and support their multiple
  • Reasonably valued – high quality franchise, growing double-digits and trading at a discount to peers


Sarah Kanwal

Equity Analyst, Director


Direct: 617.226.0022

Fax: 617.523.8118


Crestwood Advisors

One Liberty Square, Suite 500

Boston, MA 02109

www.crestwoodadvisors.com


Medtronic Q1 FY22 earnings summary

Key Takeaways:


Current Price: $134                             Price Target: $150 NEW (prior PT $124)   

Position Size: 2.66%                           TTM Performance: +28%


  • 1Q sales (ending July 2021) came at +19%, and +27% if adjusting for the extra selling week last year
  • Segment results:
    • Cardiovascular: +15% growth
      • The company gained 300bps market share in the Cardiac Rhythm Management market thanks to its Micra pacemaker
    • MedSurg: +25% growth
      • Continued global procedures recovery
      • Hugo robot : initial urology cases performed in Latin America, supporting regulatory approvals globally (US trials starting soon, CE Mark pending)
    • Neuroscience: +26% growth
      • Capital equipment business is doing well, a sign that hospital capex spending continues to recover
    • Diabetes: sales down 3%
      • Delay in new pump launch in the US
      • Has lost market share in that category in past years as competitors introduced new products, innovation should help going forward
  • Delta variant expected to have a slight negative impact on business, explaining the small change in guidance.
    • Covid had an impact on August numbers so far, and the trend should persist into September
    • Expecting peak in hospitalizations form covid in September, then easing in October with vaccinations peaking back up
  • Operating margin came ahead of expectations at 28.3%, ahead of its guidance of 27-27.5% – but ramping up on investments in renal denervation and Hugo robot will be a ~$400M headwind this year
  • The management team is raising the lower end of its EPS full-year guidance from $5.60 – $5.75 to $5.65 – $5.75. Organic revenue growth guidance remains +9%
    • Cardio: 10-11%
    • Med Surg: 8-9%
    • Neuroscience 10-11%
    • Diabetes flat
  • Medtronic will hold its first ESG Analyst Day in October, a first for the company


MDT Thesis:

  • Stands to benefit from secular trends (1) increased utilization from Obamacare (2) developed populations age
  • Strong balance sheet and cash flows. Increased access to non-cash should allow MDT to meaningfully increase their dividend
  • 6% normalized Real Cash yield provides solid total return profile over next 2-3 years
  • Ownership interest aligned. Management incentivized to maximize shareholder returns – 14% 10yr average ROIC

Category: Equity Earnings


Tag: MDT


$MDT.US


Julie S. Praline

Director, Equity Analyst


Direct: 617.226.0025

Fax: 617.523.8118


Crestwood Advisors

One Liberty Square

Suite 500

Boston, MA 02109


www.crestwoodadvisors.com


CSCO Q4 2021 Results

Current Price: $57                           Price Target: $62 (raising from $58) 

Position size: 3.2%                          TTM Performance: +35%


Key Takeaways:

  • Beat expectations on broad based demand growth – driving a top line and EPS beat, aided by gross margins up 60bps.
  • Short-term headwind from supply chain delays and chip shortages – this caused FY22 guidance to be lower than expected. Revenue guidance of 5-7% for FY22 assumes a deceleration from current quarter trends of +7.5%-9.5% due to these temporary headwinds which should last for at least 1H22. They’re taking price increases to offset impact to margins.
  • Secular drivers ramping – they are benefiting from digital transformation w/ the ramping of associated key technology transitions (Wifi 6, 5G, 400 gig, edge) that are catalysts to companies modernizing their aging network infrastructure. They’ve been investing behind these big market transitions for a long-time, they’re finally starting to come to life and will be long-term growth drivers for their business.
  • Mix shift to software and recurring revenue continues – subscription revenue was +15% YoY for the full year, as an increasing number of their products are to be offered this way. They now have one of the largest software businesses in the industry with an annual run rate well over $15B (~$13B of that is subscription). 


Additional Highlights:  

  • Revenue was $13.1 billion, up 8% YoY, coming in at the high end of their guidance range.
  • Strongest product order growth in a decade – +31% YoY (up 17% from pre-COVID Q4 levels in FY 2019) driven by strength across all of their end markets
  • Analyst Day in September may be a positive catalyst
  • Quotes from the call…
    • On supply chain issues: “While we are seeing increasing demand for our technology, we are also continuing to manage through the component shortage challenges that nearly every company is experiencing. Our world-class supply chain team as always, is doing an incredible job navigating this complex situation by working with our global suppliers to meet customer demand as quickly as possible. Looking ahead, we expect the supply challenges and cost impacts to continue through at least the first half of our fiscal year and potentially into the second half.”
    • On IT budgets: We are seeing IT budgets grow as companies begin to implement their critical future plans and business confidence increases.”
    • On broad demand strength: “We saw double-digit growth in every one of our customer segments. This strength is being driven by stronger customer investment in substantial network upgrades to help modernize and secure their environments to support the new way of working.”
    • On growth investments: “You will see us continue to invest in our key growth areas in technology shifts like hybrid cloud, hybrid work, 5G, Wi-Fi 6, edge and security”…”given the momentum we’re seeing in our business, we have more conviction than ever that we are investing in the right areas and we’ll continue to extend our competitive advantages and drive growth.”

  • Growing mix of recurring revenue should expand their multiple –Software mix is close to 1/3 of revenue w/ >80% of software sold as subscription. That means over 1/4 of total sales is from software subscriptions sales (or ~$14B). Additionally, ~22% of rev is services with much of that from maintenance/support which tend to be recurring. So overall recurring revenue could be ~45% or more (they don’t break it out specifically). They have a growing “as-a-service” portfolio driving the mix shift happening w/in their business which should be supportive of their multiple and their margins. They continue to offer more products this way including Cisco Plus their new network -as-a-service offering.
  • Momentum w/ web-scale cloud providers –commentary continues to be very positive. This is an important area of growth for them. They had record performance with over 160% order growth – seeing early traction of their 400-gig solutions, a huge testament to the investments they’ve made. This is an end market where they lost share to Arista in the past, but their positioning is improving w/ new products launched last year. That being said, this is still early stages – mgmt. indicated it may take a year or two for this to be a meaningful top line contributor. Could see performance vary quarter to quarter, due to the timing of large deals, but they are “incredibly confident” around their prospects in this area. Recently extended their webscale product offering – broadened their Silicon One platform from a routing focused solution to one which addresses the webscale switching market, offering the highest performance, programmable routing and switching silicon on the market.
  • During Q4, closed five acquisitions, Kenna Security, Socio Labs, Slido, Sedona Systems and Involvio – consistent w/ strategy of complementing R&D with targeted M&A to strengthen their market position growth areas.
  • Valuation: trading at a 6.5% FCF yield on fiscal 2022, which ends in July. This is well below S&P average of <4%, for a strong balance sheet, high FCF generative business (~30% FCF margins) w/ a growing mix of software and recurring revenue. Fundamentals continue to be supported by business transformation/digitization trends (which are accelerating) at a reasonable valuation while much else in tech has seen substantial multiple expansion. Additionally, their valuation is supported by a 2.6% dividend yield which they easily cover. They grew their dividend for the 10th consecutive year and are committed to returning 50% of FCF annually to shareholder through dividends and buybacks. They have ~$13B in net cash on their balance sheet, or >5% of their market cap.


Sarah Kanwal

Equity Analyst, Director


Direct: 617.226.0022

Fax: 617.523.8118


Crestwood Advisors

One Liberty Square, Suite 500

Boston, MA 02109

www.crestwoodadvisors.com


$CSCO.US

[category earnings ]

[tag CSCO]

TJX Q2 Results

Current Price:   $73                        Price Target: $83 (raising from $75)

Position Size:    3.7%                      TTM Performance: 31%


Key takeaways:

  • Better than expected SSS drove revenue and EPS beat. “Open-only” SSS were +20%. These open-only comp store sales compare FY22 sales (this fiscal yr.) to FY20 sales (calendar 2019).
  • Positive margin commentary – Freight and wage pressure is being more than offset by higher merchandise margin (driven by strong inventory availability, rebounding sales and category mix shift). When freight pressures abate, margins will expand.
  • Launching HomeGoods e-commerce site next quarter – overall, Home continues to be their strongest category/segment
  • Apparel continues to rebound– this is a strong driver of SSS as apparel & footwear are about half of sales
  • Seeing extremely plentiful inventory buying opportunities which bodes well for the future.
  • International still weighed down by store closures – Canada, Europe and Australia each faced challenges with temporary store closures and occupancy restrictions


Additional Highlights:


Quotes from the call…

  • Gaining share: “This presents an unusual opportunity for us to continue to gain more market share because of our branded content being really second to none.”
  • Inflation benefit: “we are convinced that our relentless focus on value is a tremendous advantage. In an inflationary environment we believe even more consumers will be seeking out value. We are confident that our value position will be a very attractive option for consumers looking to stretch their dollars without sacrificing on quality and brands.”
  • Strong demand trends: “we continued to see an increase in our average of basket across all divisions, driven by customers putting more items into their carts.”
  • On inventory availability: “Our buyers are doing a great job sourcing merchandise and have been able to chase the goods we need to satisfy the current strong consumer demand. To reiterate, the availability of merchandise is excellent.”
  • On their moat: “We’ve spent decades establishing relationships with vendors and landlords, and building out our global buying offices, distribution network, systems and infrastructure. Further, we have expansive country-specific knowledge of consumer shopping habits, and have earned customer loyalty. We believe our well established global off-price retail model and level of international expertise is our tremendous advantage and our size and scale would be very difficult to replicate.”
  • Sales are tracking ahead of pre-pandemic levels…
    • Overall sales were $12.1B, over $2 billion more than the same quarter pre-pandemic. That includes $300-$350 million headwind due to temporary store closures during the quarter.
    • Open-only comp sales vs pre-pandemic (fiscal 2020 but calendar 2019)
      • Overall: +20%
      • Marmaxx U.S. +18%
      • HomeGoods U.S. +36%
      • Canada +18%
      • International +12%
  • Higher merchandise margins continue to mitigate covid costs, higher wages and higher freight–They expect freight to likely persist for the remainder of the year. HomeGoods margin is disproportionately impacted by freight increases due to its product mix.
  • Real estate and market share opportunity w/ retail store closures – better locations and lower rents. “Our relationships with vendors will grow even stronger as other retailers close stores.”
  • Long-term thesis intact – Relative to other brick-and-mortar focused retailers, TJX  continues to have a superior and very differentiated model. They acquire their inventory from an enormous (and growing) network of vendors, acting like a clearing mechanism for the retail industry…essentially opportunistically buying leftover/extra product that constantly flows from retailers, branded apparel companies etc. Growth of e-commerce has led to better inventory opportunities/ selection, not worse. They leverage their massive store footprint and centralized buying to merchandise their stores and e-commerce sites w/ current on-trend product. No one else does this at the scale they do. They have very quick inventory turns and can be nimble and re-active w/ their inventory buys and are an important partner to their sources of inventory. It’s a powerful model that continues to take share and, while they have a growing e-commerce business too, their store model has been very resistant to e-commerce encroachment. Moreover, they have a thriving Home business, a growing e-commerce presence, an expanding international store footprint and a track record of steadily positive SSS. Prior to last year, in their 44 year history they only had 1 year of negative SSS (this is unheard of!). So, with steadily positive SSS, a slowly growing store footprint and an emerging e-commerce business, TJX steadily grows their topline w/ consistent margins that are about double that of department stores.
  • Valuation: Balance sheet continues to improve (reduced outstanding debt by $2.75B this year and lowered interest expense by >$90m), they’ve returned to their capital allocation program w/ dividend and buybacks. The valuation is reasonable at ~3.5% FCF yield on next yr.


Sarah Kanwal

Equity Analyst, Director


Direct: 617.226.0022

Fax: 617.523.8118


Crestwood Advisors

One Liberty Square, Suite 500

Boston, MA 02109

www.crestwoodadvisors.com


$TJX.US

[tag TJX]

[category earnings]


Home Depot Q2 Earnings

Current Price: $320                     Target Price: $340

Position size: >2%                        Performance since inception: +57% (4/16/20)


Key Takeaways:


  • Comparable store sales were 4.5% (a big deceleration from +31% last quarter) as they lap the pandemic home improvement spending surge from last year and as the benefit of stimulus checks wane. E-commerce (mid-teens % of sales) were flat YoY as they lapped 100% growth last year.
  • Talk of “peak growth” not concerning  – despite slowing SSS, multiple secular tailwinds persist.
  • Pro sales growth now outpacing DIY as consumers resume large projects and return to pre-pandemic activities. 
  • Still not giving guidance
  • Quote from the call…”“We are at a point now where the housing stock of the United States is over 20% more valuable than it was two years ago….and so as we look forward, not only have we seen that home price appreciation….but the homeowner balance sheet is incredibly healthy, the state of mortgage-finance is incredibly healthy, and so that’s some of the reasons why we’re optimistic.”


Additional Highlights:

  • Talk of “peak growth” not concerning
    • Growth rate slowing doesn’t mean the business is shrinking or that the multiple will contract. While the rate of growth (after this extraordinary year!) will clearly slow, their business will continue to grow over time. Their long-term opportunity is to continue to consolidate a fragmented market in home improvement w/ DIY & Pro, grow their more nascent MRO business (particularly after HD Supply acquisition) and leverage their best of breed omni-channel model.
  • Secular tailwinds persist…more homes need to be built. This should be a LT secular driver for HD.
    • Undersupply of homes continues to support pricing and years of underbuilding has shifted the age of the existing US housing stock – both of which support home improvement spending.  
    • According to a recent study by the National Association of Realtors, due to years of underbuilding, the US is short 6.8 million homes.
    • Building would need to accelerate to a pace that is well above the current trend…. To more than 2 million housing units per year vs a ~1.6m annual rate for starts.
    • From the NAR report released in June…“Following decades of underbuilding and underinvestment, the state of America’s housing stock, which is among the most critical pieces of our national infrastructure, is dire, with a chronic shortage of affordable and available homes to house the nation’s population. The housing stock around the nation has been widely neglected, with a severe lack of new construction and prolonged underinvestment leading to an acute shortage of available housing, an ever-worsening affordability crisis and an existing housing stock that is aging and increasingly in need of repair.”
  • Higher inflation –they can pass through pricing, inflation is a tailwind to SSS which drives some operating leverage
  • Best of breed omni-channel model drives productivity 
    • By adding specialized warehouse capacity and enhancing digital capabilities (online and in the store), HD is uniquely positioned to leverage their existing retail footprint (not really growing stores) and drive steadily high ROIC that is ~45% (which is incredible).
    • They dominate the category, are the low cost provider, have a relentless focus on productivity and can continue to flow an increasing amount of goods through their big box stores w/ omni-channel. This is a highly efficient model as 55% of online sales are picked up in-store which HD can fulfill from the store or nearby warehouses.
    • Their express car and van delivery service covers over 70% of the U.S. population w/ coverage continuing to improve.

·        Capital allocation: they’ve resumed share repurchases and remain committed to growing their dividend over time

·        Valuation: Strong balance sheet, benefiting from strong housing trends but also has defensive qualities and a reasonable valuation, trading at ~4.6% forward FCF yield.


Sarah Kanwal

Equity Analyst, Director


Direct: 617.226.0022

Fax: 617.523.8118


Crestwood Advisors

One Liberty Square, Suite 500

Boston, MA 02109

www.crestwoodadvisors.com


$HD.US

[tag HD]

[category earnings]


Disney Q3 earnings

Current Price: $185     Price Target: $215

Position size: 2%          TTM Performance: +35%   


 Key Takeaways:

  • Better than expected Disney+ subscriber numbers – after slightly weaker than expected subs last month, they reported a small beat this quarter. In general, Disney+ has been ramping far ahead of initial expectations. However, still no change to breakeven guidance for their DTC platform, as they increase investment on content.
  • Strong Parks results – parks segment returned to profitability
  • Seeing success w/ hybrid film releases – flexible distribution strategy of being able to release content in both theaters and direct to Disney+ is an advantage
  • Capital return still paused – Still not paying a dividend or buying back shares, but they do expect to return to both.


Additional highlights:

  • Quotes from the call…
    • “we will maximize the synergy of our unique ecosystem to further deepen consumers connection to our characters and stories. And we will use the power of our far-reaching platforms and emerging technologies to better anticipate what our consumers want and deliver them a more seamless and more personalized entertainment experience.”
    • “Last month, we completed our first cruise since the start of the pandemic with the Disney Magic, which is currently sailing short-term staycations for U.K. residents, and a Disney Dream set sail on its first U.S. based cruise this week. Future bookings for all of our ships remain strong with bookings in the third quarter, in particular, having benefited from the announcement of our fall 2022 itineraries and the successful marketing launch of our fifth ship, the Disney Wish, which will set sail in summer of 2022.”
  • They now have 174M subs across Disney+, Hulu and EPSN+. That is second only to Netflix, which has a little over 200M. Disney+ now has 116M subs, Hulu is ~43M and ESPN has ~15M. Goal is 230-260m Disney+ subs by 2024.
  • Global rollout will continue to support sub growth – Disney+ is available in a limited capacity in Japan, expanding to the full market in late October, followed by additional APAC markets, including South Korea, Taiwan and Hong Kong in mid-November. Launch of Disney+ in Eastern Europe has moved from late 2021 to the summer of 2022, primarily to allow for an expanded footprint that will include parts of the Middle East and South Africa.
  • ARPU should steadily rise over time – overall ARPU this quarter was $4.16 (ex-Hotstar, it was $6.12). Their ARPU is weighed down by lower Disney+ fees outside the US, but they will gradually raise prices over time and they have ways (other than sub fees) to make money off of their content w/ advertising, parks and consumer products (especially w/ content like Pixar, marvel, star wars).
  • Flexibility is a key component of their distribution strategy. They have 3 approaches for distributing films. 1) Release in theaters with a simultaneous offering via Disney+ Premier Access, 2) release straight to Disney+, and 3) traditional exclusive theatrical releases. Hybrid releases mitigated the impact of theater closures, but theaters are re-opening and they intend to continue to use this model.  
  • Improving parks and lots of content on the horizon bodes well for future results…
    • Content updates…
    • Park re-openings…everything is open. Generally operating at or near current capacity limits w/ robust guest spending trends and strong reservations.


Sarah Kanwal

Equity Analyst, Director


Direct: 617.226.0022

Fax: 617.523.8118


Crestwood Advisors

One Liberty Square, Suite 500

Boston, MA 02109

www.crestwoodadvisors.com


$DIS.US

[category earnings ]

[tag DIS]