CCI Q4 Results

Current price: $180         Target price: $201

Position size: 2.1%           TTM Performance: 12%


Key takeaways:

·         Reported results that beat expectations, issued strong guidance and gave very positive commentary around long-term outlook as customers began upgrading their existing cell sites as part of the first phase of the 5G build out in the U.S.

  • Saw strong AFFO/share growth of 14% and guided to FY22 AFFO/share growth of 6%, which is in-line with their long-term target.
  • Inflection point in new small cells and overall business – The highest level of tower application volume in history and strong demand for small cells during FY21 is a strong tailwind in driving long-term revenue growth.
  • Dividend raised 11%. Well ahead of long-term dividend growth target 7% to 8% target as they are growing the dividend in line with AFFO/share growth.


 Additional highlights:

  • Quotes from the call:


  • “We expect elevated levels of tower leasing to continue this year and believe we will once again lead the industry with the highest U.S. tower revenue growth in 2022.”
  • I believe our strategy capabilities and unmatched portfolio of more than 40,000 towers and more than 80,000 route miles of fiber concentrated in the top US markets put Crown Castle in the best position to capitalize on the current environment and to grow our cash flows and our dividends per share both in the near term and for years to come.”
  • Quotes from the call (when answering a question around carrier implications going into FY22 and its impact on CCI): “I can’t think of another time in history of our business where we’ve had four well capitalized carriers [AT&T, Verizon, T-Mobile, and Dish] with spectrum and the desire to deploy network.”
  • Seeing record tower growth now; small cell growth will be longer term driver
    • Customers upgrading existing tower sites as a part of their first phase of 5G build-out.
      • Mid-band (C-band) and high-band (mmWave) spectrum are both are relevant for 5G and will drive lease up activity for CCI.
      • Carrier spend is currently focused on deploying mid-band spectrum as this is the first stage of 5G deployment and is often referred to as the “goldilocks” band as it is an ideal balance between bandwidth and propagation (i.e. its ability to carry more data and travel far distances). It can be deployed via towers and small cell, but towers remain the most cost-effective way for carriers to deploy spectrum at scale and establish broad network coverage.
      • Carriers just spent a ton (~$90B) at the recent C-band spectrum auctions… and now they’re focused on deploying it.
      • This near-term carrier focus is on C-Band deployment is stalling small cell deployment growth. C-band spectrum sits next to the spectrum used by air traffic control and is the tied to the FAA concerns in the news. On the call related to this they said, “There has not been any change in their behavior with our customers and we don’t expect there to be any impact to our 2022 outlook.”
    • Small cells are the next stage…
      • High-band (mmWave) spectrum is the next stage and is relevant for what’s often called the “real 5G” which would deliver on the huge gains in performance that 5G promises (step function increase in latency and bandwidth). It has significantly more capacity, but over a fraction of the geographic coverage area (lower propagation) which is why it needs to be deployed using small cells connected to fiber, making it ideal for dense urban areas. This densification is a driver of additional leasing as it’s a critical tool for carriers to accommodate continued growth in mobile data demand b/c it enables carriers to get the most out of spectrum assets by reusing it over shorter and shorter distances.
      • Growth in small cells should drive improving returns as they expect decreasing capital intensity for growth within their small cell and fiber business. With small cells there are “anchor nodes” and “colocation nodes” – the first “anchor” nodes are a lower ROI and additional nodes on existing infrastructure have higher incremental margins. So as lease-up activity continues, their ROI improves.
      • Small cell business is indeed picking up – this is key to the long-term thesis:  the CEO said they are “seeing an inflection in our small cells business” as customers are ” planning for the next phase of the 5G build out” for what they “expect will be a decade-long investment cycle as our customers develop next-generation wireless networks.” They small cell commitments they’ve secured in the last 12 months equate to 70% of the total small cells they’ve booked in their history prior to 2021.
  • Balance sheet strength – They continue to methodically reduced the risk profile of their balance sheet. Since they achieved their initial investment grade credit rating over 5 yrs. ago, they have increased average debt maturity from 5 yrs. to >9yrs, reduced average borrowing costs to 3.1% from 3.8% and increased the mix of fixed-rate debt to > 90% from < 70% w/ no meaningful near term debt maturities. So limited near term exposure to rising rates.
  • Sustainability/ESG considerations…
    • Continue to aim for their goal of carbon neutrality by 2025 for Scope 1 and 2 emissions.
    • With labor shortages and rising prices, they have continued to make an effort to provide value and opportunity for their carriers: “…we’re happy to provide the capital at a much lower cost than what the markets can provide them capital because of the opportunity that we have to see returns from multiple operators across that same asset.”
    • Their solutions also help address societal challenges like the digital divide in under-served communities by advancing access to education and technology. “To date, we have invested nearly $10 billion in towers, small cells and fiber assets located in low income areas.”
    • Enhanced focus on ESG may drive increased revenue opportunities from things like smart cities and “broadband for all” and lower operating costs in areas like tower lighting and electric vehicles.
  • Reasonably valued – trading at >4% 2022 AFFO yield. With LT AFFO/share growth of 7-8% and >3% dividend yield, they should compound total returns low double-digits over a long period of time as demand for their shared infrastructure offering is tied to robust mobile data growth (~30% annually).


Micah Weinstein

Research Analyst


Direct: 617.226.0032

Fax: 617.523.8118


Crestwood Advisors

One Liberty Square

Suite 500

Boston, MA 02109

www.crestwoodadvisors.com


SHW Q4 2021 Earnings

Current price: $285         Price target: $330

Position size: 3.65%        TTM Performance: 23%


Key Takeaways:

  • Results being weighed on by supply chain constraints – Q4 sales in-line with expectations but earnings fell short. Positive demand commentary. Second half weighted outlook for FY22 due to near term headwinds.
  • They will benefit from strong demand trends, pricing actions and improving margins when current headwinds recede – Raw material availability, Omicron variant, inflation pressures, and supply chain constraints meaningfully impacted revenue growth and margins across all segments. Strong consumer demand, increase in volume, and pricing action will address these concerns and help push the company past these short-term headwinds. Management sees raw material supply issues receding in FY22 which will help drive growth and margins back to historical levels. A moderation in commodity prices will also help fundamentals recover.
  • Quotes from the call
    • Raw material availability remained a challenge. There was some improvement, but recovery was not as quick as we would have liked. Commodity and other costs remained elevated and we continue to implement price increases. The new wrinkle was the impact of the Omicron variant which was meaningful.”
    • We see an operating environment with strong demand across architectural and industrial end-markets.”
    • “Our outlook also assumes that the market rate of inflation for our raw material basket will be up by a low double-digit to mid-teens percentage in 2022 compared to 2021″
    • “We expect to open between 80 and 100 new stores in the U.S. and in Canada in 2022. We’ll be focused on sales reps, capacity and productivity improvements, systems as well as product innovation.”


Additional Highlights:

  • Revenue and margin headwinds will subside later in 2022…
    • Disruptions are acting as a short-term headwind – Natural disasters (winter storm Uri and Hurricane Ida) destroyed the industry’s raw material supply chain, which led to poor availability and unprecedented cost inflation due to high demand. Labor and transportation costs also became elevated throughout the year. Lastly, the new COVID variant (Omicron) added to operational complications.
    • They’re taking action (all of which is aided by their scale & pricing power) – continued price increases, vertical acquisition (specialty polymers) that will aid supply, and they continue to invest in growth initiatives – they have significant production capacity available today and are bringing 50 million gallons of incremental architectural production capacity. “We’re leveraging all of our assets, including our store platform, our fleet, our distribution centers and more, to let us come up with unique and creative customer solutions that others simply can’t.”
    • Gross Margins will improve – w/ price increases, higher volumes and falling inflation through FY22. “We expect to see year-over-year inflation in all four quarters with the largest impacts likely occurring in the first quarter in gradual reductions each quarter as the year progresses.”
  • America’s Group ($3B), +3.0%:
    • A decrease in segment margin was caused by lower sales volume and higher raw materials costs, but were slightly offset by selling prices increases.
    • 35 net new stores opened in Q4 2021, and they are expecting to open an additional 80-100 new stores in 2022 (U.S. and Canada, specifically).
  • Consumer Brands Group ($647m), -7.8%:
    • The Wattyl divestiture played a material part in this – when adjusted for this, sales growth was flat.
    • A decrease in segment margin was caused by lower sales volume, higher raw material costs, and supply chain inefficiencies detracted, but were partially offset by good cost control and increases in selling price.
  • The Performance Coatings Group ($1.5B), +18.7%:
    • Strong growth driven mainly by price and volume increases.
    • Segment margin decreased largely due to increasing raw material costs (inflation was the highest for this segment), but somewhat offset by strong operating leverage from higher volume, selling price increases, and good cost control.
  • FY Guidance: expect high single-digits to low double-digit percentage sales increase – heavily weighted in the second half of FY22.
    • TAG: up mid-to-high sing-digit percentage.
    • CBG: down mid-teens percentage – includes negative 4% related to Wattyl divestiture.
    • PCG: up low-to-mid single-digit percentage.
    • Expecting continued margin headwinds, especially in the first half of FY22, but a recovery in the second half of FY22 across all segments.
      • “…’10, ’11, ’12, we saw that big run up in titanium dioxide, we saw our margins get to contract and then we saw growth from ’13 to ’16 of almost 600 basis points. We expect to see a similar environment today.”
  • Strong macro indicators that point to strong recovery for the company and overall industry
      • Near record highs for the Remodeling Market Index
      • Strong LIRA (leading indicator of remodeling activity)
      • Large backlog of entry level and luxury homes
      • Strong momentum in the Architectural Billings Index and Dodge Momentum Index
    • Continued choppiness for raw material availability, especially in the first quarter of FY22.
  • Balance sheet remains strong – leverage ratio is between 2-2.5x. Debt is 92% fixed rate.
  • Strong history of returning capital to shareholders continues – In 2021, they increased their dividend over 20%, marking the 43rd consecutive year they increased their dividend.
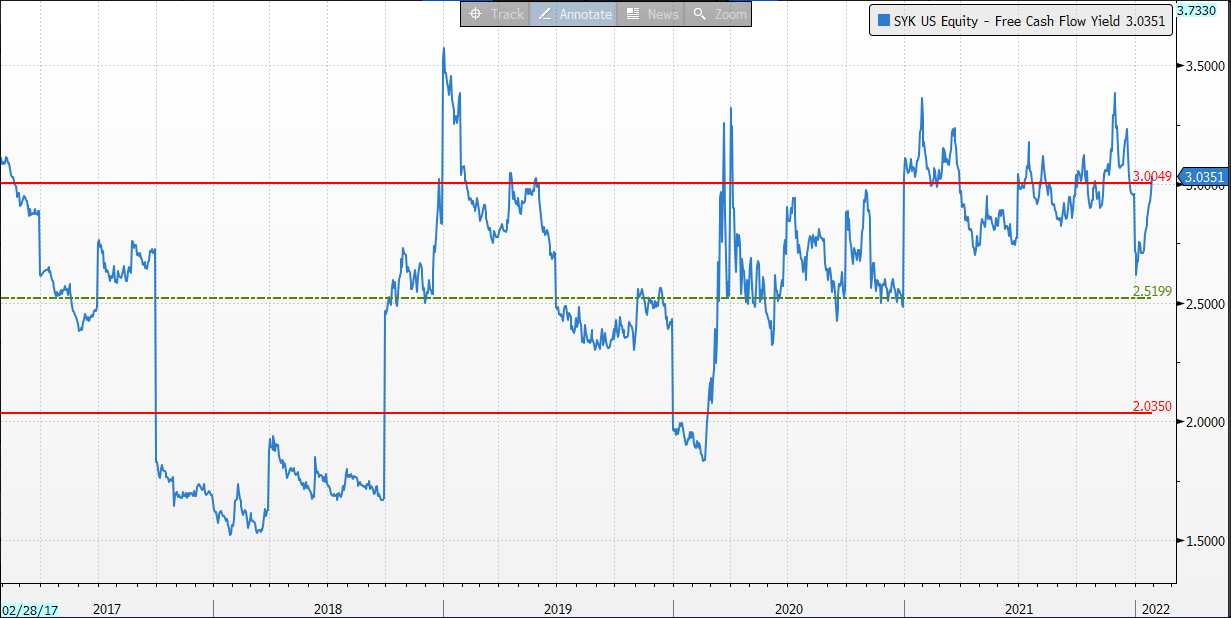
  • Valuation – trading at ~3.1% forward FCF yield; inflation is negatively impacting margins and working capital.


Apple Q1 Earnings


Current Price: $170                                                    Price Target: $185

Position Size: 7.85%                                                        TTM Performance: +29%


Key Takeaways:


  • Solid revenue beat as supply chain problems were less severe than expected. Semi shortages and Covid related manufacturing disruptions impacted Q1 by $6B less than the $10B expected.  
  • iPads were the weakest product as they were hardest by shortages – this was consistent w/ the guidance they gave last quarter
  • Gross margins well ahead of guidance – 43.8% up 160 basis points quarter due to volume leverage and favorable mix partially offset by higher cost structures. Guidance was for 41.5 to 42.5% (up from <40% in 2020).
  • China continues to be strong – +21% YoY growth, significantly growing the installed base.
  • Guidance – Expect to achieve solid year-over-year revenue growth and set a March quarter revenue record despite significant supply constraints. Supply constraints will be a smaller impact in Q2 than in Q1 (December quarter). They expect Services growth to decelerate as they lap tough compares.


Additional highlights:


  • Seeing record demand – Q1 revenue was $124B, +11%, reached new all-time records in the Americas, Europe, Greater China, and the rest of Asia-Pacific and it was also an all-time record quarter for both products and services. They saw growth across every product category except iPad (due to supply chain issues)
  • Segments:
    • iPhone – revenue 58% of revenue, grew +9.2% YoY, well ahead of estimates. The iPhone 13 family continues to be in very high demand. Installed base is >1 billion devices.
    • Mac –  Revenues were up +25% YoY despite supply constraints. All-time record and the last 6 quarters for Mac have been its best four quarters ever.
    • iPad – revenue was down -14% YoY due to significant supply constraints
    • Wearables – revs were +13% YoY. Apple watch installed base continues to expand as more than 2/3 of Apple Watch buyers in the quarter were new to the product.
    • Strong Services growth driven by growing installed base which hit a record of 1.8B
      • Revenue +24% YoY; set a new all-time revenue record ($19.5B).
      • Now at 785m subs, added 40m from Q4; and up 165m from last yr. and 5x the number of subs they had less than  5yrs. ago.
  • 5G upgrade cycle – only in the early innings of 5G. If you look at their 5G penetration around the world, there is only a couple of countries that are in the double digits yet.
  • Why we still like
    • Big moat underpinned by growing installed base which drives their virtuous cycle.. More users of their devices lures developers to create better apps which lures more users. This is key to their LT growth. Apple continues to significantly expand their installed base. And they have multiple new products being launched and more in the pipeline (e.g. AR glasses, Apple car) that could be key drivers of LT growth….and, importantly, a growing services business tied to all these products. Part of what differentiates Apple is they design their own silicon for the processor chips that are the brains of their iPhones and iPads and now their Macs, which gives them better control over performance and feature integration in their devices. This has proven to give them an advantage with the way they design their products and an advantage with developers. So, now they have Macs, iPhones and iPads running the same underlying technology which should make it easier for Apple to unify its apps ecosystem, including allowing iPhone and iPad apps to run on Macs. This advantage and the relevance of their ecosystem gets more and more important as computing power in phones increases, 5G delivers better connectivity and, as a result, we have the ability to use their devices in enhanced ways (w/ increased revenue opportunities) ….like apps that take advantage of augmented reality and IoT related technologies.
    • Reasonable valuation…
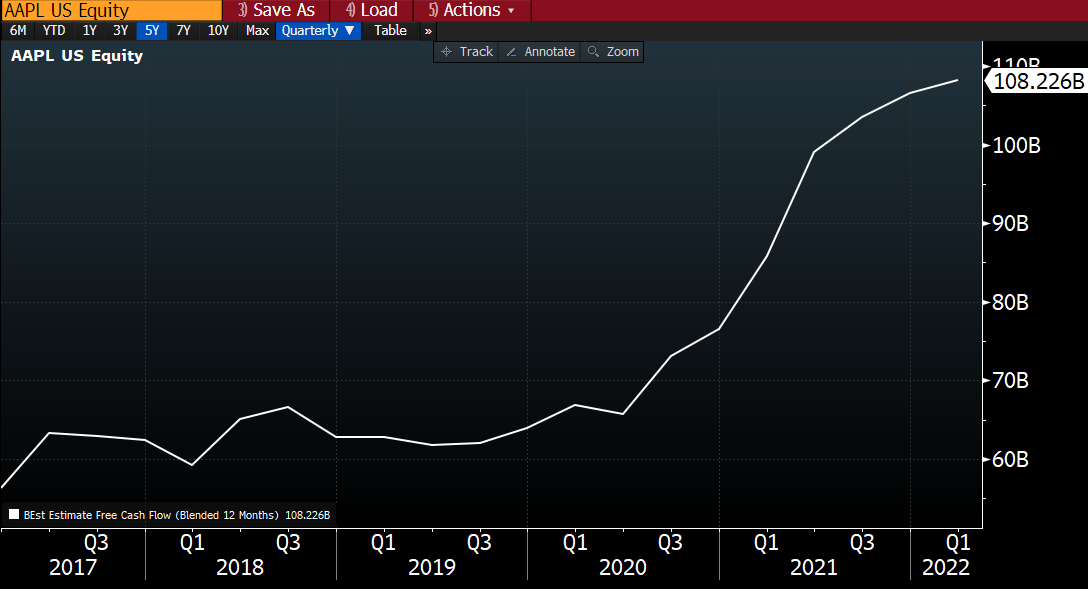
      • Trading at ~4% FCF yield on 2022 (a small premium to the S&P) and a 0.5% dividend yield w/ another almost 3% of their market cap ($80B) in net cash on their balance sheet.
      • For reference, pre-pandemic in Jan 2020, Apple was trading at ~4.7% FCF yield and 1% dividend yield with ~7% of their market cap in net cash.
      • Their market cap has been tracking their massive increase in FCF estimates. FCF this year should be ~80% higher than pre-pandemic fiscal 2019
      • Huge amount of cash on their balance sheet w/ years of buybacks to support valuation
        • Capital returns may need to expand further to hit their net-cash-neutral target in a few years. 
        • With current net cash of ~$80B and expectations of over $460B of FCF over the next 4 years, shareholder returns could be over $500B or almost 20% of their current market cap.
        • They’ve returned >$550B since 2012. So, from 2012 to 2026, they may return >$1T.


$AAPL.US

[category earnings]

[tag AAPL]


Sarah Kanwal

Equity Analyst, Director


Direct: 617.226.0022

Fax: 617.523.8118


Crestwood Advisors

One Liberty Square, Suite 500

Boston, MA 02109

www.crestwoodadvisors.com


Resmed 2Q22 results

Key Takeaways:


Current price: $214                     Price target: $322  

Position size: 2.65%                    1-year performance: +4%


  • Revenue growth of +13% y/y ex-FX, sales missed expectations. Investors believed RMD could capture more sales from its competitor Phillips product recall but faced components & freight challenges, missing some sales this quarter. We should see some of that to come in the coming quarters, supporting additional top line growth.
    • Devices sales +16%
    • Masks segment +10%
    • Software-as-a-service business grew 8%
    • The company was able to capture some market share from the Phillips products recall, which is expected to continue for the next 12 months.
  • The digital offering provides some stickiness to new clients won from competitor.
  • Gross margin impacted by higher freight and manufacturing costs, down -230bps y/y
  • Adjusted EPS up +4%
  • We still see long-term thesis in place for this name, with potential to accrue more sales in the coming quarters as supply chain challenges improve, and new clients from competitors start their re-supply of masks and tubes.
  • While valuation is not the most attractive, RMD can surprise to the upside with new product introduction and room for tuck-in M&A (balance sheet leverage has gone down and opens the door for additional deals).


Thesis on RMD:

  • Leading position in the underpenetrated sleep apnea space
  • Duopoly market
  • New product cycle
  • Returns of capital to increase: ~1% share buyback/year (back in FY18), dividend yield of 2%


$RMD.US

[category earnings] [category equity research] [tag RMD]


Julie S. Praline

Director, Equity Analyst


Direct: 617.226.0025

Fax: 617.523.8118


Crestwood Advisors

One Liberty Square

Suite 500

Boston, MA 02109
 

www.crestwoodadvisors.com


Stryker 4Q21 earnings summary

Key Takeaways: Long-term thesis is intact so I recommend to take advantage of recent weakness and add to SYK in any account that is underweight SYK vs. our model.

Current Price: $239                          Price target: $293

Position size: 2.31%                        1-year Performance: +6%          


Stryker released its 4Q 2021 earnings last evening.

  • Sales were up +9% organically y/y which is a typical pre-covid growth rate for SYK.
  • Elective procedures pressure due to covid impacted Hips & Spine business, while knees, trauma and other did better than expected.
  • Mako growth of +27% in 2021, with an installed base of robots of 1,500! Like mentioned before, new competitors entering the marketplace is actually triggering interest in Mako and new trials, resulting in additional wins.
  • Gross margin pressure from: business mix, employee absenteeism, inflation (steel, electronics, transportation)
  • Cost discipline helped offset some of the inflation impact


FY22 guidance:

  • Top line growth +6-8% organic – we view this as great considering continued covid pressure
  • Gross margin pressures result in 50-100bps contraction y/y
  • EPS $9.60-$10.00 shows lower operating leverage than expected (supply issues with electronics)


Why is the stock down today?

  • Macro headwinds continue to pressure margins
  • Guidance for FY22 is somewhat muted by all the covid/supply chains/inflation uncertainty pressuring EPS growth


Why do we still like the stock?

  • Diversified revenue drivers, premium products offered help the company gain market shares
  • Strong order book for capital products from hospitals
  • Mako robots still best-in-class and ahead of competitors
  • M&A actions have typically been additive to SYK. Recent Vocera deal is neutral to EPS this year


Valuation is not expensive due to continued covid pressure. Long-term thesis is intact so I recommend to take advantage of recent weakness and add to SYK in any account that is underweight SYK vs. our model.


   SYK Thesis:

  • Consistent top and bottom line growth in the mid and upper single digits respectively
  • Continued operating leverage of current infrastructure
  • Strong balance sheet and cash flow used in the best interest of shareholders


$SYK.US

[category earnings] [tag SYK]


Julie S. Praline

Director, Equity Analyst


Direct: 617.226.0025

Fax: 617.523.8118


Crestwood Advisors

One Liberty Square

Suite 500

Boston, MA 02109
 

www.crestwoodadvisors.com


MKC 4Q21 earnings results


Key Takeaways:


Current Price: $96                   Price Target: $108 (NEW)

Position size: 2.39%                1-Year Performance: +3%


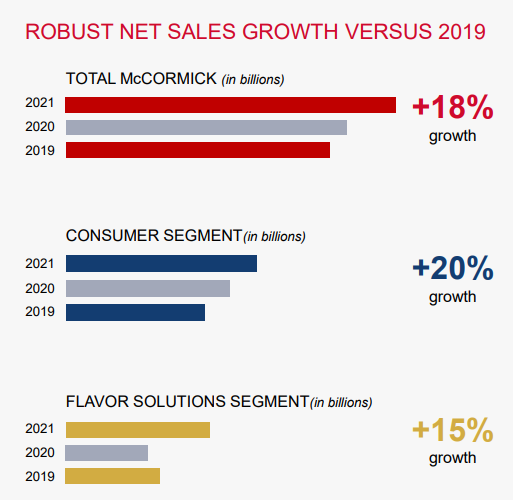
  • Revenue growth of +10.2% came above expectations
    • Growth driven by volume and pricing in both segments
    • Consumer sales +9.2% y/y, pricing helping +2.5%, volume/mix added +4.8%
      • Continued preference for cooking more at home.
      • Gaining market shares
      • Recent acquisition is also helping growth (Cholula brand) +1.9%
    • Flavor Solutions: +12.1% – acquisitions added 7.3% to top line; price & volume added 2.3% and 2.5%
  • Gross margins were down 150bps y/y due to continued cost inflation, but that was better than street expectations. Operating margin down 80bps y/y
    • Cost inflation & logistics challenges had a bigger impact on margins than sales leverage and cost savings actions
    • ERP investments is offset by lower COVID-19 related costs
    • Started phasing in pricing actions
    • Lower brand marketing spending is helping SG&A spending
  • Guidance for the year is better than expected.
    • Sales growth of 3-5% (FX has a -1% impact)
      • Additional pricing actions to start in Q2
    • Gross margins down 50bps to flat
    • operating income +8% to +10%
    • EPS $3.17-$3.22, above consensus of $3.09
  • Long-term thesis is intact. We see the inflation situation and pressure on margin as a temporary impact, as the company will continue to raise prices to offset increased costs
  • CEO quote:
    • Demand: “he demand for flavor is not cyclical or […] pandemic related, but is undergirded by real demographics […] fueling that demand and we think that the […] shifted consumption at home that has happened in recent years is just a continuation of a long-term trend that supports our business from an underlying standpoint and all the things that we do on our strategies for brand building […] continue to be supportive of growth. 
    • Pricing action: “for the volume impact at a total company level to be more flattish to low-single-digit decline. We have modeled in elasticity, but not as the rates that we’ve seen historically. I do think that we’re new and uncharted territory versus all of the elasticity models. At least from the actions that we’ve taken so far. […]. And that’s what we seem to be experiencing. If anything we may be seeing slightly even less elasticity than we’ve assumed“.


The Thesis on MKC:

  • Industry Leader: McCormick & Company (MKC) is a leading manufacturer of spices and flavorings. MKC has been in business for 120 years and the founding family still has ownership interest
  • Growth opportunity: Spice consumption is growing 3 times faster than population growth. With the leading branded and private label position, MKC stands to be the biggest beneficiary of this global trend
  • Offense/Defense: MKC supplies spices to major food companies including PepsiCo and YUM! Brands giving it a blend of cyclical and counter-cyclical exposure
  • Balance sheet and cash flow strength offer opportunities for continued consolidation through M&A in the sector


$US.MKC

[tag MKC]

[category earnings]


Julie S. Praline

Director, Equity Analyst


Direct: 617.226.0025

Fax: 617.523.8118


Crestwood Advisors

One Liberty Square

Suite 500

Boston, MA 02109
 

www.crestwoodadvisors.com


MSFT Q222 Earnings Update

Current Price:   $294                     Price Target: $375

Position Size:    7.7%                     TTM Performance: 27%


Key takeaways:

  • Broad beat, solid Q3 guidance and commercial bookings growth.
  • Revenue growth was +20% YoY revenue growth and EPS +22% YoY.
  • Azure continues to be key growth driver – they saw slight deceleration (+45% from +48%), but forecasted for a re-acceleration. As I’ve noted many times, this business can be lumpy w/ an increasing amount of large contracts. While a small acceleration/deceleration here can often move the stock short-term, they key point is that they are well positioned in this business and continue to take share. This will be a solid long term growth driver for the company.


Additional Highlights:


  • Quotes…
    • On labor market: “We are experiencing a great reshuffle across the global labor market as more people in more places than ever rethink how, where and why they work” benefitting LinkedIn
    • On the reimagined work environment: “The future of how we work, connect, and play, one thing is clear: the PC will be more critical than ever. There has been a structural shift in PC demand emerging from this pandemic.”
    • On inflation: they sell products that help companies deal with inflationary pressures. “Digital technology is a deflationary force in an inflationary economy. Businesses – small and large – can improve productivity and the affordability of their products and services by building tech intensity.”
    • On the metaverse:  as the digital and physical worlds come together we’re seeing real enterprise metaverse usage from smart factories to smart buildings to smart cities. We’re helping organizations use the combination of Azure IOT, digital twins and mesh to help digitize people places and things in order to visualize, simulate and analyze any business process.”
  • Commercial cloud, which aggregates Azure, Office 365, the commercial portion of LinkedIn and Dynamics grew +32% YoY, closing in on a $90B annual run rate (Azure is >$40B run rate, so approaching half). They continue to see significant growth in the number of $10 million plus Azure and Microsoft 365 contracts.
  • Secular growth: While Microsoft benefited from accelerated digital transformation from the pandemic, they are well positioned to capitalize on a number of long-term secular trends that will continue to drive mid-to-high teens earnings growth. Secular drivers include public cloud and SaaS adoption, continued digital transformation, AI/ML, BI/analytics, and DevOps. As organizations become increasingly digital, MSFT’s products are evolving from being primarily productivity tools to being more strategic tools. This suggests an improving value proposition to customers, which is key to the durability of their LT growth and profitability.
  • Segment detail…
    • Productivity and Business Processes ($16B, +19% YoY):
      • LinkedIn – revenue increased 37% (up 36% in constant currency) driven by Marketing Solutions growth and an improving job market in their Talent Solutions business.
      • Office 365 Commercial (rev +19%)- driven by installed base expansion as well as higher ARPU. Demand for security, compliance and voice offering drove continued momentum in E5 (highest tier) licensing.
      • Dynamics 365 (rev +45%) – Power Platform (low-code, no-code tools, robotic process automation, virtual agents and business intelligence) now has >20 million monthly active users.
    • Intelligent Cloud ($18B, +26% YoY):
      • Server products and cloud services revenue increased 29% with Azure revenue growth of 46% driven by strong demand for their consumption based services.
      • An increasing mix of large, long-term Azure contracts can drive quarterly volatility in the growth rates.
      • Leader in hybrid cloud and have more datacenter regions than any other provider and continuing to add data center regions and extending their infrastructure to the 5G network edge helping operators and enterprises create new business models and deliver ultra-low latency services closer to the end-user. AT&T for example is bringing together its 5G network with MSFT’s cloud services to help General Motors deliver next generation connected vehicle solutions to drivers.
    • More Personal Computing ($13.3B +12% YoY):
      • Windows OEM revenue increased 25%. Seeing continued strength in PC demand despite ongoing supply chain disruptions.
      • Surface revenue increased 8%
      • Gaming revenue increased 8%. Xbox hardware revenue grew a 4%, driven by demand for new consoles and better than expected supply. Xbox and content and services revenue increased 10%.
      • Search advertising revenue increased +32% YoY as companies pick up spending on digital advertising
  • Microsoft is looking to acquire Activision Blizzard in an all cash deal for $69B (net of ~$6B in cash). MSFT has ~$125B in cash on hand. It is expected to close by July 2023 pending approval by regulators…approval could be an issue. This acquisition would be MSFT’s largest deal ever (see chart below). This acquisition represents not only investment in their gaming business, but also in the metaverse. MSFT has been working on building their original game content and Activision Blizzard’s library of original games and game developer talent would add to that.  In terms of the metaverse…video games represent key potential metaverse content and MSFT, w/ their HoloLens headset, has the #2 virtual reality hardware (second to Meta/FB’s Oculus headset) underpinning the immersive aspect of the metaverse. MSFT is focused on other metaverse aspects as well, including new collaboration capabilities (e.g. joining Teams meetings w/ avatars) and they plan to roll out software tools related to metaverse content development. “When we talk about the metaverse, we’re describing both a new platform and a new application type, similar to how we talked about the web and websites in the early ’90s” CEO Satya Nadella said. Others are investing heavily in this space as well…Google is working on hardware, Apple is also working on a VR/AR headset that could be released later this year. In October Accenture said it bought 60K Oculus headsets to train new employees.


  • Valuation:
    • Valuation has gotten cheaper…trading at >3% FCF yield on 2022. A premium to the S&P and of the mega cap tech names that we own, this is the most expensive…supported by a high moat, strong margins, robust secular growth and the absence of antitrust scrutiny (though their peers try to agitate to have them included).
    • Recurring revenue is >60% of total, underpins most of their valuation and is resilient and poised to be a greater part of the mix. Particularly Azure, Office 365 and Dynamics 365. 


Sarah Kanwal

Equity Analyst, Director


Direct: 617.226.0022

Fax: 617.523.8118


Crestwood Advisors

One Liberty Square, Suite 500

Boston, MA 02109

www.crestwoodadvisors.com


JNJ 4Q21 earnings summary

Key takeaways:


Current Price: $165      Price Target: $200 

Position size: 2.14%     1-Year Performance: -1.8%


  • 4Q2021 results:


    • Overall sales +11.6% organic, adjusted EPS +17.2%
      • JNJ continues to outperform in its pharma segment, although this has been muted in part by lower consumer segment performance and reduced sales in medtech from Covid.
      • There are multiple catalysts coming up for the stock this year:
        • covid vaccines sales could surprise on the upside
        • details on the separation of its consumer business, which should help rebase multiples for this high quality pharma name.


    • Pharma segment performing well with sales +18.6% organic
      • Covid vaccine sales helped top-line, as $1.62B sales beat expectations, mostly from international sales
        • Overall covid vaccine sales for 2021 fell short of guidance ($2.39B vs. $2.5B)
      • Oncology +12.3% growth
      • Infectious diseases +168.8% from international covid vaccines
      • Immunology +7.1% growth
      • Pulmonary Hypertension -0.2%
      • Cardiovascular/other growth -13.8% decline due to biosimilar competition
      • Neuroscience +7.1%
      • Expect sales to remain strong
    • Consumer segment: +2.9% organic growth
      • Growth driven by over-the-counter drugs
      • Constraints from supply-chain issues (skincare in particular)
    • Medical Devices: +5.6% organic sales growth
      • Growth driven by market recovery post pandemic, new product introduction success
      • Some deferrals in elective surgeries due to Omicron wave
      • Supply-chain constraints
      • Expect acceleration in recovery in 2H22


    • This was the first call for JNJ new CEO Joaquin Duato


    • JNJ announced in November 2021 the spin out of its consumer unit, leaving the more profitable pharma and medical devices unit together. JNJ is considering multiple pathways to the separation, which is planned for 2023. Next steps:
      • 1H22: appointment of the consumer unit leadership team
      • Mid-year: reveal of new name and headquarters location
      • End of 2022: financial details provided


  • 2022 initial guidance:
    • Revenue $98.9B-$100.4B (consensus $98B) – includes covid vaccines of $3B-$3.5B
      • Total sales growth of 7-8.5%
      • Pharma: above market growth expected
      • Medical devices: covid headwinds, with recovery later in the year
      • Consumer health: supply chain constraints continue in 1H22
    • 50bps operating margin expansion (includes covid vaccine)
    • EPS $10.40-$10.60 vs consensus $10.35


Thesis on JNJ:

  • High quality company with consistent 20% ROE, attractive FCF yield,
  • Investments in the pipeline and moderating patent expirations create a profile for accelerated revenue and earnings growth
  • Growth opportunity: Medical Devices and Consumer offer sustainable growth and potential for expansion internationally
  • Strong balance sheet that offers opportunities for M&A.


[category Equity Earnings]

[tag JNJ]

$JNJ.US


Julie S. Praline

Director, Equity Analyst


Direct: 617.226.0025

Fax: 617.523.8118


Crestwood Advisors

One Liberty Square

Suite 500

Boston, MA 02109


www.crestwoodadvisors.com


Bank of America Q4 results

On 1/19, Bank of America (BAC) reported strong Q4 EPS of $.82 ahead of estimates of $.76.  Highlights for the quarter were 12% Net Interest Income growth, deposit growth of 15% and ROTE of 17.0%. BAC’s earnings remain levered to rising interest rates – a 100 basis point increase in yields would increase NII $6.5b. 


Current Price: $44.5                         Price Target: $52 (raised from $50)

Position Size:   3.5%                         Trailing 12-month Performance: 43.9%


Highlights:

  • Revenue growth of +10% to $22.1b  
  • Deposits continued their strong growth  +15% YOY
  • Strong metrics for loan quality throughout pandemic. BAC had a historically low loss ratio of 15 basis points.
  • For the year, repurchased $25.1b of shares and dividends of $6.6b for a shareholder yield of 8.4%.
  • Good expense control

Outlook:

  • Set expectations for flat expense growth for 2022.
  • Expects strong loan growth, and balances should return to pre-pandemic levels
  • Net Interest Margin (NIM) fell slightly to 1.67% and should begin to recover with rate hikes. 
  • 100 basis point shift in yield curve will increase NII by $6.5b over next 12 months


  • Deposits have grown 16% YOY
    • Grew deposits by $270b in 2021!
    • BAC ranked #1 in deposit share
    • BAC pays just .05% on deposits

Chart, bar chart  Description automatically generated

  • BAC has managed the pandemic well with strong credit performance.
    • Net charge-offs only 0.15% of loans, which is a 50-year low.  Last year this ratio peaked at 0.45%.  For comparison during 2010, the charge-off ratio peaked at 3.8% showing the relative severity of the Great Recession and the current strength of the U.S. banking system.

BAC Thesis:


  • Over the years BAC has dramatically improved their Consumer Banking unit, leveraging technology and their digital platforms which has improved margins and driven earning’s growth. 
  • BAC has a high-quality loan book which was seen during the pandemic as loan loss metrics were best among peers
  • BAC has strong earnings power, generating over $5b a quarter in earnings
  1. BAC continues to build capital which should lead to increased dividends and buybacks
  2. BAC’s earnings are sensitive to rate increases. 


Please let me know if you have questions.

Thanks,

John


[category Equity Earnings]

[tag BAC]

$BAC.US


John R. Ingram CFA

Chief Investment Officer

Partner


Direct: 617.226.0021

Fax: 617.523.8118


Crestwood Advisors

One Liberty Square

Suite 500

Boston, MA 02109

www.crestwoodadvisors.com