TJX Q4 Results

Current Price:   $66                        Price Target: $83

Position Size:    3.7%                      TTM Performance: 30%


Key takeaways:

  • Positive call; seeing robust demand – Revenue was strong but slightly below consensus. Sales levels are well ahead of pre-pandemic. For the year, “open-only” SSS were +15% (in the US +17%). These open-only same store sales compare FY22 sales (calendar 2021) to FY20 sales (calendar 2019). HomeGoods remained the standout, with comps +22%.
  • Sales were trending higher before Omicron surged.
  • Seeing higher than expected freight and wage pressure – margins were negatively impacted but somewhat offset by operating leverage on higher sales and higher merchandise margin (driven by multiple factors including mix and taking price in select categories). When freight pressures abate, margins will expand.
  • Seeing extremely plentiful inventory buying opportunities“we can’t emphasize this enough, availability of quality branded merchandise is excellent across good, better and best brands.”


Additional Highlights:


  • Quotes from the call…
    • “we remain highly focused on improving our pre-tax margin profile. We continue to believe that our initiatives to drive sales are the bast was to offset the current levels of cost pressures we-re facing.” Mid-single-digit top line growth combined with margin expansion and buybacks should lead to compounding FCF/share double digits.
    • “I’m looking at this inflationary price increase as a major opportunity for us at TJX, to get even more aggressive about adjusting our retails than we’ve been”…”we’ve had such strong success if you look at Q4 merchandise margin”… “we are feeling like there’s more significant room for improvement over the next year or two.”
  • Sales are tracking ahead of pre-pandemic levels…
    • Overall fully year sales were $48.5B, over $7 billion more than calendar 2019, pre-pandemic despite significant store closures internationally during the year.
    • FY open-only comp sales vs pre-pandemic (calendar 2021 vs calendar 2019)
      • Overall: +15%
      • Marmaxx U.S. +13%
      • HomeGoods U.S. +32%
      • Canada +8%
      • International +6%
  • For the full yr. merchandise margins were up despite higher wages and higher freight– They’re offsetting higher costs w/ strong mark-on and lower markdowns. Incremental freight costs in 4Q weighed on GM, were a 200bps headwind for the full yr., and are expected to peak in Q1, but should moderate in 2H23. HomeGoods margin is disproportionately impacted by freight increases due to its product mix. While higher wages will stay, freight pressures are expected to improve, which should benefit margins.
  • Long-term thesis intact – Relative to other brick-and-mortar focused retailers, TJX  continues to have a superior and very differentiated model. They acquire their inventory from an enormous (and growing) network of vendors, acting like a clearing mechanism for the retail industry…essentially opportunistically buying leftover/extra product that constantly flows from retailers, branded apparel companies etc. Growth of e-commerce has led to better inventory opportunities/ selection, not worse. They leverage their massive store footprint and centralized buying to merchandise their stores and e-commerce sites w/ current on-trend product. No one else does this at the scale they do. Their immense buying, planning and allocation, logistics teams are helping them navigate the current environment. They have very quick inventory turns and can be nimble and re-active w/ their inventory buys and are an important partner to their sources of inventory…and becoming even more important. It’s a powerful model that continues to take share and, while they have a growing e-commerce business too, their store model has been very resistant to e-commerce encroachment. Moreover, they have a thriving Home business, a growing e-commerce presence, an expanding international store footprint and a track record of steadily positive SSS. Prior to last year, in their 44 year history they only had 1 year of negative SSS (this is unheard of!). So, with steadily positive SSS, a slowly growing store footprint and an emerging e-commerce business, TJX steadily grows their topline w/ consistent margins that are about double that of department stores.
  • Valuation: strong balance sheet, they’ve returned to their capital allocation program w/ dividend and buybacks and the valuation is reasonable at >4% FCF yield on next yr.


Sarah Kanwal

Equity Analyst, Director


Direct: 617.226.0022

Fax: 617.523.8118


Crestwood Advisors

One Liberty Square, Suite 500

Boston, MA 02109

www.crestwoodadvisors.com


$TJX.US

[tag TJX]

[category earnings]
 

Home Depot Q4 Earnings

Current Price: $308                     Target Price: $410

Position size: 2.3%                       TTM Performance: +15%


Key Takeaways:

  • Recommend buying on weakness to ensure full position size
  • Better than expected results but conservative guidance  – SSS were +8.1% as elevated home improvement demand persists. They issued conservative guidance given uncertainty around inflation, supply chain dynamics and how consumer spending will evolve through the year.
  • Long-term growth drivers for home improvement sector remain intact –  while rising rates may be a headwind to home prices, low housing inventory is an offset that supports prices and drives new housing construction. That combined w/ an aging housing stock all drive repair & remodel activity.
  • CEO transition – New CEO Ted Decker was COO and w/ HD since 2000. Craig Manear will now serve as Chairman.
  • Increased dividend and buybacks – increased quarterly dividend by 15%. Returned $22B to shareholder through buybacks ($15B) and dividends ($7B).
  • CEO Quote: “The broader housing environment continues to be supportive of the home improvement. Demand for homes continues to be strong, and existing home inventory available for sale remains near record lows, resulting in support for continued home price appreciation. On average, homeowners’ balance sheets continue to strengthen as the aggregate value of US home equity grew approximately 35% or $6.5 trillion since the first quarter of 2019. The housing stock continues to age, and customers tell us the demand for home improvement projects of all sizes is healthy.”


Additional Highlights:

  • Secular tailwinds persist…more homes need to be built. This should be a LT secular driver for HD.
    • Undersupply of homes continues to support pricing and years of underbuilding has shifted the age of the existing US housing stock – both of which support home improvement spending.  
    • According to a recent study by the National Association of Realtors, due to years of underbuilding, the US is short 6.8 million homes.
    • Building would need to accelerate to a pace that is well above the current trend…. To more than 2 million housing units per year vs a ~1.6m annual rate for starts.
    • From the NAR report released in June…“Following decades of underbuilding and underinvestment, the state of America’s housing stock, which is among the most critical pieces of our national infrastructure, is dire, with a chronic shortage of affordable and available homes to house the nation’s population. The housing stock around the nation has been widely neglected, with a severe lack of new construction and prolonged underinvestment leading to an acute shortage of available housing, an ever-worsening affordability crisis and an existing housing stock that is aging and increasingly in need of repair.”
  • Updated their total addressable market (TAM) estimates…
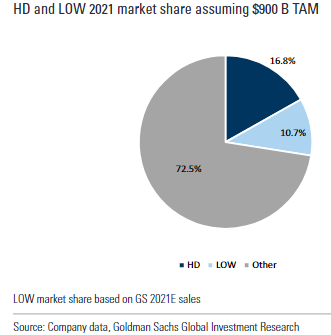
    • They updated their N. American TAM estimate from $650B to $900B with Pro and DIY each representing 50% and with MRO accounting for $100B of Pro. They also provided a long-term sales target of $200B. At a mid-single-digit CAGR, they would hit this in 2029. HD has about 17% share and LOW has ~11%… the other ~72% is pretty fragmented providing lots of opportunity to take share which is supportive of their LT growth targets.
  • Solid current trends:
    • Hit >$150B in revenue in 2021. They’ve grown their business by over $40B in the last 2 years after double-digit comp growth for fiscal 2021 on top of nearly 20% comp growth in fiscal 2020.
    • SSS of 7.3% in November, 10.2% in December and 7% in January. SSS in the US were positive 7.6% for the quarter, with SSS of 7.2% in November, 10.9% in December and 5.4% in January.
    • Inflation in things like lumber is a significant tailwind to SSS – in Q4 alone, the pricing for framing lumber ranged from approximately $585 to over $1,200 per thousand board feet, an increase of more than 100%.
    • Pro sales growth outpacing DIYPro is now 50% of total, increasing as a part of the mix as consumers resume large projects and return to pre-pandemic activities. 
    • GM was 33.6%, a decrease of approximately 30bps from last year, primarily driven by product mix and investments in their supply chain network.
    • Big-ticket comp transactions or those over $1,000 were again up approximately 18%, indicative of strong consumer environment
    • E-commerce sales were +9% for the yr. and up >100% over the past 2 years.
  • Why we like it…

·         Multiple long-term growth drivers: durable housing trends, taking share in a fragmented home improvement market w/ DIY & Pro, and growing their more nascent MRO business (particularly after HD Supply acquisition) and leveraging their best of breed omni-channel model.

·         Best of breed omni-channel model drives productivity: 

o   By adding specialized warehouse capacity and enhancing digital capabilities (online and in the store), HD is uniquely positioned to leverage their existing retail footprint (not really growing stores) and drive steadily high ROIC that is ~45% (which is incredible). They continue to add new bulk distribution centers (used replenish stores with lumber and building materials), flatbed distribution centers (which are often tied to the bulk distribution centers), MDOs (market delivery operations are used to flow through big and bulky products, particularly appliances). and adding direct fulfillment centers for e-comm fulfilment which will allow them to cover 90% of the country in same or next-day delivery.

o   They dominate the category, are the low cost provider, have a relentless focus on productivity and can continue to flow an increasing amount of goods through their big box stores w/ omni-channel. This is a highly efficient model as 55% of online sales are picked up in-store which HD can fulfill from the store or nearby warehouses.

·        Capital allocation: they’ve resumed share repurchases and remain committed to growing their dividend over time.

·        Valuation: Strong balance sheet, benefiting from strong housing trends but also has defensive qualities and a reasonable valuation, trading at >5% forward FCF yield.


Sarah Kanwal

Equity Analyst, Director


Direct: 617.226.0022

Fax: 617.523.8118


Crestwood Advisors

One Liberty Square, Suite 500

Boston, MA 02109

www.crestwoodadvisors.com


$HD.US

[tag HD]

[category earnings]


Hilton 4Q21 Results

Share Price: $150            Target Price: $170 (increased from $160)

Position Size: 2.1%          1 Yr. Return: +32%


Key takeaways:

  • Very positive quarter and strong progress on recovery – RevPAR continues improve vs. 2019 baseline, w/ RevPAR for the quarter down -13% vs 2019…US leisure travel continues to be a key demand driver and is expected to stay strong. Recovery of group, business transient and Chinese and European markets will all be added tailwinds going forward.
  • Saw some weakness w/ omicron but outlook is very positive – Seasonally softer leisure demand coupled with incremental COVID impacts due to the Omicron variant tempered recent trends (January system-wide RevPAR was ~75% of 2019 levels). Despite near-term choppiness, they remain very optimistic about accelerated recovery across all segments throughout 2022.
  • Solid unit growth, ahead of guidance (+5.6% YoY) – they expect 5% this year, accelerating to 6-7% longer term. This provides key support to LT growth story, as industry leading RevPAR premiums continue to drive a high quality pipeline.
  • China is not a problem – China is an important part of their pipeline and growth there is intact. Commentary around China was very optimistic.
  • Expect to reinstate buybacks and quarterly dividend in Q2


Highlights:

  • Q4 RevPAR was roughly 87% of 2019 levels with ADR nearly back to prior peaks. More moderate than Marriott’s 81% due to Marriott’s higher mix of luxury/urban/corporate.
  • By geography…RevPAR in EMEA (+7% vs 2019) and US (-11% vs 2019) were strongest while China (-24% vs 2019%) and Europe (-25% vs 2019) were weakest given lingering Covid restrictions.
  • By demand segment…
    • Leisure is leading the recovery w/ record performance which continues to exceed 2019 levels. Their strong leisure demand over the holiday season drove U.S. RevPAR to more than 98% of 2019 levels for December. They anticipate strong leisure trends to continue again this year driven by pent-up demand and nearly $2.5 trillion of excess consumer savings.
    • Business transient room nights were approximately 80% of 2019 levels, but management’s outlook is very positive. They expect growth in GDP and non-residential fixed investment coupled with more flexible travel policies across large corporate customers to drive an improvement in business transient trends. About 80% of their corporate demand is from SMBs – they’re getting close to 2019 levels while large corporates are down >30% from 2019. As a positive indication of business transient recovery…at the beginning of January midweek U.S. transient bookings for all future periods were down 13% from 2019 levels and improved to just down 4% by the end of the month.
    • Group – December room nights were just 12% off of 2019 levels. Performance was largely driven by strong social business, while recovery in company meetings and larger groups continued to lag. Group demand takes longer to recover given planning lead times for large social events and business conferences. Future group booking are occurring at higher rates than 2019. They are seeing huge amounts of pent-up demand and think 2022 will be a “barn burner” year for their group business. “Rates are up because we’re being super disciplined recognizing that there is a limited amount of meeting space is going to be a gargantuan amount of demand and we can be a bit patient.”
  • Margins going up…
    • 2021 margins were +500 basis points above 2019 peak levels reaching ~66% for the full year despite full year RevPAR and adj. EBITDA being 30% below 2019 peak levels.
    • Inflation is also a tailwind. They have pricing power, re-price their product daily and have a significant portion of their revenues that are royalties tied to top line. Franchising is almost 2/3 of EBITDA and tied to top line, managing is another 25% of EBITDA where the fee stream is a mix of base management fees (% of room revenue) and incentive management fees (% of hotel profitability). So, in an inflationary environment, pricing power = margin expansion.
    • They expect permanent margin improvement versus prior peak levels in the range of 400 to 600 basis points over the next few years aided by cost efficiencies gained through Covid, including lowering labor intensity.
  • Inflation and pricing power…
    • “It has been hard to hire labor, we do need to bring some of those service standards back, obviously everybody knows what’s going on with inflation and wage inflation. But of course the flip side of that on inflation is that helps on the revenue line, right? We reprice the rooms every night. If inflation is a headwind on the cost side, it’s going to be a tailwind on the revenue side and the revenue base is obviously bigger than the expense base. And so, that ought to lead to higher margins coming out the other side. So, when you put that all together, we think we can do a better job for customers, give them what they want, take away what they don’t want, and what they won’t pay for, and use driving revenue through an inflationary environment to get our owners to be higher margin businesses coming out the other side.”
    • “we’re going to have more inflationary environment broadly. Thank you, Federal Reserve and the US Congress for fiscal and monetary stimulus, …we could debate transitory or otherwise. But those things are translating into broadly, a more highly inflationary environment and that applies to us too, and that obviously is helping from a pricing power point of view.”
  • Pipeline – Stable unit growth underpins the story
    • Development activity continues to gain momentum across the globe as the recovery progresses.
    • China development activity is particularly strong – “most of the development trends have been following the trend of the virus. So meaning, as the world has been opening up in those regions you see a pretty direct correlation to signing activity and approval activity in those regions… China has been kind of the exception to that rule, meaning even with lockdowns and people not moving around and you would think not being able to travel across the country would slow the pace of activity, but that just hasn’t been the case.”  Mgmt. says the addressable market there is enormous (easily 20K hotels or more). This will be a LT source of growth for them.
    • Unit growth in Q4 was 5.6% YoY and the pipeline increased to >400K rooms. That represents ~38% room growth from their current installed base of  >1 million rooms and more than half are under construction (helps underpin several yrs. of predictable growth).
    • 62% of their pipeline is located outside the US (franchise and mid-tier focus, tied to growing global middle class)
  • Continued strength in their market leading RevPAR index. RevPAR index is their RevPAR premium/discount relative to peers adjusted for chain scale. I.e. Hampton Inn (35 year old brand) has a RevPAR index of 120. They are the market leaders – this is helpful because it’s what leads to pipeline growth (hotel operators want to associate w/ the brand that yields the best rates and occupancy) and is helpful in a macro downturn because it’s even more crucial for a developer to be associated with a market leading brand to get financing. The thought is that they would likely take more pipeline share if lending standards tighten and that’s exactly what we’ve seen during Covid. The other countercyclical aspect of their pipeline growth is conversions (an existing hotel changes their banner to Hilton). They continue to see strong conversions which were 20% of openings in the quarter.
  • ESG – named the number three World’s Best Workplace by Fortune
  • Capital returns resuming –In 2019 they returned more than 8% of their market cap to shareholders in the form of buybacks and dividends. They intend to return to their historical capital return model.


$HLT.US

[category earnings]

[tag HLT]


Sarah Kanwal

Equity Analyst, Director


Direct: 617.226.0022

Fax: 617.523.8118


Crestwood Advisors

One Liberty Square, Suite 500

Boston, MA 02109

www.crestwoodadvisors.com


Black Knight 4Q21 Earnings

Hello,


Please see write-up on BKI for Q4 2021 provided below. I have been working with Sarah (and Julie) on some of the quarterly updates. If there are any questions please feel free to reach out to us. Thanks!


Current Price: $56.24

Price Target: $80 (down from $96)

Position Size: 1.52%

TTM Performance: -32.38%

 Key Takeaways: 

    • Beat estimates: similar to the previous quarters in FY21, they beat estimates on strong new customer adds and cross-selling progress aided by their recent acquisition, Optimal Blue. “From a sales perspective, 2021 was a record year and the fourth quarter was the highest of the year.”
    • Optimal Blue: an agreement with Cannae Holdings and Thomas H. Lee Partners has been reached in which Black Knight will be acquiring the remaining interest, to own 100% of Optimal Blue.
    • Management promotions: announced that Joe Nackashi (35-years with BKI and President as of 2017) has been appointed CEO. Kirk Larsen (joined as CFO in 2014) has also been appointed President and CFO. Anthony Jabbour, previous CEO, will be chairman and will continue to act as CEO of DNB.
    • Continued growth through strong acquisitions: the company continues to expand their capabilities in automation and cost reduction through acquisitions like Surefire. “We’re also developing new capability for the recently acquired Surefire marketing automation platform that was originally built to serve the origination market to help service and provide better customer service and reduce call volume.”
    • Positive sales and client outlook: in FY21 they were able to grow their customer base and are expecting to see stronger growth going forward. “Based on our strong pipeline and sales momentum, we expect to sign more clients in 2022 than we did last year.”

 Additional Highlights:

    • Seeing robust organic growth, ahead of LT targets: For the quarter, revenues increased 13%; organic revenue growth of 11%. As for the year, revenues increased 19%; organic revenue growth of 10%.
    • Guidance in line w/ LT targets: Anticipating FY22 revenue growth of 8-9% on organic revenue growth of 7-8%. 
      • Tailwind from higher foreclosure volumes (~$30m).
      • Headwind from lower origination volumes (~$30m).
    • Cost headwinds as operating environment is reaching a more “normal” level: Expecting an approximately $12m increase in expenses over FY21 levels. “On the expense side, we’re expecting increases in sales and marketing and travel and entertainment expenses as a result of a return to a more normal operating environment and higher personnel expenses and wage inflation above our typical annual increases.”
    • Margins (EBITDA) may see a short-term decline in 2022: Anticipating EBITDA margin to slightly decline in Q1 2022 compared to Q4 2021 due to normal seasonality, but expect this to quickly turn around in the following quarters.
    • Limited impact from higher rates/end of refinancing boom:
      • Interest rates drive mortgage volumes but BKI revs are more tied to loans outstanding than the cyclicality of volumes.
      • Revenues tied to origination volumes are a relatively modest percentage of total revenue (sub-10%… or  ~18%  of  origination  revenues  and  26%  of  data  & analytics).
      • The rest of their revenue is recurring (>90%) with 5-7  year contracts and price escalators (adds ~1.5% to top line annually).
    • Focus on innovation and integrated offerings: their strategy is to continue to deliver innovation and selectively pursue acquisitions to further strengthen their end-to-end offerings across the mortgage life cycle.
      • Example of new innovation: earlier this year they launched their underwriter assist solution, which uses AI enhanced automation to review loan package documents more efficiently, reducing the overall cost by reducing manual review time and supporting effective decision-making by underwriters.
      • Example of a strengthening acquisition: the purchase of Surefire will help reduce call volume and customer servicing by sharing explanatory and personalized videos for Servicing Digital (ie. escrow statement flow, private mortgage insurance, refi benefits, etc…).

Data & Analytics segment (~15% of revenue) Q4 revenues were up 11% and FY21 revenues were up 13%. Driven by strong sales execution and revenue from new innovative solutions.

    • Organic revenue growth of 8%; 220bps of operating margin expansion.
    • Anticipating negative revenue growth of a few percent due to origination volume headwinds and the removal of two data deals at lower annual rates.
    • Trending ahead of LT targets in recent quarters on strong cross-sales related to new client deals, as well as renewals.
    • Current situation is highlighting their unique data sets and analytics. They are the only company with real-time visibility into the majority of active mortgage loans in the US.

Software Solutions segment (~85% of revenue) Q4 revenues were up 13% and FY21 revenues were up 20%.

    • Organic growth of 11%; 130bps of operating margin contraction.
    • Expecting low double-digit revenue growth in FY22.
    • Servicing (low-60’s% of revenue) revenues up 7%
      • Growth driven by higher usage based revenues on MSP (Mortgage Servicing Platform), new innovative solutions, and new clients.
      • Expecting high-single digit revenue growth in FY22.
    • Originations (~20% of total revs) – made up of new loans, refi’s and HE– revenues up 28% (organic revenues up 20%)
      • Growth driven by Optimal Blue acquisition and new clients.
      • Expecting mid-teens revenue growth in FY22.
      • Strategy is to create a comprehensive end-to-end solution to digitize the origination process and increase efficiency through automation and AI to reduce the costs to originate a loan.

Valuation:

    • “bought back $100 million of shares in recognition of strong cash flow and our stock trading at levels that we believe is meaningfully below its intrinsic value.”
    •  Trading at >4% FCF yield on 2022 –valuation has gotten less expensive more recently and is supported by growth potential, strong ROIC with a recurring, predictable revenue model (>90% recurring revenue) and high FCF margins, which is aided by high incremental margins and capex which should taper as they grow.
    • They should see high-single-digit top line growth and margin expansion in both segments – LT mgmt. goal of 50-100bps total per year – that, combined w/ modest share buybacks, should drive low-double-digit FCF/share growth.
    • Net leverage ratio dropped to 3.2x
    • Capital allocation priorities include debt pay down, opportunistic share repurchases and acquisitions.

Thesis:

    • Black Knight is an industry leader with leading market share of the mortgage servicing industry. 
    • Digitization of real estate transactions is still in early stages
    • Stable business with >90% recurring revenues, long-term contracts and high switching costs.
    • BKI has high returns on capital and high cash flow margins.


Sarah Kanwal

Equity Analyst, Director


Direct: 617.226.0022

Fax: 617.523.8118


Crestwood Advisors

One Liberty Square, Suite 500

Boston, MA 02109

www.crestwoodadvisors.com


Micah Weinstein

Research Analyst


Direct: 617.226.0032

Fax: 617.523.8118


Crestwood Advisors

One Liberty Square

Suite 500

Boston, MA 02109

www.crestwoodadvisors.com


Syneos 4Q21 earnings summary

Key Takeaways:

Current Price: $81                          Price target: $120

Position size: 2.66%                      1-year Performance: +7%          


  • Core sales +20.5% missed the street estimates due to FX impact, lower reimbursable expenses and faster wind down of some covid projects. The positive side of this is better profitability as mix improved.
    • Total sales $1,373M vs estimates of $1,407M
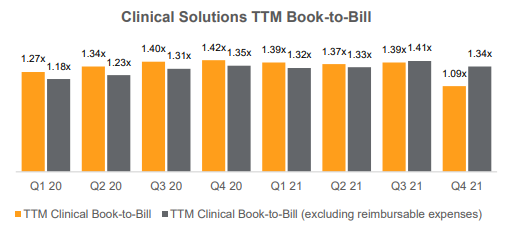
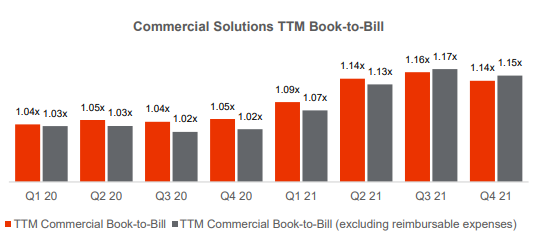
    • Clinical trials new business awards grew 17.5% à book-to-bill now 1.34X (above 1X is positive for future growth) which is stable y/y although a slight decline from Q3
    • Clinical revenue +20.7%


    • Commercial net new business awards grew 25.6% à book-to-bill 1.15X has improved y/y
    • Commercial sales +19.8% y/y


  • Gross margin contracted by 20bps y/y
  • Adjusted EBITDA margin of 17.3% grew 20bps, where higher than consensus of 16.8%
  • Operating margin contracted 10bps y/y
  • Adjusted EPS of $1.48 beat consensus and was up 33% y/y
  • Free cash flow was $159.1M, growing ~55% y/y
  • Net leverage stands at 3.6X, lower from 3.8X 6 months ago and within their target range of 3.5-4X


2022 Guidance in line with expectations:

  • Revenue growth of 7.4% – 10.3%
  • Adjusted EBITDA margin 15% – 15.3%
  • Adjusted EPS $4.98-$5.24 (+11.7% to +17.5%)


Why is the company seeing lower reimbursable expenses since the start of the covid pandemic?

  • lower travel expenses for SYNH staff, due to sustained levels of remote monitoring
  • investigator meetings remaining virtual
  • reduce costs for study medications

This trend is expected to continue and as such, SYNH is changing its backlog reporting, which has no impact on demand or profitability, but a reflection of how business is done.


Competitors have released earnings earlier than Syneos, mentioning some weakness in SMID biotech funding. Syneos does not expect the same level of weakness, as their customers have incredible levels of funding (through private equity for example). They also have a solid RFP flow, a good predictor of future demand. The Syneos One offer is also very attractive to smaller companies who do not want to build a whole commercial structure.


CEO quotes from the call:

  • “we see great strength in the SMID at the moment, we’ve seen that across both kind of ends of the SMID as well, the emerging biotech, as well as the more mature larger customers in the SMID that we’ve kind of do the majority of work”
  • “We are proud of the the progress we have made over the past several years as we have continued to evolve our business model by developing innovative integrated offerings enabled by data and technology to position our business for long-term growth. Dynamic assembly investments that are fueling growth include Kinetic, our modern customer engagement capability and the expansion of our DCT solutions through Illingworth and study kick. Specifically in our clinical business, we’ve expanded our digitally enabled delivery and response to the pandemic, which catalyze the rapid deployment of decentralized trial capabilities and drove greater acceptance of these methods by regulators, customers, sites, patients.”
  • “While these innovations streamline the clinical development process for our customers, they also result in a lower mix of reimbursable expenses, a dynamic that we now expect to have a lasting impact on our revenue profile.”
  • “our commercial solutions business continues to demonstrate strong performance, with our full-service approach resonating with customers and the Syneos portfolio beginning to achieve commercialization milestones, resulting in 19.8% revenue growth. With deployment solutions ending back while growth of 20.9% for 2021, our commercial business remains well, positioned for low teens growth in 2022. T


In addition to Syneos One, the company is developing a very interesting business, helping customers with an integrated offering. We think this could help retain relationships with customers, especially smaller biotech firms who might not have the internal capabilities to navigate the complex landscape of drug development/approvals.

We recently introduced a full-service medical affairs offering, […] Similar in concept of Syneos One, this unique approach combines our medical affairs capabilities from across all parts of our business, into an integrated offering, connecting our real-world evidence, health economics, outcomes and research, medical science liaisons, medical communications, and specialized consulting disciplines. Today, customers have had limited access to medical affairs outsourcing alternatives, which are growing in importance as better evidence is required to ensure relevance with payers providers and patients.


ESG developments: recent commitment to net zero emissions by 2040 and participation in the human rights campaigns corporate equality index.


Overall we remain confident in Syneos to continue to grow, and take shares from competitors as they offer more than clinical trials, with commercial efforts and medical affaires options. We think the stock is down on readjusting the top line profile as the mix of reimbursable expenses adapt to remote monitoring – but which ultimately is a benefit to the industry: more patients enrollment, higher stickiness of patient profile, lower cost for biotech/pharma companies to run trials.


Investment Thesis:

I. Secular growth:

    1. Increasingly sophisticated and highly-regulated environment with government increasingly focused on drug pricing à biotech and large pharma need to reduce fixed costs
    2. Growing research and development (R&D) spending environment:
      • Growing portion of R&D outsourced to Contract Research Organizations (CROs)
      • Pharma/biotech clients choosing fewer & higher quality CROs (expertise and scale)
    3. Syneos has robust backlog predicting good growth for next 2 years
      • Recovery in clinical trials post-covid

II. Competitive advantages:

    1. Only company integrating clinical trials (Contract Research Organization -CRO) and commercialization solutions (CCO):
      • Offer customized solutions and possibility to lower time to market
    2. Top 3 market share within fragmented CRO market
    3. Global scale – allows to compete for larger trials, with expertise in complex diseases
    4. Diverse client base (large to small pharmaceuticals)

III. Attractive valuation: 45% upside

    • Driven by secular growth drivers and margin expansion


$SYNH.US

[category earnings] [category equity research] [tag SYNH]


Julie S. Praline

Director, Equity Analyst


Direct: 617.226.0025

Fax: 617.523.8118


Crestwood Advisors

One Liberty Square

Suite 500

Boston, MA 02109


www.crestwoodadvisors.com


Zoetis 4Q21 earnings summary

Key Takeaways:

 Share price: $198                    Target Price: $227  

Position size: 2.22%                TTM return: +18%


Zoetis released earnings this morning that were slightly above expectations. Overall sales were up +9%, driven by Companion Animal. This segment continued its solid trajectory with +21% sales growth led by Simparica Trio, key dermatology products and pain medication (Librela/Solensia). Librela is now the #1 pain medication for pets in Europe – a title earned in its first year of launch. Regarding competition in its recent successful launch of Simparico Trio, this is not expected until next year. The recent rise in pet adoption due to the covid pandemic continues to be a tailwind for ZTS. As for dermatology drugs, ZTS estimates 6 million dogs untreated in the US alone, due to lack of awareness by dog owners…any new competitors would help raise understanding of this condition. Livestock declined 6% due to generic competition for Draxxin (similar to last quarter). For this past segment, the management team remains optimistic, targeting a return to mid-single-digit growth in FY23, thanks to international markets exposure. Gross margins helped up well in the face of inflation (69.6% or up 170bps y/y), although SG&A spending came higher and offset some of it. Regarding pricing power, ZTS increased prices by 1% overall in 2021, with the same rate expected in 2022. Pricing is easier to raise in companion animals with leading & innovative brands, while drugs facing generics competition is harder to increase. Overall, ZTS expects price increases to help offset rising inflation.

 Guidance for 2022:

  • Revenue growth of +9-11% is respectable especially after a +15% growth rate in 2021
  • Operating margin to expand modestly as the company plans to invest behind growth drivers
  • Adj. EPS guidance of $5.09-$5.19 is below consensus of $5.21, but this looks to be due to higher FX impact


Zoetis investment thesis:

·         Attractive industry profile: mid-single-digit growth rate, little generic threat, cash payers, pet sub-sector is very fragmented

·         ZTS is a leading diversified animal pharma company that continues to innovate to fulfill unmet animal needs

·         ZTS is growing above the industry rate and has proven resilient throughout economic cycle

·         Experienced management team has proven successful in increasing revenue and margins since the IPO in 2013

·         Good capital allocation strategy: M&A and capex spending have lifted sales and improved profitability


$ZTS.US

[category earnings] [tag ZTS]


Julie S. Praline

Director, Equity Analyst


Direct: 617.226.0025

Fax: 617.523.8118


Crestwood Advisors

One Liberty Square

Suite 500

Boston, MA 02109


www.crestwoodadvisors.com


Disney Q1 earnings

Current Price: $151     Price Target: $215

Position size: 1.44%    TTM Performance: -22%   


 Key Takeaways:

  • Better than expected revenues, EPS and subscriber numbers (Disney+ subscribers 129.8 million, +37% YoY, estimate 125.1 million). This is very positive after Netflix’s weak subscriber numbers.
  • They continue to expect growth in the back half of the fiscal year to exceed growth in the first half (based on cadence of new content releases).
  • Significant increased investment on content – should continue to support Disney+ ramping ahead of initial expectations but with no change to breakeven guidance for their streaming platform.
  • Record performance w/ domestic parks – despite capacity constraints and lack of international visitors. This business should see higher margins post-pandemic.


Additional highlights:

  • Quotes…
    • On the strength of their business model:We have diverse revenue streams that span business models and industries, but which all are interconnected to create entertainments most powerful synergy machine. We have the country’s top news organization and the most trusted brand for funneling sports, and our theme parks continue to be the most magical places on earth. In short, our collection of assets and platforms, create capabilities and unique place in the cultural zeitgeist that give me great confidence that we will continue to define entertainment for the next 100 years.”
    • On the metaverse: “You want to call it metaverse, you want to call it the blending of the physical and digital experiences, which I think Disney should excel at”….”we realize that it’s going to be less of a passive type experience where you just have playback, whether it’s a sporting event or whether it’s an entertainment offering and more of an interactive lean-forward, actively engaged type experience. And this is a very top of mind thing for us, because we are continuing over time to augment our skills and the types of people that we attract into The Walt Disney Company to reflect the aggressive and ambitious technology agenda that we have. You probably noticed that one of my three pillars is innovation and specifically technological innovation, because we realize that this is going to be an important part of telling story in that third dimension, that lean forward interactive dimension. So it is absolutely top of mind.”
  • Strong streaming performance – they now have 196M subs across Disney+, Hulu and EPSN+. That is second only to Netflix, which has a ~220M….Disney’s achieved that in a little over 2 years. Disney+ now has 130M subs, Hulu is ~45M and ESPN has ~21M. Disney+ in the US is 1/3 penetrated of total broadband homes. Slightly over 50% of consumers on Disney+ do not have kids.
  • ARPU should steadily rise over time – in Q1 it was better than expected across Disney+, ESPN+ and Hulu. In general, their ARPU is lower than peers and is also weighed down by lower Disney+ fees outside the US, but they will gradually raise prices over time and they have ways (other than sub fees) to make money off of their content w/ advertising, parks and consumer products (especially w/ content like Pixar, marvel, star wars).
  • Higher content spend and global rollout will continue to support sub growth – key to this is that they can leverage their content investments better than anyone else. What separates them from Netflix is their LT success in branded storytelling – the quality and depth of their “evergreen” content is a driving force behind their streaming services.
  • Strong ad revenue – delivered record advertising revenues as they continue to see strong demand for live sports and streaming and digital businesses. ESPN benefited from the start of a normalized NBA calendar and increased viewership for football.
  • Parks set to thrive post-pandemic…
    • Record revenue and profits at domestic parks despite capacity constraints and haven’t yet seen return of int’l guests (historically 18% to 22% of Walt Disney World guests come from outside the US).  Q1 rev and op income exceeded pre-pandemic levels w/ per capital spending at domestic parks up more than 40% versus Q1 2019, driven by a more favorable guest and ticket mix, higher food, beverage and merchandise spending.
    • This supports the outlook for structurally improved economics post-pandemic as they employ technology to create efficiencies like new tools to personalize guest visits, virtual queues, mobile food ordering, mobile hotel check-in and dynamic pricing to strategically manage attendance.
  • Strong balance sheet (~2x levered). FCF should double this yr. and double again next year as they recover from pandemic related disruption and step up in content costs.


Disney Investment Thesis:

  1. Disney is a global media and entertainment company that owns a massive library of intellectual property.
  2. Their competitive advantage is their evergreen brands and synergistic business model. Disney can create content that builds off existing franchises and can be monetized across all their business, giving them the ability to create higher budget, quality content and an ever growing library of IP.
  3. New direct-to-consumer (DTC) initiative will strengthen synergies between businesses and lead to structurally higher margins and higher multiple on recurring revenue business.
  4. High quality company with solid balance sheet, strong FCF generation and ROIC.


Sarah Kanwal

Equity Analyst, Director


Direct: 617.226.0022

Fax: 617.523.8118


Crestwood Advisors

One Liberty Square, Suite 500

Boston, MA 02109

www.crestwoodadvisors.com


$DIS.US

[category earnings ]

[tag DIS]


S&P Global Q4 Results

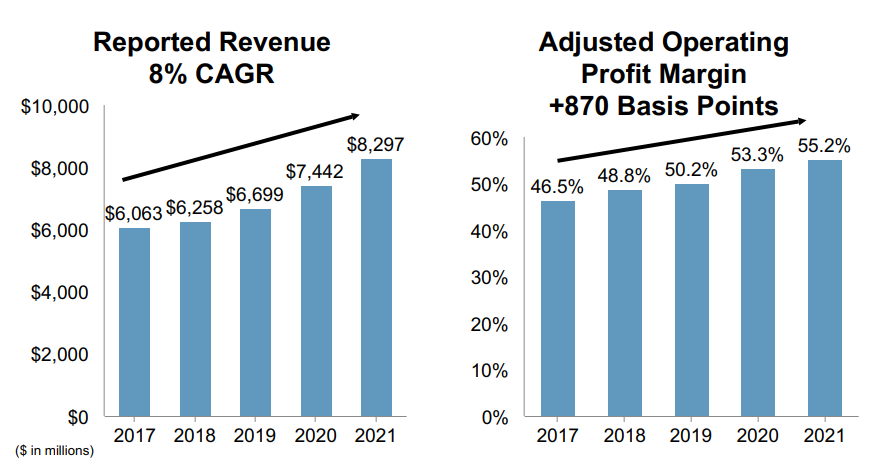
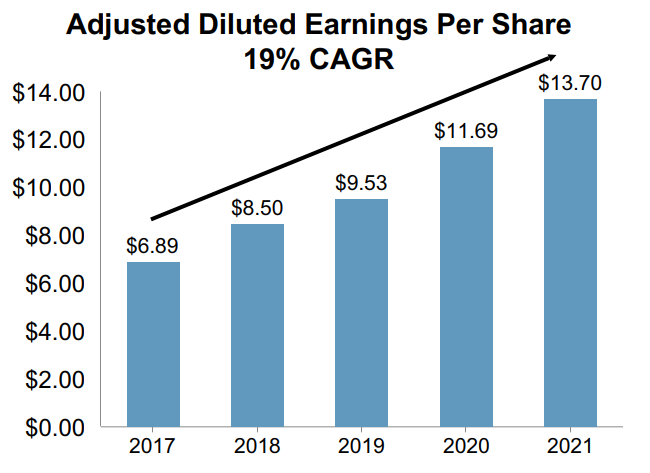
On 2/8, S&P Global announced Q4 earnings with revenue up 12% and adj EPS up 17%, which was a slight beat over expectations.  Key takeaways are:

  • S&P Revenue up 12% with solid growth in all four segments
  • Generated $3.5b in free cash flow, yielding 3.72%
  • Operating margins expanded 190 basis points to 53.2%
  • Expect IHS Markit merger to close Q1 2022. 
  • Raising slight market angst, SPGI did not issue guidance for 2022 as they will wait until after mergers closes.


Current Price: $407.29                      Price Target: $480

Position Size:   2.82%                         12 Month Performance: +23.7%


Chart, bar chartDescription automatically generated

Chart, bar chartDescription automatically generated


2021 Q4 Highlights:

  • S&P Dow Jones Indices
    • Asset-linked fees ETF AUM increased up 40%!
    • Revenues benefited from strong price appreciation and inflows
    • Revenue grew 16% and operating profit rose 17% Y/Y
    • Margins rose +80 bps to 69.9%
  • Ratings
    • Global bond issuance increased 15%, with strong growth in high yield, Bank Loans and CLOs
    • YoY revenue grew 14% and operating profit rose +17%
    • Margins rose +180 bps to 64.2%
    • Non-transaction revenue (not related to bond issuance) is over 40% of ratings revenue
  • Market Intelligence
    • Revenue grew +7% Operating profit rose +13%
    • Margins increased +190 bps to 34.3%
  • Platts
    • Revenue grew +8% and operating profit rose +9%
    • Margins increased +40 bps to 55.1%


IHS Markit merger update

  • IHS Markit will divest OPIS, Coal, Metals & Mining (CMM), and PetroChem Wire businesses to News Corp and Base Chemicals business
  • S&P Global will divest CUSIP Global Services and Leveraged Commentary and Data, together with a related family of leveraged loan indices.
  • Despite divestitures, S&P has raised cost synergies to $530m-$580m (from $480m) and revenue synergies to $330m-$360m (from $350m)

Growth initiatives

  • Implementing new ESG offerings across platform – ESG revenues up 40%
  • Technology expertise – Kensho AI initiatives
    • RiskGuage, ProSpread, Riskcasting Indices, Moonshot index, Kensho Scribe and many others combining data and analytics
  • Merger with IHS Markit

Capital allocation

  • SPGI has a current yield of .78%
  • SPGI has repurchased 14% of outstanding shares over past 5 years
  • Currently, share buybacks are on hold with the pending merger of IHS Markit.  SPGI has $6.5b of cash piled up on the balance sheet and generated $3.5b in free cash in 2021.  Expect ~85% to be returned to shareholders post-merger. Could repurchase 5%-6% of shares!


S&P Global Investment Thesis:

  • S&P Global is a highly profitable company that has established businesses with deep moats in attractive industries
  • S&P Global is focused on shareholders and returns 75% of free cash flow in dividends and share buybacks
  • Over the past several years, S&P Global has demonstrated an enviable history of revenue growth and margin expansion
  • With the merger of IHS Markit, S&P Global will combine many unique data sources, enhance data analytics capabilities, and broaden addressable markets.


Please let me know if you have any questions.


Thanks,

John


[category Equity Earnings]

[tag SPGI]

$SPGI.US


John R. Ingram CFA

Chief Investment Officer

Partner


Direct: 617.226.0021

Fax: 617.523.8118


Crestwood Advisors

One Liberty Square

Suite 500

Boston, MA 02109

www.crestwoodadvisors.com


FISV Q4 Results

Current price: $102                          Price Target: $137

Position size: 2.75%                        TTM Performance: -10%


Key Takeaways:

  • Results were largely in-line with expectations. They had 11% organic revenue growth in both Q4 and full year, at the high-end of 7% to 12% outlook.
  • Analyst day in the next few weeks could be a positive catalyst – the meeting will be focused on their merchant acceptance segment which continues to be the key growth driver for the business. Clover, which is their main product in merchant acceptance, underpinned Value Act’s thesis in taking a stake in FISV.
  • Acquiring the remaining ownership interest in Finxact, a leading developer of cloud native banking solutions. Should be growth driver in FinTech segment


Additional highlights:

  • Consolidated organic revenue growth of +11% Y/Y in-line with Street expectations
    • Acceptance +19% YoY – merchant platforms Clover for small and medium-sized businesses and Carat for enterprises are showing very strong growth. Had a 10% increase in merchant locations. Clover saw 50% GPV growth ($201B annualized volume). Acquisition of BentoBox is helping them enhance service offerings in restaurant vertical.
    • Payments +8% YoY– w/in the issuer business they saw notable strength in general purpose active accounts, now ahead of pre-pandemic levels. Zelle transactions up 71% and the number of clients live on Zelle was up 57%.
    • FinTech +4% – added 14 new core account processing clients in Q4 and 48 for the year, more than half of which were takeaways; seeing success in cross-selling pan-Fiserv capabilities to clients.
  • FDC acquisition targets being met…
    • Completed cost synergy program in Q4 – achieved target of $1.2B, $300M above original commitment and 2 years ahead of schedule.
    • They’ve seen $480M of revenue synergies and are now at 80% of the increased commitment of $600M. They anticipate obtaining the full $600M by the end of this year, 18 months ahead of schedule.
  • Announced Finxact acquisition…
    • Will aid in serving financial institution clients as they look to launch modern, flexible, personalized digital banking experiences. Finxact helps clients quickly deploy modular banking services including deposits, loans, cards as well as bank-as-a-service.

Valuation:

    • Guidance – segments should grow within the medium-term targets, driving double-digit growth in Merchant (+9-12%), mid-single-digits in FinTech (+4-6%), and mid- to high-single-digits in Payments & Network (+5-8%). Overall organic revenue growth of 7-9% YoY in-line with Street +8%
    • Op. margin expansion >150bps
    • FY22 EPS growth of +15-17% (midpoint slightly above street’s +15%)
    • Valuation is attractive at >6% FCF yield.


Investment Thesis:

  • High quality company with strong moat – market share leader with deep moat underpinned by their broad position in the money movement value chain and mission critical technology provided to financial services clients with high switching costs.
  • Multiple secular growth opportunities – driven by digitizing money movement and digital transformation in the financial services industry. Open architecture solutions enable financial institutions to leverage Fiserv’s technology and partner with other FinTech providers.
  • Margin expansion potential – driven by First Data synergies, deleveraging, and  operating leverage driven by growth opportunities.
  • Reasonably valued – Compounding FCF per share double digits and reasonable valuation underpinned by secular growth prospects and stable recurring revenue


Sarah Kanwal

Equity Analyst, Director


Direct: 617.226.0022

Fax: 617.523.8118


Crestwood Advisors

One Liberty Square, Suite 500

Boston, MA 02109

www.crestwoodadvisors.com


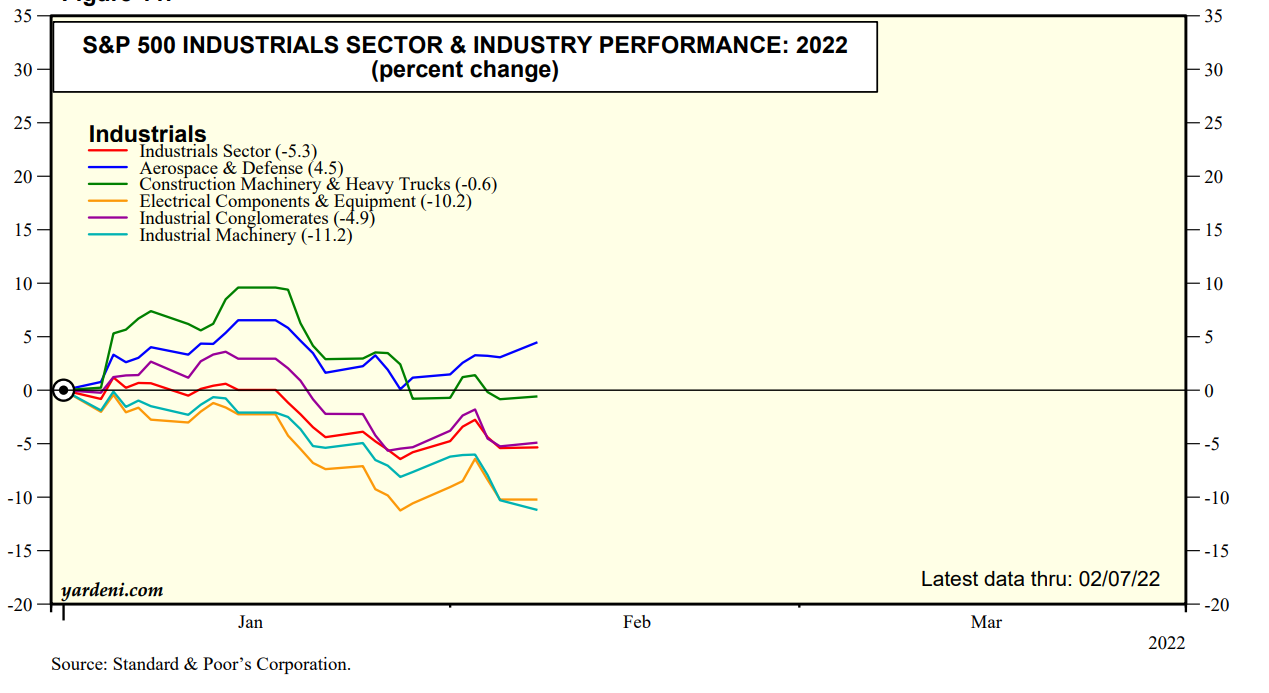
Industrials commentary & #researchtrade

Following a tumultuous week in industrials, I wanted to add some colors on why we are underperforming in our Select Equity industrials portfolio and some actions we are taking:


  • Adding 50bps each in HON and XYL from cash/IVV: long-term thesis and drivers are still in place; we expect to see a recovery in aerospace (HON) and continued spending by utilities towards clean water across the globe (XYL). Recent supply chain issues are temporary.
  • Both should see their multiples expand as they see base business recover from recent turbulences & monetize their growing software offerings over time
  • On a DCF basis, HON and XYL have the most upside from current levels


Why is our Industrial sector underperforming?

  • Highly cyclical names have outperformed since early 2021 (airlines / construction)
    • We don’t have highly cyclicals names in industrials portfolio
    • XYL, ST, FTV and HON are high quality names with good growth drivers


  • “green” stocks have underperformed (after outperforming in 2020) – in part due to:
    • Rising interest rates (inflation) means higher cost of doing business for non-profitable businesses is tough to weather (think solar/renewable energy companies)
    • Investor getting out of those names into more cyclical companies: I think XYL was thrown out with the bath water – our worst performer YTD in Industrials
      • Multiple contraction & delay in transforming orders into sales due to supply chain issues


  • Defense names have done better due to Russia/Ukraine fear. Reminder that LMT top line and FCF profile is not as attractive as it was pre-2021: expect top line decline in 2022 and low 2% growth in 2023 with FCF drop in 17% drop in FCF in 2022 and 2% growth in 2023…not exciting

Chart  Description automatically generated


Julie S. Praline

Director, Equity Analyst


Direct: 617.226.0025

Fax: 617.523.8118


Crestwood Advisors

One Liberty Square

Suite 500

Boston, MA 02109


www.crestwoodadvisors.com