As a reminder, a key function of the PBM is to leverage scale and competition to reduce drug costs for clients. PBM keep up to 10% of the “saving”, although CVS mentioned being closer to 5%. Per Goldman Sachs, the rebates business represents a mid-single digit % of its EBITDA. Below is Goldman’s calculation:
 image001.png@01D41F46.8B1A85D0“>
· Full year EPS and SSS guidance raised. Full year EPS guidance is $4.12 at the midpoint vs $4.07 previously (excluding benefit from a lower tax rate).
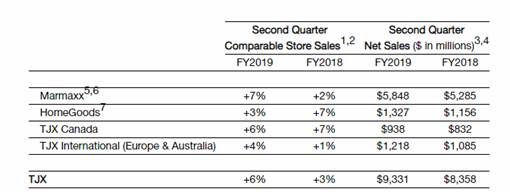
· SSS now expected to be +3-4% vs +1-2% previously (in their 40+ yr. history they’ve had only 1 year of negative SSS).
· They again made a point about their ability to attract a younger customer to validate the sustainability of their business model. “We are particularly pleased that we have been attracting a significant share of millennial and Gen Z shoppers among our new customers”…”the majority of new customers at Marmaxx, are these younger customers which indeed bodes very well for our future.” There were several minutes of discussion around this, so they must be getting a lot of questions from investors.
· Merchandise margin was down, but would have been up significantly excluding freight costs – i.e. they are not “buying” this better growth with deeper discounts. Inventory grew in line with sales, a positive indicator for future merchandise margins.
[more]

QUARTER ENDED PAYMENT VOLUME (billions)

QUARTER ENDED TRANSACTIONS (millions)

Valuation:
· FCF for the quarter was $3.5B and YTD is $8.7B. Trading at a 4% FCF yield.
· They’ve returned most of their YTD FCF to shareholders through dividends ($1.5B) and buybacks ($5.55B). They have $5.8 billion remaining for share repurchase.
· For revenue beats: REITs, Industrials and utilities have had the highest % surprise.
· According to FactSet, the market is rewarding upside earnings surprises less than average and punishing downside earnings surprises more than average.
· For all of 2018, analysts are projecting earnings growth of 19.5% and revenue growth of 7.2%.
· Forward P/E Ratio is 16x – it was 16.4x at the beginning of the year. The 5-year average is 16.1x and the 10-Year average is 14.3x.
·
· [more]
· 
·
· increased household formation. Rising prices tend to increase remodeling activity and spur new housing starts both of which benefit SHW. Historically, architectural paints is a good leading indicator of industrial paint demand, which means the overall LT demand picture for SHW looks robust. In addition to this, their margins will improve as they increasingly pass on rising input costs and they realize synergies from the Valspar acquisition.
·
· 
John R. Ingram CFA
Managing Director
Asset Allocation and Research
Direct: 617.226.0021
Fax: 617.523.8118
Crestwood Advisors
One Liberty Square
Suite 500
Boston, MA 02109
