Berkshire Hathaway Q4 results

On 2/25, Berkshire Hathaway released their 2021 Q4 results and Warren Buffett’s letter to shareholders.   Annual letter from Buffett is attached.

Key takeaways from the quarter are as follows:


  • Berkshire reported $7.28b operating earnings versus $5.02b from prior year, up 20.4%
  • Buffett repurchased $6.8b of shares in Q4 and $27.1b for 2021 representing 3.7% of shares  
  • Cash and shares of Apple represent 40% of value of firm. 


Current Price: $330                         Price Target: $370 (raised from $330)

Position Size: 3.6%                          TTM Performance: 26.9%


Highlights from quarter – solid cyclical rebound

  • Railroads – YoY revenue rose 11.6% and earnings rose 13.3%
  • Berkshire energy – YoY revenue up 9.6% and earnings up 15.7%
  • Manufacturing, service and retail – Profits rose 22.9% YoY
  • Insurance revenues rose 4.29% and profits fell -2.3% YoY though BRK’s insurance profits are very lumpy.


Greg Abel, Buffett’s appointed successor, published a note on Berkshire’s ESG endeavors in the appendices of the annual report. 

  • They target cutting BHE’s greenhouse emissions from a baseline of 80 metric tons to 40 in 2030.
  • Berkshire Hathaway Energy will retire 16 coal units between 2022-2030 and all coal units by 2049 achieving net zero emissions by 2050!
  • For Burlington Northern Santa Fe, they target a 30% reduction in greenhouse gases by 2030.


Valuation:  Berkshire is selling at a 15% discount to intrinsic value using sum of the parts.  Their cash of $145b and Apple representing $150b comprises 40% of the company’s valuation. 
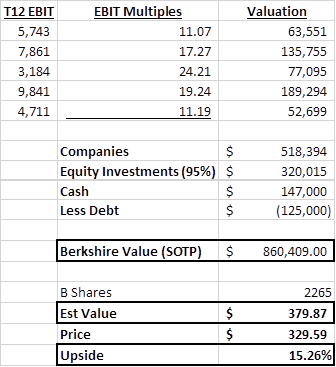


Berkshire’s top 5 holdings:


Berkshire remains a core holding, is currently undervalued, defensively positioned and cyclically sensitive to the economic recovery.


Please let me know if you have any questions.


Thanks,

John


($brk/b.us)


John R. Ingram CFA

Chief Investment Officer

Partner


Direct: 617.226.0021

Fax: 617.523.8118


Crestwood Advisors

One Liberty Square

Suite 500

Boston, MA 02109

www.crestwoodadvisors.com


S&P Global Q4 Results

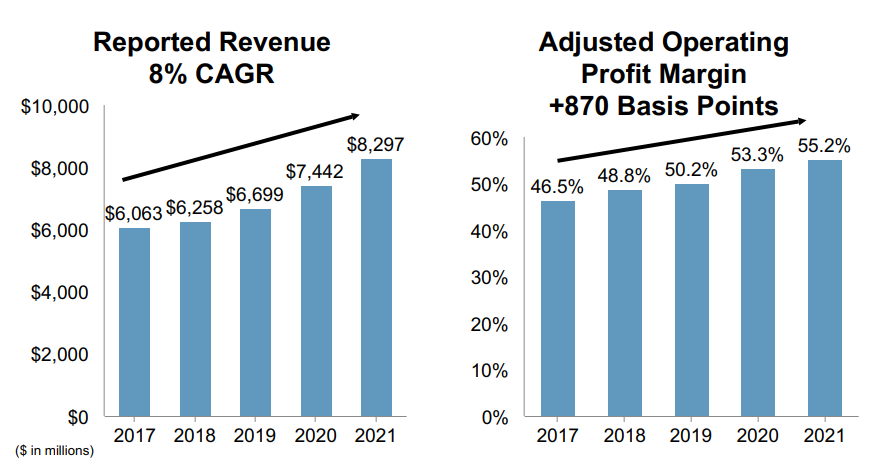
On 2/8, S&P Global announced Q4 earnings with revenue up 12% and adj EPS up 17%, which was a slight beat over expectations.  Key takeaways are:

  • S&P Revenue up 12% with solid growth in all four segments
  • Generated $3.5b in free cash flow, yielding 3.72%
  • Operating margins expanded 190 basis points to 53.2%
  • Expect IHS Markit merger to close Q1 2022. 
  • Raising slight market angst, SPGI did not issue guidance for 2022 as they will wait until after mergers closes.


Current Price: $407.29                      Price Target: $480

Position Size:   2.82%                         12 Month Performance: +23.7%


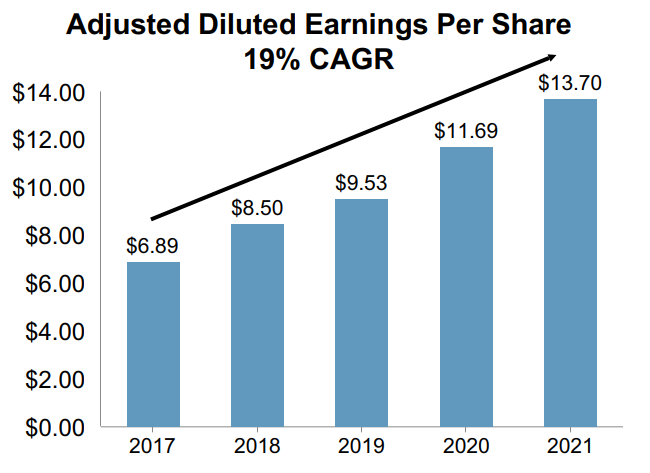
Chart, bar chartDescription automatically generated

Chart, bar chartDescription automatically generated


2021 Q4 Highlights:

  • S&P Dow Jones Indices
    • Asset-linked fees ETF AUM increased up 40%!
    • Revenues benefited from strong price appreciation and inflows
    • Revenue grew 16% and operating profit rose 17% Y/Y
    • Margins rose +80 bps to 69.9%
  • Ratings
    • Global bond issuance increased 15%, with strong growth in high yield, Bank Loans and CLOs
    • YoY revenue grew 14% and operating profit rose +17%
    • Margins rose +180 bps to 64.2%
    • Non-transaction revenue (not related to bond issuance) is over 40% of ratings revenue
  • Market Intelligence
    • Revenue grew +7% Operating profit rose +13%
    • Margins increased +190 bps to 34.3%
  • Platts
    • Revenue grew +8% and operating profit rose +9%
    • Margins increased +40 bps to 55.1%


IHS Markit merger update

  • IHS Markit will divest OPIS, Coal, Metals & Mining (CMM), and PetroChem Wire businesses to News Corp and Base Chemicals business
  • S&P Global will divest CUSIP Global Services and Leveraged Commentary and Data, together with a related family of leveraged loan indices.
  • Despite divestitures, S&P has raised cost synergies to $530m-$580m (from $480m) and revenue synergies to $330m-$360m (from $350m)

Growth initiatives

  • Implementing new ESG offerings across platform – ESG revenues up 40%
  • Technology expertise – Kensho AI initiatives
    • RiskGuage, ProSpread, Riskcasting Indices, Moonshot index, Kensho Scribe and many others combining data and analytics
  • Merger with IHS Markit

Capital allocation

  • SPGI has a current yield of .78%
  • SPGI has repurchased 14% of outstanding shares over past 5 years
  • Currently, share buybacks are on hold with the pending merger of IHS Markit.  SPGI has $6.5b of cash piled up on the balance sheet and generated $3.5b in free cash in 2021.  Expect ~85% to be returned to shareholders post-merger. Could repurchase 5%-6% of shares!


S&P Global Investment Thesis:

  • S&P Global is a highly profitable company that has established businesses with deep moats in attractive industries
  • S&P Global is focused on shareholders and returns 75% of free cash flow in dividends and share buybacks
  • Over the past several years, S&P Global has demonstrated an enviable history of revenue growth and margin expansion
  • With the merger of IHS Markit, S&P Global will combine many unique data sources, enhance data analytics capabilities, and broaden addressable markets.


Please let me know if you have any questions.


Thanks,

John


[category Equity Earnings]

[tag SPGI]

$SPGI.US


John R. Ingram CFA

Chief Investment Officer

Partner


Direct: 617.226.0021

Fax: 617.523.8118


Crestwood Advisors

One Liberty Square

Suite 500

Boston, MA 02109
www.crestwoodadvisors.com


Schwab’s Q4 results – strong 2021

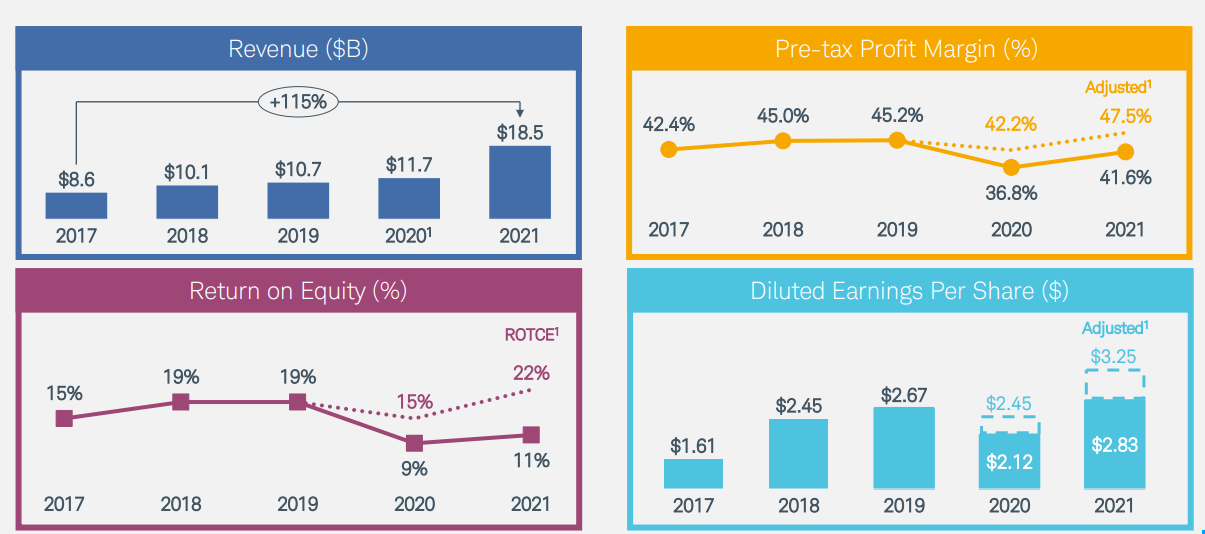
On 1/28, Schwab hosted their Winter Update detailing quarterly earnings and outlook.  Schwab Q4 were excellent showing continued strong asset growth and good expense control.

  • Strong new asset growth of 8% – $550b for 2021, showing strength of Schwab’s platform
  • Profitable franchise – pre-tax margin of 47.5% and ROTE of 22%
  • Earnings are highly levered to short-term interest rates – 25 basis point increase in Feds Funds rate will increase earnings 4%-5% over following 12 months!


Current Price: $91.9                         Price Target: $105 (increased from $90)

Position Size:   2.53%                       Performance TTM: 68.2%


Schwab is building scale and platform as a premier asset gather. 

  • Total client assets of $8.1t
  • Active brokerage accounts 33.2m
  • 200%+ increase of net flows into Schwab fund products and managed solutions


Delivered record financial results


Graphical user interfaceDescription automatically generated


Expenses

  • Expected to grow 6%-7% in 2022 of which 3.5%-4.0% for integration-driven hardware and software build.
  • Through merger with TD Ameritrade, SCHW expects $1.8b-$2.0b in expense savings over next 3 years, which equates to ~20% of total expenses.


Profitability – industry leader

  • Adjusted ROE of 22% and pre-tax profit margin of 47.5%.  Expect margins to continue to expand over the next 2-3 years due to cost savings and scale from the mergers
  • Current expenses are elevated due to mergers


Capital allocation

  • Schwab plans to build capital on the balance sheet due to rising deposits and mergers, which may temper share buybacks.
  • Dividend yield of 0.75%


Schwab Thesis:


  • Expect Schwab’s vertically integrated business model to drive AUM growth.  Schwab has averaged 6% organic core net new asset growth as retail clients and advisors are attracted to Schwab’s low-cost trading and custody services.
  • Conservative, well-managed firm who is a leader in online trading and focused on leveraging platform. 
  • Schwab has experience material AUM growth with USAA and TD Ameritrade mergers.  Expect SCHW to reduce costs and continue to leverage platform.


Please let me know if you have questions.

Thanks,

John


[category Equity Earnings]

[tag SCHW]

$SCHW.US


John R. Ingram CFA

Chief Investment Officer

Partner


Direct: 617.226.0021

Fax: 617.523.8118


Crestwood Advisors

One Liberty Square

Suite 500

Boston, MA 02109
www.crestwoodadvisors.com


Bank of America Q4 results

On 1/19, Bank of America (BAC) reported strong Q4 EPS of $.82 ahead of estimates of $.76.  Highlights for the quarter were 12% Net Interest Income growth, deposit growth of 15% and ROTE of 17.0%. BAC’s earnings remain levered to rising interest rates – a 100 basis point increase in yields would increase NII $6.5b. 


Current Price: $44.5                         Price Target: $52 (raised from $50)

Position Size:   3.5%                         Trailing 12-month Performance: 43.9%


Highlights:

  • Revenue growth of +10% to $22.1b  
  • Deposits continued their strong growth  +15% YOY
  • Strong metrics for loan quality throughout pandemic. BAC had a historically low loss ratio of 15 basis points.
  • For the year, repurchased $25.1b of shares and dividends of $6.6b for a shareholder yield of 8.4%.
  • Good expense control

Outlook:

  • Set expectations for flat expense growth for 2022.
  • Expects strong loan growth, and balances should return to pre-pandemic levels
  • Net Interest Margin (NIM) fell slightly to 1.67% and should begin to recover with rate hikes. 
  • 100 basis point shift in yield curve will increase NII by $6.5b over next 12 months


  • Deposits have grown 16% YOY
    • Grew deposits by $270b in 2021!
    • BAC ranked #1 in deposit share
    • BAC pays just .05% on deposits

Chart, bar chart  Description automatically generated

  • BAC has managed the pandemic well with strong credit performance.
    • Net charge-offs only 0.15% of loans, which is a 50-year low.  Last year this ratio peaked at 0.45%.  For comparison during 2010, the charge-off ratio peaked at 3.8% showing the relative severity of the Great Recession and the current strength of the U.S. banking system.

BAC Thesis:


  • Over the years BAC has dramatically improved their Consumer Banking unit, leveraging technology and their digital platforms which has improved margins and driven earning’s growth. 
  • BAC has a high-quality loan book which was seen during the pandemic as loan loss metrics were best among peers
  • BAC has strong earnings power, generating over $5b a quarter in earnings
  1. BAC continues to build capital which should lead to increased dividends and buybacks
  2. BAC’s earnings are sensitive to rate increases. 


Please let me know if you have questions.

Thanks,

John


[category Equity Earnings]

[tag BAC]

$BAC.US


John R. Ingram CFA

Chief Investment Officer

Partner


Direct: 617.226.0021

Fax: 617.523.8118


Crestwood Advisors

One Liberty Square

Suite 500

Boston, MA 02109
www.crestwoodadvisors.com


S&P Global (SPGI) Q3 Earnings report

On 10/26, S&P Global announced impressive Q3 earnings with revenue up 13% and operating profit up 18%.  S&P also raised 2021 EPS guidance.  Key takeaways are:

  • Dow Jones Indices had a blowout quarter with revenue up 28% and margins up 660 bps!
  • S&P Revenue up 13% with solid growth in all four segments
  • Expense growth of 7%
  • Operating margins expanded 250 basis points to 55.4%
  • Expect IHS Markit merger to close Q1 2022 after some divestitures


Current Price: $462.60                      Price Target: $480 (raised from $450)

Position Size:   3.10%                         Performance since add on 2/3/21: +43.5%


2021 Q3 Highlights:

  • S&P Dow Jones Indices
    • Asset-linked fees were up 36%! YoY ETF AUM up 43%!
    • Revenues benefited from strong price appreciation and inflows
    • Strong growth in index fees – ETF AUM was $2.4t up 51% Y/Y
    • Revenue grew 28% and operating profit rose 40% Y/Y
    • Margins rose +660 bps to 69.2%
  • Ratings
    • Global bond issuance increased 3%, with strong growth in high yield, Bank Loans and CLOs
    • YoY revenue grew 14% and operating profit rose +17%
    • Margins rose +160 bps to 63.4%
    • Non-transaction revenue (not related to bond issuance) is over 40% of ratings revenue
  • Market Intelligence
    • Revenue grew +7% Operating profit rose +13%
    • Margins increased +190 bps to 35.7%
  • Platts
    • Revenue grew +8% and operating profit rose +5%
    • Margins decreased -110 bps to 54.6%


IHS Markit merger update

  • Closing target Q1 2022 from second half 2021
  • IHS Markit will divest OPIS, Coal, Metals & Mining (CMM), and PetroChem Wire businesses to News Corp and Base Chemicals business
  • S&P Global will divest CUSIP Global Services and Leveraged Commentary and Data, together with a related family of leveraged loan indices.
  • Despite divestitures, S&P has raised cost synergies to $530m-$580m (from $480m) and revenue synergies to $330m-$360m (from $350m)

Growth initiatives

  • Implementing new ESG offerings across platform – ESG revenues up 40%
  • Technology expertise – Kensho AI initiatives
    • RiskGuage, ProSpread, Riskcasting Indices, Moonshot index, Kensho Scribe and many others combining data and analytics
  • Merger with IHS Markit

Capital allocation

  • SPGI has a current yield of .67%
  • SPGI has repurchased 14% of outstanding shares over past 5 years
  • Currently, share buybacks are on hold with the pending merger of IHS Markit.  SPGI has $5.8b of cash piled up on the balance sheet.  Expect some of  this excess cash and ~85% of annual free cash flow to be returned to shareholders post-merger.


S&P Global Investment Thesis:

  • S&P Global is a highly profitable company that has established businesses with deep moats in attractive industries
  • S&P Global is focused on shareholders and returns 75% of free cash flow in dividends and share buybacks
  • Over the past several years, S&P Global has demonstrated an enviable history of revenue growth and margin expansion
  • With the merger of IHS Markit, S&P Global will combine many unique data sources, enhance data analytics capabilities, and broaden addressable markets.


Please let me know if you have questions.

Thanks,

John


[category Equity Earnings]

[tag SPGI]

$SPGI.US


John R. Ingram CFA

Chief Investment Officer

Partner


Direct: 617.226.0021

Fax: 617.523.8118


Crestwood Advisors

One Liberty Square

Suite 500

Boston, MA 02109

www.crestwoodadvisors.com


Schwab (SCHW) Q3 earning report

On 10/21, Schwab hosted their Fall Update detailing quarterly earnings and outlook.  Schwab Q3 results showed continued strong asset growth, good expense control and earnings above estimates.

  • Strong new asset growth of 8% – $396b YTD, showing strength of Schwab’s platform
  • Profitable franchise – pre-tax margin of 44.0% and ROE of 12%
  • Earnings are highly levered to short-term interest rates – 25 basis point increase in Feds Funds rate will increase earnings 4%-5% over following 12 months!


Current Price: $83.6                         Price Target: $90 (increased from $78)

Position Size:   2.72%                       Performance TTM: 109%!


Schwab is building scale and platform as a premier asset gather. 

  • YTD Schwab recorded 5,988k new brokerage accounts in the first half of this year 
  • Schwab is succeeding with millennials.  60% of new-to-firm households were under the age of 40.

Expenses

  • Versus last quarter, total expenses are down -8%.
  • Through merger with TD Ameritrade, SCHW expects $1.8b-$2.0b in expense savings over next 3 years, which equates to ~20% of total expenses.


Quarter over Quarter revenue was up +1%


Graphical user interface, application, WordDescription automatically generated


Profitability – industry leader

  • ROE of 12% and pre-tax profit margin of 44%.  Expect margins to continue to expand over the next 2-3 years due to cost savings and scale from the mergers
  • Current expenses are elevated due to mergers

Capital allocation

  • Schwab plans to build capital on the balance sheet due to rising deposits and mergers, which may temper share buybacks.
  • Dividend yield of 1.05%


Schwab Thesis:


  • Expect Schwab’s vertically integrated business model to drive AUM growth.  Schwab has averaged 6% organic core net new asset growth as retail clients and advisors are attracted to Schwab’s low-cost trading and custody services.
  • Conservative, well-managed firm who is a leader in online trading and focused on leveraging platform. 
  • Schwab has experience material AUM growth with USAA and TD Ameritrade mergers.  Expect SCHW to reduce costs and continue to leverage platform.


Please let me know if you have questions.

Thanks,

John


[category Equity Earnings]

[tag SCHW]

$SCHW.US


John R. Ingram CFA

Chief Investment Officer

Partner


Direct: 617.226.0021

Fax: 617.523.8118


Crestwood Advisors

One Liberty Square

Suite 500

Boston, MA 02109

www.crestwoodadvisors.com


Bank of America’s Q3 earnings

On 10/14, Bank of America (BAC) reported strong Q3 EPS of $.85 ahead of estimates of $.71.  Highlights for the quarter were 12% revenue growth, declining expenses and ROTE of 15.8%. BAC’s earnings remain levered to rising interest rates – a 100 basis point increase in yields would increase earnings $7.2b or 8%. 


Current Price: $46.4                         Price Target: $50 (raised from $40)

Position Size:   2.62%                       Trailing 12-month Performance: 96%


Highlights:

  • Revenue growth of 12% to $22.8b
  • Deposits continued their strong growth – 15% YOY
  • Strong metrics for loan quality throughout pandemic. BAC had a loss ratio of 20 basis points the lowest in 50 years.
  • Over $26b of excess capital – returned $12b to shareholders in Q3.
  • Good expense control with noninterest expenses down 4% QOQ
  • Loan growth turned positive, growing 6% QOQ.  In prior quarters, loan growth was negative due to high levels of mortgage refinancing.
  • Net Interest Margin (NIM) rose to 1.93% from 1.83%, but remains depressed due to low interest rates. 


  • Deposits have grown 14% YOY
    • BAC ranked #1 in deposit share
    • Fiscal stimulus programs have supported consumers
    • BAC pays just .03% on deposits

Chart, bar chartDescription automatically generated

  • BAC has managed the pandemic well with strong credit performance.
    • Net charge-offs only 0.20% of loans, which is a 50-year low.  Last year this ratio peaked at 0.45%.  For comparison during 2010, the charge-off ratio peaked at 3.8% showing the relative severity of the Great Recession and the current strength of the U.S. banking system.
  • Excess capital
    • In Q2, BAC announce a $25b share repurchase program which is worth 7.5% of outstanding shares. 
    • Returned $11.6b to shareholders with $9.9b in share repurchases.  Dividend yield is 1.80% and shareholder yield is above 10%

BAC Thesis:


  • Over the years BAC has dramatically improved their Consumer Banking unit, leveraging technology and digital platforms which has improved margins and driven earning’s growth. 
  • BAC has a high-quality loan book which was seen during the pandemic as loan loss metrics were best among peers
  • BAC has strong earnings power, generating over $5b a quarter in earnings
  • BAC continues to generate excess capital which should lead to increased dividends and continued share buybacks
  • BAC’s earnings are sensitive to rate increases. 


Please let me know if you have questions.

Thanks,

John


[category Equity Earnings]

[tag BAC]

$BAC.US


John R. Ingram CFA

Chief Investment Officer

Partner


Direct: 617.226.0021

Fax: 617.523.8118


Crestwood Advisors

One Liberty Square

Suite 500

Boston, MA 02109

www.crestwoodadvisors.com


S&P Global (SPGI) Q2 results

On 7/29, S&P Global announced impressive Q2 earnings with EPS up 6%. 

Key takeaways are:

  • Revenue up 8% to $2.1b
  • Expense growth of 9% as expenses normalized post Q1
  • Strong issuance in high yield, bank loans and CLOs
  • SPGI increased EPS guidance for 2021


Current Price: $426.27                      Price Target: $450

Position Size:   2.95%                         Performance since add on 2/3/21: +32%


2020 Highlights:

  • Ratings (50% of revenue)
    • Revenue grew 7% and trailing four-quarter operating profit rose +30%
    • Margins fell -100 bps to 68.1%
    • Global bond issuance fell -9%, but bank loans and high yield issuance surged +70%
    • Non-transaction revenue (not related to bond issuance) increase 19% Y/Y and is over 40% of ratings revenue
  • Market Intelligence  (26% of revenue)
    • Revenue grew +8% Operating profit rose +11%
    • More than 1/3 of revenue growth was from recent product investments with solid growth across all categories
    • Margins increased +100 bps to 33.4%
  • Platts (11% of revenue)
    • Revenue grew +9% and operating profit rose +15%
    • Strong growth in all categories with trading services growing 18% over past 10 years
    • Margins increased +170 bps to 55.9%
  • S&P Dow Jones Indices (13% of revenue)
    • Strong growth in index fees – ETF AUM was $2.4t up 51% Y/Y
    • Revenue grew 16% and operating profit rose 7% Y/Y
    • Margins fell -100 bps to 69.2%


Growth initiatives

  • Implementing ESG offerings across platform – ESG revenues up 40%
  • China analytic platform – 22 ratings in 2020 and 25 ratings so far this year
  • Technology expertise – Kensho AI initiatives
    • RiskGuage, ProSpread, Riskcasting Indices, Moonshot index, Kensho Scribe and many others combining data and analytics
  • Merger with IHS Markit remains on track for closure in Q4 of 2021

Capital allocation

  • SPGI has a current yield of .67%
  • SPGI has repurchased 14% of outstanding shares over past 5 years
  • Currently, share buybacks are on hold with the pending merger of IHS Markit.  SPGI has $5.2b of cash piled up on the balance sheet and generated $1.5b in free cash so far this year.  Expect ~75% to be returned to shareholders post merger.


S&P Global Investment Thesis:

  • S&P Global is a highly profitable company that has established businesses with deep moats in attractive industries
  • S&P Global is focused on shareholders and returns 75% of free cash flow in dividends and share buybacks
  • Over the past several years, S&P Global has demonstrated an enviable history of revenue growth and margin expansion
  • With the merger of IHS Markit, S&P Global will combine many unique data sources, enhance data analytics capabilities, and broaden addressable markets.


Please let me know if you have any questions.

Thanks,

John


[category Equity Earnings]

$SPGI.US


John R. Ingram CFA

Chief Investment Officer

Partner


Direct: 617.226.0021

Fax: 617.523.8118


Crestwood Advisors

One Liberty Square

Suite 500

Boston, MA 02109

www.crestwoodadvisors.com


Schwab (SCHW) Q2 Results

On 7/22, Schwab hosted their summer update detailing quarterly earnings.  Schwab continues to attract a wide range of retail investors, which spurred organic growth up 8% or $109B for the quarter.  Quarter over quarter, revenue for the quarter fell -4% as trading revenue fell -21% after Q1’s surge.

  • Strong organic growth of 8% – Schwab has had higher net new asset growth in the first half of this year than any prior full year’s growth!
  • 45% adj pretax margin


Current Price: $68.1                         Price Target: $78

Position Size:   2.19%                       Performance TTM: 105%


Schwab is building scale and platform as premier asset gather. 

  • Transfer ratio of 3 to 1, means that 3x the assets came to Schwab from competitors than left Schwab
  • Schwab recorded 4,810 new brokerage accounts in the first half of this year 
  • Schwab is succeeding with millennials.  70% of new-to-firm households were under the age of 40.

Expenses

  • Total expenses up +1% QOQ due to $200m charge for reserve for potential find on robo advisor disclosures.
  • Through merger with TD Ameritrade, SCHW expects $1.8b-$2.0b in expense savings over next 3 years, which equates to ~20% of total expenses.


Net interest revenue was up +2%

  • Net interest margin of 1.46% down slightly from 1.48%
  • Deposits were $368b down -$1b as clients invested cash into equities and bonds
  • Strong growth in margin lending +38% YOY
  • Schwab’s revenue remains sensitive to interest rate changes
  • Starting in Q3 Schwab is converting over TD Ameritrade cash accounts which will aid growth to deposits by about $10b per month.


Profitability – industry leader

  • ROTCE of 20% and pre-tax profit margin of 44.6%.  Expect margins to continue to expand over the next 2-3 years due to cost savings and scale from the mergers

Capital allocation

  • Schwab plans to build capital on the balance sheet due to rising deposits and mergers, which may temper share buybacks.
  • Dividend yield of 1.05%


Schwab Thesis:


  • Expect Schwab’s vertically integrated business model to drive AUM growth.  Schwab has averaged 6% organic core net new asset growth as retail clients and advisors are attracted to Schwab’s low-cost trading and custody services.
  • Conservative, well-managed firm who is a leader in online trading and focused on leveraging platform. 
  • Schwab has experience material AUM growth with USAA and TD Ameritrade mergers.  Expect SCHW to reduce costs and continue to leverage platform.


Please let me know if you have any questions.

Thanks,

John


[category Equity Earnings]

$SCHW.US


John R. Ingram CFA

Chief Investment Officer

Partner


Direct: 617.226.0021

Fax: 617.523.8118


Crestwood Advisors

One Liberty Square

Suite 500

Boston, MA 02109

www.crestwoodadvisors.com


Travelers Q2 earnings

On 7/20, Travelers reported Q2 EPS of $3.45, ahead of estimates of $2.40.  Positives for the quarter were continued pricing gains, higher margins, and ROE of 13.7%.  The strong results were helped by low cat losses, strong investment returns and favorable prior year reserve development.


Travelers is a high quality, disciplined underwriter of insurance that is focused on returning capital to shareholders through dividends and share buybacks. 


Current Price: $147                                Price Target: $170

Position Size:   1.55%                              TTM Performance: +27.4%


Thesis Intact. Key takeaways from the quarter:


1.       Core business results were solid, beating estimates

·         Combined ratio flat YOY at 91.4%

·         Net written premiums increased 8% for quarter

·         Strong pricing with renewal premiums up

o   Business +9.5%

o   Bond & specialty +12.7%

o   Homeowners +8.2%

o   International +6.9%

·         The industry has faced several headwinds – higher cat losses, negative tort trends and falling yields.  As a result, industry wide pricing has been strongest in 10 years.


2.       Total net Investment Income rose $92m QOQ due to strong returns in private equity investments as returns from fixed income were level with last quarter.


3.       Strong financial position

·         Debt to capital ratio of 22.0%

·         Most of debt is long term – just issued a 30yr bond yielding 3.05%

·         98.4% of fixed income portfolio is investment grade with average rating of AA

·         Strong rankings from rating agency relative to peers


4.       TRV continues to return capital with dividend yields 2.38% and shareholder yield over 7%

·         Repurchased 2.6m shares during Q2 for $401m

·         Over past 10 years shares outstanding have fallen by 53%!

·         Management has a long history of employing capital wisely! Instead of investing in mature business with spotty pricing, they have returned excess capital to shareholders


    • Analysts’ concerns remain focused on profitability of their auto insurance and workers compensation units (about 25% of premiums), which were an issue prior to the pandemic.  Travelers has been raising pricing which should improve profitability.


The Thesis on TRV:

·         We expect TRV will be able to grow book value per share in the mid-single digits over the near-medium term, and generate ROE in the 10-14% range

·         Industry leader with disciplined underwriting and investment portfolio track record  

·         Consistent returns in the low to mid double digits

·         Responsible capital allocation and proven desire to act in the best interests of shareholders


Please let me know if you have any questions.

Thanks,

John


[category Equity Earnings]

$TRV.US


John R. Ingram CFA

Chief Investment Officer

Partner


Direct: 617.226.0021

Fax: 617.523.8118


Crestwood Advisors

One Liberty Square

Suite 500

Boston, MA 02109

www.crestwoodadvisors.com