REITs – Recent Underperformance, Still Like the Asset Class

Below I discuss the real estate sector and address the reasons for its recent underperformance. Additionally, I look at REIT performance during periods of rising rates and increased inflation.

Key Takeaways:

1.) Thesis intact – we still like REITs as a long term, strategic asset class that adds diversification to our asset allocation and has opportunity to improve risd-adjusted returns

2.) Performance During Rising Rates – the positive economic backdrop during rising rate environments acts as a tail wind for REITs as they tend to outperform over the full period of rate increases

3.) Inflation Protection – as we begin to see increased inflation, real assets should maintain pricing power

Continue reading “REITs – Recent Underperformance, Still Like the Asset Class”

CCI Down as Sprint/T-Mobile Merger Talks Ramp Up

CCI traded down today as talks of a possible S/TMUS merger continued, with indications that a deal could be reached as early as this weekend. This is still speculation and could be held up by disputes over control of the combined company and/or push back by regulators.

I will follow up on Monday when there is more definitive information available, but below is the note that Sarah sent on April 10th after the merger talks first resurfaced (this merger has been discussed and plans collapsed on two different occasions). The worry from analysts is that, currently shared sites may be decommissioned, reducing a revenue source for CCI. There are a number of assumptions and unknowns at this point.

S/TMUS represent approximately 16% and 22% of site rental revenue respectively and have about 6% of overlapping cell sites. Based on a Goldman analysis, if they decommissioned all the overlapping sites as their contracts expired (average of 5-7 years) it looks like the net impact would be ~$8/share. This assumes an NPV on the remaining contract life and that they account for around $0.60 of AFFO. There are a lot off assumptions in that including that if a merger were even approved that they would decommission all their overlapping sites.

$CCI.US

Peter Malone, CFA

Research Analyst

Direct: 617.226.0030

Fax: 617.523.8118

Crestwood Advisors

One Liberty Square

Suite 500

Boston, MA 02109

www.crestwoodadvisors.com

PLEASE NOTE!

We moved! Please note our new location above!

HLMEX – Q1 2018 Commentary

HLMEX – Q1 2018 Commentary

Harding Loevner Institutional Emerging Markets had a strong quarter outperforming its benchmark and a large majority of its peers. The strategy benefited from strong stock selection and remains cautiously optimistic about current synchronized global growth. The team continues to drive alpha through its focus on high quality growth companies.

Continue reading “HLMEX – Q1 2018 Commentary”

Crown Castle International ($CCI.US) Q1 2018: CCI exceeds high end of revenue guidance, falls short of AFFO consensus

Crown Castle International Corp. (CCI) had a strong quarter increasing yoy revenue by over 34%, exceeding the high end of guidance. AFFO per share was up 24% but fell short of broad estimates. Discussing a possible S/MTUS merger, management noted overlapping sites account for about 5% of total revenue. CCI maintains a target dividend growth rate of 7-8% annually. The company continues to work on balance sheet improvement and has reduced its leverage ratio to 5.1x. Investment has been focused on small cell and fiber where they expect long term growth trends to be in the low double digits.

Current Price: $102 TTM Return: 10.4%

Target Price: $125 Position Size: 2%

Continue reading “Crown Castle International ($CCI.US) Q1 2018: CCI exceeds high end of revenue guidance, falls short of AFFO consensus”

TIPS – How they work and our thoughts

For those that have received questions about the relevance of owning TIPS during periods of increasing inflation, I have broken down how they work and why we do not own them at this time.

Conclusion: why we do not currently own TIPS

1.) We do not anticipate annual inflation above 2.14% over next ten years (breakeven at parity)

2.) TIPS performance driven by factors similar to Treasuries

3.) TIPS are an expensive insurance; drastically underperform during periods of low inflation

Continue reading “TIPS – How they work and our thoughts”

S&P 500 Valuations

S&P 500 market valuations (based on forward P/E) have fallen from 20 to 16.7 since the start of 2018.

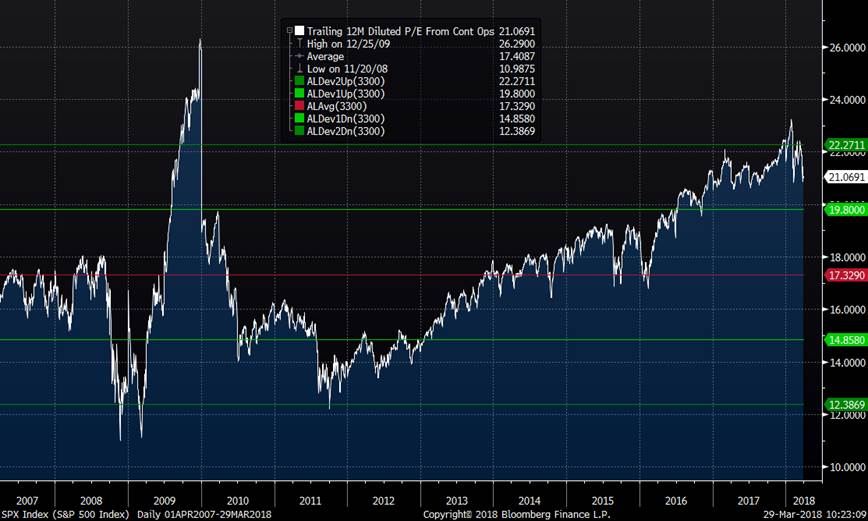
The drop is due to an increase in earnings estimates and drop in market prices (about 2 points). If you look at the below chart which goes back to 2007, the stock market valuation has fallen significantly and is now within one standard deviation of the historical mean.

However, some caution is necessary. The above uses estimated future earnings.

If we look at trailing earnings, the picture is different, as valuations are more than one standard deviation outside of the historical average.

So, markets are closer to average valuation based on the idea that tax cuts and a relatively strong economy will deliver solid earnings growth. Though this expansion is aging, we see no signs of a recession.

Additionally, it appears some of the market froth has been removed. Some of the “less rationale” investments have shown even larger corrections than the broad market – Bitcoin, Tesla and some tech stocks.

This is the type of environment where we should benefit from positions in quality names.

Peter Malone, CFA

Research Analyst

Direct: 617.226.0030

Fax: 617.523.8118

Crestwood Advisors

One Liberty Square

Suite 500

Boston, MA 02109

www.crestwoodadvisors.com

PLEASE NOTE!

We moved! Please note our new location above!

Market Volatility and Sticking to Strategic Allocation

We constantly see different ways to depict the narrative, but I found this interesting. The author uses equity flows as the proxy for investor movements, indicating a “following of the crowd” type scenario.

The simple conclusion drawn from this illustration is that a balanced portfolio that remains balanced over time tends to outperform. The more investors move in and out of cash or “less risky” assets in an attempt to time market movements, the more likely they are to miss out on the upside or lose on the downside.

Continue reading “Market Volatility and Sticking to Strategic Allocation”

MLPs – FERC Ruling

Last week, the Federal Energy Regulatory Commission changed a ruling that will affect the revenue and cash flow for a few MLPs. Below discusses the policy change and what it means for the industry going forward.

The general consensus is that there will be a limited number of companies directly affected by the change, and the market selloff in the space was an overreaction. Nearly all management companies have provided commentary to this point, with the majority downplaying the negative effects of the ruling.

1.) What was the policy change that took place?

On March 15th, the Federal Energy Regulatory Commission (FERC) ruled that FERC regulated MLP owned pipelines can no longer recover the cost of income taxes in setting tariffs on interstate pipelines. Even though MLPs do not pay taxes, they were able to add in the tax rate of shareholders. Airlines fought this rule and won a change to the tax law. Therefore, the rate that MLP owners of FERC regulated natural gas and oil pipelines can charge customers must be lower to solve for the same ROE, reducing some MLPs’ cash flow and dividends.

There are four different price rate methodologies used currently. Only companies using the cost of service method will be affected. The cost of service is the revenue a regulated pipeline must collect from customers to cover its costs to operate. Following the announcement, income taxes will no longer be part of the total cost equation, implying that total cost of service will be lower, thus reducing cash flows from an asset.

2.) Which assets are impacted?

The only pipelines that will be affected are those which are currently regulated by the FERC and cross state borders. Additionally, these assets must use the cost-of-service method for pricing in order for the ruling to have a negative impact.

Management companies have come out and downplayed the effects of the change, noting that only a small portion of assets would be impacted. Based on a few different estimates, a worst case scenario would lead to an approximately 4.5% reduction of income due to decreased pipeline tariffs. Below is a flow chart showing the assets that will be negatively affected.

3.) How will TORIX be affected and what are their thoughts moving forward?

Looking at their holdings, Tortoise estimates the EBITDA reduction will be 2% or less. These numbers are based on current EBITDA and do not account for any new projects. Because new projects have tended to use market-based rates, they would generally not be affected by the ruling.

Tortoise MLP and Pipeline fund holds 25% (or less) of MLPs and owns 75% (or more) of C-Corp companies, so they have lower exposure to MLPs than the Alerian Index which is 100% MLPs. If a pipeline is publicly owned, it can be structured as a MLP (Master Limited Partnership) or a regular corporation (C-Corp). MLPs have a tax advantage when raising capital as the MLP does not pay taxes and can yield more.

This FERC tax rule change and Trump’s Tax Cuts and Jobs Act of 2018 have reduced the tax efficiency of MLPs relative to C-Corp firms, but have not eliminated the advantage. Depending on a MLP’s assets and finances, it may make sense for some of them to convert into C-Corps. Tortoise can own MLPs or C-Corps and can take advantage of any mispricing around potential changes in corporate structure.

With the selloff in the MLP space last week, we believe that Midstream energy company valuation are very compelling and continue to offer attractive yields. The yield of the Alerian MLP index is now at approximately 8.5%, which is compelling given REIT and utility yields are below 4%. While TORIX yield (3.16%) is lower than AMJ’s, the fund has outperformed the index by over 30% during the past two calendar years, showing the benefits of owning C-Corp midstream firms.

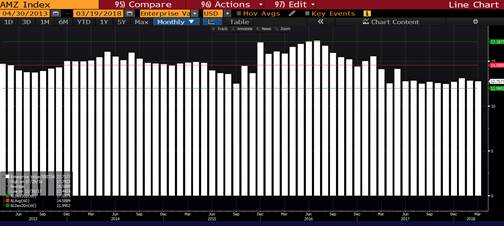
Currently, these tax law changes have placed a cloud over MLPs and the midstream energy space for investors. Despite this fog, fundamentals remain strong as the price of oil is above $60, gas and oil volumes continue to grow and MLP enterprise value to EBITDA valuation is attractive (see below charts). While we are disappointed in year-to-date performance, we are being patient and waiting for investor sentiment to improve.

US production of crude oil and natural gas has been strong:

MLP valuations remain low – close to 2 standard deviations below the mean:
Peter Malone, CFA

Research Analyst

Direct: 617.226.0030

Fax: 617.523.8118

Crestwood Advisors

One Liberty Square

Suite 500

Boston, MA 02109

www.crestwoodadvisors.com

PLEASE NOTE!

We moved! Please note our new location above!

JP Morgan Guide to Retirement 2018

From: Peter Malone
Sent: Tuesday, March 20, 2018 9:46 AM
To: CrestwoodAdvisors <crestwoodadvisors@crestwoodadvisors.com>
Subject: JP Morgan Guide to Retirement 2018

Good Morning,

Attached is the 2018 JP Morgan Guide to Retirement. As always, JPM provides so much useful content, and this piece is extremely relevant to all areas within the Crestwood team.

I have included just four graphics that stuck out to me but would recommend looking through the full presentation whenever you have the chance.

Continue reading “JP Morgan Guide to Retirement 2018”