AQR Market Neutral – Q3 2018 Review

In the Q3 review for Equity Market Neutral, AQR reiterated how they look at their four investment themes, broke down performance attribution, and further discussed how to address the underperformance of value.

I summarize these three topics below, and I have attached a new one-page piece they created that provides a look at performance, market environment, and outlook.

Continue reading “AQR Market Neutral – Q3 2018 Review”

LISIX – Q3 2018 Commentary

LISIX – Q3 2018 Commentary

While the international developed market has struggled, Lazard International Strategic Equity was up almost 1.5% through the end of September. The team has made a strong turnaround in the past year, ranking in the top decile relative to peers during that period. Lazard believes that its focus on selecting quality, high growth stocks should help the strategy to continue outperforming.

Continue reading “LISIX – Q3 2018 Commentary”

MWTIX – Q3 2018 Commentary

MWTIX – Q3 2018 Commentary

MetWest Total Return Bond Fund performed in line with the Agg during the quarter. Slightly longer duration was a headwind during the period, while the strategy benefited from its allocation to non-agency MBS. Given that we are nearing the end of the credit cycle, the team is generally cautious and favors more quality investments including less cyclical credit and certain asset backed sectors.

Continue reading “MWTIX – Q3 2018 Commentary”

By the Numbers – Market Perspective and Cost of Living

Good Afternoon,

Attached is the most recent “By the Numbers” piece put out by MFS. The stats I point out below put the size of the S&P 500 into perspective and show how cost of living after retirement can unfortunately increase quite drastically.

“When the S&P 500 fell 58 points on “Black Monday” (10/19/87), the tumble represented a fall of 20.5%. A 20.5% decline on last Friday’s (10/19/18) closing index value of 2768 would equate to a fall of 567 points. The largest drop for the index this year has been 113 points (source: BTN Research).”

“The national median cost in 2017 for an assisted living facility (private 1-bedroom accommodation) was $3,750 per month or $45,000 per year (source: Genworth).”

The idea that markets have “fallen X amount of points” is often an easy headline to catch the attention of the average investor. Obviously, it is human nature to hear that markets have fallen 58 points and have a negative reaction. It is our job to temper client reactions by noting that such a drawdown is less than 2% and, while not frequent, such occurrences happen every year and often multiple times.

Another difficult teaching moment for investors is the idea that, later in life, cost of living can increase. The cost of assisted living facilities continues to increase and insurance coverage (or help from children, relatives, charity, etc.) will vary from one individual to the next. This will emphasize the need to grow the nest egg over time by remaining invested in a broadly diversified portfolio built to fit their risk/return profile.

Thank You,

Pete

Peter Malone, CFA

Research Analyst

Direct: 617.226.0030

Fax: 617.523.8118

Crestwood Advisors

One Liberty Square

Suite 500

Boston, MA 02109

www.crestwoodadvisors.com

BTN 10-22-18.pdf

Crown Castle International ($CCI.US) Q 2018: Positioned well for 2019

Crown Castle International Corp. (CCI) had another strong quarter, outpacing guidance and expectations for revenue and AFFO per share. CCI introduced slightly higher guidance for revenues and adjusted EBITDA for the remainder of the calendar year. The company increased its annual dividend to $4.50, a 7% increase YoY. Growth in the towers space continues to be driven by consumer demand for data which leads to investment by mobile carriers. Within the space, CCI is best positioned to take care of carrier needs across towers and small cell/fiber. CCI’s investment in small cells and fiber are performing better than expected and the company’s margins should continue to improve as they increase colocation on their newly developed small cells.

Current Price: $107 TTM Return: 11.1%

Target Price: $125 Position Size: 2%

Continue reading “Crown Castle International ($CCI.US) Q 2018: Positioned well for 2019”

SSGA Chart Pack – Active Managers and Term Premiums

Good Afternoon,

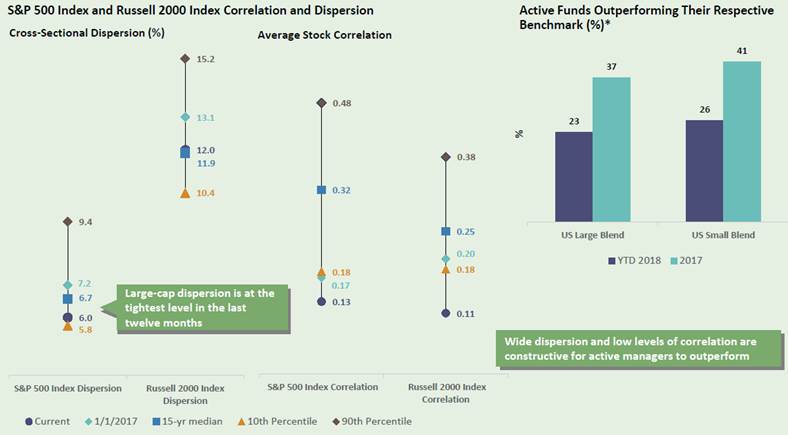
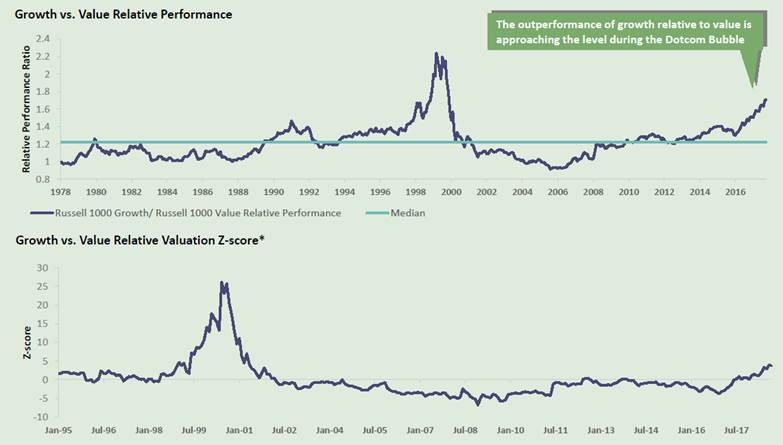
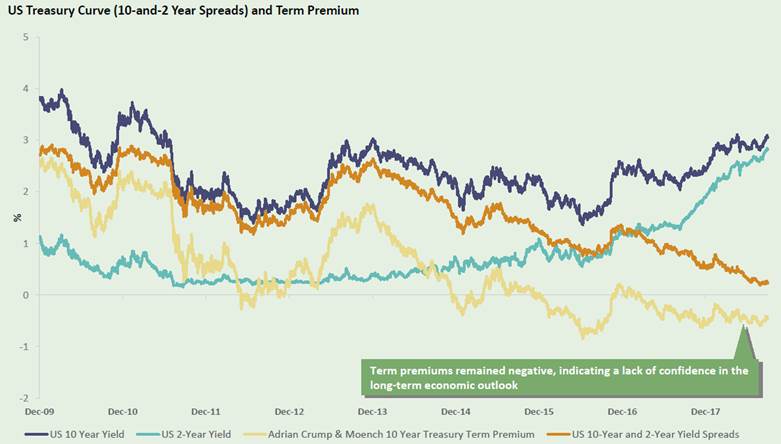
I have attached the most recent “Chart Pack” put together by SSGA. I included three charts that stood out to me.

Active Managers – return dispersion contracting relative to 2017; higher correlations and less dispersion make it harder to outperform

Growth vs. Value – outperformance of growth approaching level seen in 2000 during Dotcom Bubble

U.S. Treasury Curve – The Fed keeps lifting the short end of the curve while negative term premiums weigh on long end

Here is a link to an article from the NY Fed discussing term premiums if anybody is interested in digging a bit deeper:

http://libertystreeteconomics.newyorkfed.org/2014/05/treasury-term-premia-1961-present.html

Peter Malone, CFA

Research Analyst

Direct: 617.226.0030

Fax: 617.523.8118

Crestwood Advisors

One Liberty Square

Suite 500

Boston, MA 02109

www.crestwoodadvisors.com

By the Numbers – educating the young and the old

Good Morning,

Attached is the updated “By the Numbers” piece from MFS. The statistics that I highlighted this week deal with the client education of Millennials and individuals approaching retirement.

“A greater percentage of Millennials have all of their pre-tax retirement money invested in cash and bonds (20%) than those that have all of their pre-tax retirement money invested in stocks (19%). 2,593 Millennials (ages 20-36 in 2017) were surveyed in the 4th quarter 2017” (source: Transamerica Retirement Survey).

“A 65-year old American male in 2018 is expected to live another 19.2 years (to 84.2 years old), an increase of 5 years in the last 40 years. A 65-year old American female in 2018 is expected to live another 21.6 years (to 86.6 years old), an increase of 3 years in the last 40 years” (source: Social Security Administration).

I found these facts interesting because they are quite relevant to one another despite their differing subjects. This suggests that the long term investment horizon of younger generations is expanding and the ability to take on risk early in your working years is ample. Our ability to educate clients on the long term path to retirement savings will be a value add throughout a client’s investable time horizon.

Thanks,

Pete

Peter Malone, CFA

Research Analyst

Direct: 617.226.0030

Fax: 617.523.8118

Crestwood Advisors

One Liberty Square

Suite 500

Boston, MA 02109

www.crestwoodadvisors.com

BTN 10-8-18.pdf

By the Numbers – Client Education & Wage Increases

Attached is this week’s version of “By the Numbers” from MFS. The two facts below touch upon the average investor’s understanding of equity markets and a clarification of total employee compensation.

“48% of 2,000 American adults surveyed in August 2018 thought the US stock market had been flat over the last 10 years. Another 18% of the 2,000 folks surveyed thought the US stock market had declined over the last 10 years” (source: Betterment).

“For every $1 spent for wages and salaries in the private sector, employers spend an additional 44 cents on benefits. Average compensation is $23.78 per hour while the cost of benefits averages an additional $10.41 per hour” (source: Bureau of Labor Statistics).

What I find most interesting about the 48% stat is the source, Betterment. This is one of the larger unaffiliated Robo-Advisors showing that investors are often unaware of what is taking place in the market. This simple client education is something that can be provided by a full service Investment Advisor much more effectively than a web-based robo platform.

Peter Malone, CFA

Research Analyst

Direct: 617.226.0030

Fax: 617.523.8118

Crestwood Advisors

One Liberty Square

Suite 500

Boston, MA 02109

www.crestwoodadvisors.com

BTN 9-24-18.pdf

By the Numbers

Attached is the weekly “By the Numbers” piece put out by MFS. Below are two facts that stress the need for prospect/client engagement and understanding about the historical volatility of equity markets.

As of the end of 2017, 19% of Millennials and 12% of Baby Boomers had no money (either pre-tax or post-tax) invested in the stock market. Millennials were born between 1981-97 and were ages 20-36 in 2017, while the Baby Boomers were born between 1946-64 and were ages 53-71 in 2017 (source: Vanguard).

Over a painful 6-months from September 2008 through February 2009 (i.e., 9/01/08 to 2/28/09), the S&P 500 lost 41.8% (total return), including a drop of 16.8% in just the month of October 2008. The index bottomed less than 2 weeks later on 3/09/09 and began a bull market on 3/10/09 that continues to this day (Source: BTN Research).

It’s actually surprising to me that the gap in stock market investment between Millennials and Baby Boomers is not wider given the feeling of unease many in my generation have concerning financial market following the crisis.

Peter Malone, CFA

Research Analyst

Direct: 617.226.0030

Fax: 617.523.8118

Crestwood Advisors

One Liberty Square

Suite 500

Boston, MA 02109

www.crestwoodadvisors.com

BTN 9-17-18.pdf