CRM Earnings update

Current Price: $188           Price Target: $320

Position size: 3%                TTM Performance: -18%


Key Points:

  • Results alleviate concerns about the demand environment which has been weighing on the stock
    • Rev up 24% for the quarter, and expected to be up 20% for the year. Seeing broad based growth across every region in the quarter: 21% in the Americas, 33% in EMEA and 24% in APAC. And strong momentum across every Cloud in their Customer 360 Platform and across their industry verticals.
    • Leading business indicators remained encouraging w/ remaining performance obligation (RPOs), representing all future revenue under contract, ended Q4 at ~$42B, +20% YoY. And Current RPOs or cRPO (all future revenue under contract that is expected to be recognized as revenue in the next 12 months) was ~$22B, up 21% YoY.
  • Management’s tone on the conference call was very positive and called for no significant impact in demand because of macroeconomic concerns. In general, cloud and security software products are less susceptible to any IT budget cuts than hardware and on-premise software products.
    • CEO said: “we had a great quarter. We’re carefully watching the economic data. I know all of you are doing that as well. And so far, we’re just not seeing any material impact on the broader economic world that all of you are in. Our demand environment, the demand is very strong.”
  • SaaS sector has defensive qualities given secular growth and recurring revenues…
    • Over 90% of revenues are recurring and CRM is inexpensive relative to its peer group
    • Long-term path for growth…massive addressable market (expected to be $250B in 2025) that’s growing at a mid-teens CAGR and they’re taking share. They expect to hit ~$50B in revenue in 2026 which implies high teens annual top line growth.
  • YTD Salesforce has traded off along with the rest of the software names, which have been among the worst performers in tech…as they are among the highest growth, longest duration and most susceptible to rising rates…
    • Strong balance sheet…net leverage ratio <1x. In August they issued $8 billion of senior notes (to fund Slack deal) with a weighted average interest rate of 2.25 % and weighted-average maturity of 20 years. Concurrent with that, S&P upgraded their credit rating to A+.
    • CRM is trading at a big discount to peers on a P/S multiple of ~4.7x calendar ’23 revenue (vs ~6.5x). Peer valuation comparison is often looked at this way to account for companies that high growth and not yet profitable. From this perspective, CRM is a rare company that’s growing profitably at scale.
    • Valuation is supported by their high moat, leading market share, the visibility and stability of their recurring revenue model, high growth given multiple secular tailwinds and large addressable market, and their margin expansion opportunity. They are delivering on margin targets which will add to their FCF/share growth.
  • Investment Thesis:
    • Strong moat – dominant front office software that is mission critical and productivity enhancing to customers with high switching costs and an ecosystem advantage
    • Solid long-term secular growth drivers – digital transformation, multi-cloud, industry verticals and international expansion
    • Improving unit economics – growth strategy should yield higher quality (lower attrition) and higher recurring revenue cohorts which should improve margins over time and support their multiple
    • Reasonably valued – high quality franchise, growing double-digits and trading at a discount to peers


YTD Salesforce has traded off along with the rest of the software names, which have been among the worst performers in tech…as they are among the highest growth, longest duration and most susceptible to rising rates…

While CRM’s stock price has gone down YTD, free cash flow estimates for this year have held steady …


Sarah Kanwal

Equity Analyst, Director


Direct: 617.226.0022

Fax: 617.523.8118


Crestwood Advisors

One Liberty Square, Suite 500

Boston, MA 02109

www.crestwoodadvisors.com


TJX Q1 Results

Current Price:   $56                        Price Target: $83

Position Size:    3.7%                      TTM Performance: -6%


Key takeaways:

  • Stock is trading down today after ROST gave a weak outlook. No news on TJX. While ROST is also an off-price retailer, they have different merchandising strategies, a different core customer (higher income at TJX) and ROST has less than half the scale of TJX. Quote from ROST call: “escalating inflationary pressures had a larger impact on lower-income households.” ROST had -7% SSS, while TJX SSS were flat.
  • Managing current/inflationary environment better than peers; their margins are going up while others are going down – slight miss on top line but beat on earnings given better than expected margins and gave higher full year EPS and margin targets. Their strong mark-on aided by their nimble merchandising strategies, recent pricing initiatives and expense management are helping offset higher freight.
  • TJX’s agile business model gives them a big advantage as consumers are shifting what they are buying
    • TJX can adapt and be opportunistic…they are constantly in the market buying and flowing in-season goods to stores w/ shorter lead times than traditional retailers and they have the ability to pivot merchandising based on current trends. Other retailers don’t have the same agility, which is leading to excess inventory that TJX can opportunistically buy.
    • For instance, TGT got hurt by having inventory in the wrong categories. On their call they simultaneously talked of excess inventory and also out of stocks and having to find temporary places to store bulk inventory…i.e. too much furniture and TVs and not enough luggage and on-trend apparel. They’re also seeing shift to lower margin essential items where they may limit passing through price increases. In the current environment, with tight shipping capacity, there is a stiff penalty to shipping stuff you can’t sell right away, storing (cost and extra labor) and expediting shipping on other stuff leaving them more exposed to things like spot trucking prices where diesel costs are surging (while gas prices have come down recently diesel prices have continued to go up).
  • Excess inventory at other retailers is an opportunity for them – inventory is up across retailers as shortages, shipping delays and changes in what consumers are buying (reflective of a shift to spending on services over goods…i.e. buying luggage for travel, clothing for events).
  • In a recessionary environment, off-price value proposition increases as consumers’ wallets tighten and higher quality inventory becomes more available.
  • Higher labor costs should be stickier than freight. When freight pressures abate, this will be a tailwind to margins –While higher wages will stay, freight pressures are expected to improve, which should be a tailwind to margins, particularly for the companies that were able to raise prices to offset.
  • Valuation: strong balance sheet, 2% dividend yield as they just raised the dividend 13%; in fiscal ’23 they plan to buyback $2.25B to $2.5B of stock (or about ~3.5% of the market cap), and the valuation is reasonable at ~5% forward FCF yield, cheaper than the S&P. They are growing the top line mid-single digits and w/ margin expansion and buybacks, they’re compounding FCF/share double digits.
  • Quotes from the call..
    • “in today’s highly inflationary environment, we believe our value proposition is as appealing as ever.”
    • “We still have plenty of open-to-buy for the second quarter and second half of the year. We remain well positioned to take advantage of excellent deals we are seeing in the marketplace and flow fresh merchandise to our stores and online throughout the year.”
    • “we continue to see significant store growth opportunities ahead for all of our divisions. As we have seen over the last few years, demand for our exciting and inspiring in person shopping experience remains strong. We see our flexible buying supply chain and store formats as tremendous advantages, which allow us to open stores across a wide customer demographic. All of this gives us confidence in our long-term plan of opening more than 1,500 additional stores in our current markets with our current banners.”
    • “we are planning to grow our sales and open new stores, while many other retailers are closing stores, we offer vendors a very attractive solution to clear their excess product.”
  • Long-term thesis intact – Relative to other brick-and-mortar focused retailers, TJX  continues to have a superior and very differentiated model. They acquire their inventory from an enormous (and growing) network of vendors, acting like a clearing mechanism for the retail industry…essentially opportunistically buying leftover/extra product that constantly flows from retailers, branded apparel companies etc. Growth of e-commerce has led to better inventory opportunities/ selection, not worse. They leverage their massive store footprint and centralized buying to merchandise their stores and e-commerce sites w/ current on-trend product. No one else does this at the scale they do. Their immense buying, planning and allocation, logistics teams are helping them navigate the current environment. They have very quick inventory turns and can be nimble and re-active w/ their inventory buys and are an important partner to their sources of inventory…and becoming even more important. It’s a powerful model that continues to take share and, while they have a growing e-commerce business too, their store model has been very resistant to e-commerce encroachment. Moreover, they have a thriving Home business, a growing e-commerce presence, an expanding international store footprint and a track record of steadily positive SSS. Prior to 2020, in their 44 year history they only had 1 year of negative SSS (this is unheard of!). So, with steadily positive SSS, a slowly growing store footprint and an emerging e-commerce business, TJX steadily grows their topline w/ consistent margins that are about double that of department stores.


Sarah Kanwal

Equity Analyst, Director


Direct: 617.226.0022

Fax: 617.523.8118


Crestwood Advisors

One Liberty Square, Suite 500

Boston, MA 02109
www.crestwoodadvisors.com


$TJX.US

[tag TJX]

[category earnings]


Home Depot Q1 Earnings

Current Price: $298                  Target Price: $410

Position size: 3%                       TTM Performance: -3%


Key Takeaways:

  • Better than expected results and raised guidance  – SSS were +2.2% w/ inflation as a tailwind. Sales guidance was raised from “slightly positive” to +3%. Record quarter despite a slower start to the spring in many areas of the country (had negative double digit SSS in seasonal categories) and lapping tough compares from last year given more favorable weather, stimulus and a surge in home improvement sales w/ the pandemic.
  • Long-term growth drivers for home improvement sector remain intact – while rising rates may be a headwind to affordability and turnover (new & existing home sales), strong supply demand dynamics supports prices (millennial household formation, years of underbuilding and low inventory for sale). And, importantly, home prices are more correlated w/ home improvement spending than turnover. That combined w/ an aging housing stock all drive repair & remodel activity.
  • Pro sales growth outpacing DIY – Pro is now ~50% of total, increasing as a part of the mix as consumers resume large projects and return to pre-pandemic activities. 
  • Well positioned in the current inflationary environment – inflation is a tailwind to SSS (inflation in things like lumber and copper added 240bps in Q1). If inflation recedes, lower freight will be a tailwind to margins and lower inflation fears should reduce the impact of rising rates on housing turnover (aiding demand).
  • Valuation: cheaper than the S&P with high moat, strong balance sheet, very high ROIC, benefiting from strong housing trends but also has defensive qualities and a reasonable valuation, trading at >5% forward FCF yield and increasing dividends and buybacks.


Additional Info…

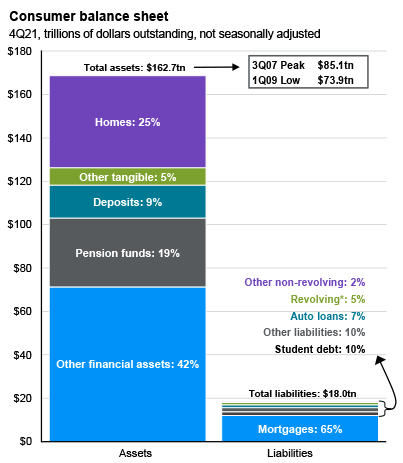
  • Housing is a bigger driver of consumer wealth for the average household than the stock market…
    • In aggregate, housing is 25 % of consumer balance sheets…but housing is a far higher % for the average family b/c equities are concentrated among the wealthy.
    • The top 5% of US households own 71% of US equities, while the top 20% of US households own 93% of US equities (source: Survey of Consumer Finances, Federal Reserve Board).
  • Quotes on demand and the health of the consumer:
    • “we continue to see outsized demand for Home improvement projects”
    • “our customers continue to trade up for premium innovative products”
    • “Big ticket comp transactions or those over $1,000 were up 12.4% compared to the first quarter of last year.”
    • “We’re encouraged by the momentum we’re seeing with our pros and they tell that their backlog are strong.”
    • “Over our history, we’ve seen that home price appreciation is the primary driver of home improvement demand. When you’re home appreciates in value, you view it as a smart investment and you spend more on it.”
    • “So let’s talk about interest rates, I think it’s important to remember that our addressable market is the 130 million housing units occupied in the US. Plus 40 million to 50 million more in Canada and Mexico. Of those 130 million housing units, on any given year, only about 4% or 5% are sold. That means that over 95% of our customers are staying in place. They’re not shopping for a mortgage. Nearly 40% of those homes are owned outright. Of those who have mortgages, about 90% of those mortgages are fixed rate. So, when you think about our addressable market, the vast majority aren’t really paying attention to mortgage rates. And what’s interesting about that is what we heard when they do look at moving. They’re actually more and more tempted to stay in their low fixed-rate mortgage and remodel their home instead. So these low, locked in, mortgages are probably a benefit on home improvement.”
  • Secular tailwinds persist…more homes need to be built. This should be a LT secular driver for HD.
    • Undersupply of homes continues to support pricing and years of underbuilding has shifted the age of the existing US housing stock – both of which support home improvement spending.  
    • According to a recent study by the National Association of Realtors, due to years of underbuilding, the US is short 6.8 million homes.
    • Building would need to accelerate to a pace that is well above the current trend…. to more than 2 million housing units per year vs a ~1.8m annual rate for starts to close the gap in 10 years.
    • From the NAR report released last June…“Following decades of underbuilding and underinvestment, the state of America’s housing stock, which is among the most critical pieces of our national infrastructure, is dire, with a chronic shortage of affordable and available homes to house the nation’s population. The housing stock around the nation has been widely neglected, with a severe lack of new construction and prolonged underinvestment leading to an acute shortage of available housing, an ever-worsening affordability crisis and an existing housing stock that is aging and increasingly in need of repair.”
  • They recently updated their total addressable market (TAM) estimates…
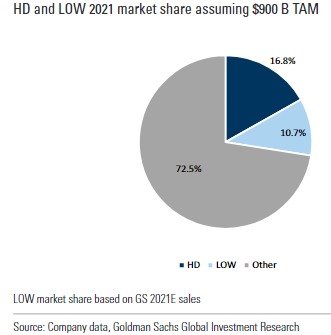
    • They updated their N. American TAM estimate from $650B to $900B with Pro and DIY each representing 50% and with MRO accounting for $100B of Pro. They also provided a long-term sales target of $200B. At a mid-single-digit CAGR, they would hit this in 2029. HD has about 17% share and LOW has ~11%… the other ~72% is pretty fragmented providing lots of opportunity to take share which is supportive of their LT growth targets.

·         Multiple long-term growth drivers: durable housing trends, taking share in a fragmented home improvement market w/ DIY & Pro, and growing their more nascent MRO business (particularly after HD Supply acquisition) and leveraging their best of breed omni-channel model.

·         Best of breed omni-channel model drives productivity: 

o   By adding specialized warehouse capacity and enhancing digital capabilities (online and in the store), HD is uniquely positioned to leverage their existing retail footprint (not really growing stores) and drive steadily high ROIC that is ~45% (which is incredible). They continue to add new bulk distribution centers (used replenish stores with lumber and building materials), flatbed distribution centers (which are often tied to the bulk distribution centers), MDOs (market delivery operations are used to flow through big and bulky products, particularly appliances) and adding direct fulfillment centers for e-comm fulfilment which will allow them to cover 90% of the country in same or next-day delivery.

o   They dominate the category, are the low cost provider, have a relentless focus on productivity and can continue to flow an increasing amount of goods through their big box stores w/ omni-channel. This is a highly efficient model as >50% of online sales are picked up in-store which HD can fulfill from the store or nearby warehouses.


Sarah Kanwal

Equity Analyst, Director


Direct: 617.226.0022

Fax: 617.523.8118


Crestwood Advisors

One Liberty Square, Suite 500

Boston, MA 02109
www.crestwoodadvisors.com


$HD.US

[tag HD]

[category earnings]


BKNG 1Q Results

Current Price: $2,185      Target price: $2850

Position Size: 1.8%          TTM Performance: -4%


Key Takeaways:

  • Beneficiary of strong rebound in pent-up demand for travel as consumers shift spending from goods to services – Booking is primarily exposed to leisure travel which is recovering faster than business travel, aided by higher rates. Similar to Hilton, they benefit from inflationary pressures on room rates as they earn a % of room revenue.
  • Room nights for the quarter were only 9% below 2019 baseline. This is a big improvement from last quarter that was still 21% below 2019. The impact from Russia/Ukraine was not quantified, but despite this, trends improved.
  • Higher room rates + continued room night recovery = record bookings in April – Total dollar value of gross bookings was the highest ever for the month of April while room nights exceed the 2019 level for the first time since the onset of Covid.
  • Seeing strong demand for summer holiday reservations – gross bookings for summer are now more than 15% higher than they were at this time in 2019, and within Western Europe and North America, both up over 30% vs 2019. “If the current trends continue, we could see a record summer travel season, and we’re gearing up to prepare for that across all parts of our business.”

·       Connected trip, payments & alternative accommodations are long-term growth drivers – The long-term vision for them continues to be the “connected trip.” The idea is to be a platform for not just hotel, but a portal for all aspects of travel including flights, activities, restaurants (i.e. OpenTable) etc. A key part of this is building up the “supply” (e.g. tour operators). They continue to invest behind this including their payment platform (1/3 of bookings) which enables alternative forms of payment like WeChat, it enables payment to companies like tour operators through their platform, and offers buy-now-pay-later offered via partnerships with 3rd parties. This is a multi-year endeavor to transition from their accommodation only focus in the past.  As these grow over time, it will drive a mix shift that will add revenue and grow profit dollars, but at a lower margin than traditional accommodations. An offsetting factor to this should be increased direct book (especially via their app), lower customer acquisition costs and lower performance marketing (i.e. lower dependence on search engines). This dynamic is key to margin growth over time as they spend close to 1/3 of revenue on marketing. Alternative accommodations are 30% of the mix and are skewed towards Europe, but they are focused on growing their US business particularly w/ building inventory w/ multi-property managers.

·       Stock is not expensive, expectations are reasonable and supported by buybacks – Trading at ~5.5% FCF yield on 2022. Consensus is now for revenue to recover to 2019 baseline in 2022. Reinitiate return of capital to shareholders in January – outstanding authorization is just over $9 billion. They expect to complete their remaining authorization within the next three years. That means buying back over 10% of their market cap over the next 3 yrs. at current valuation.


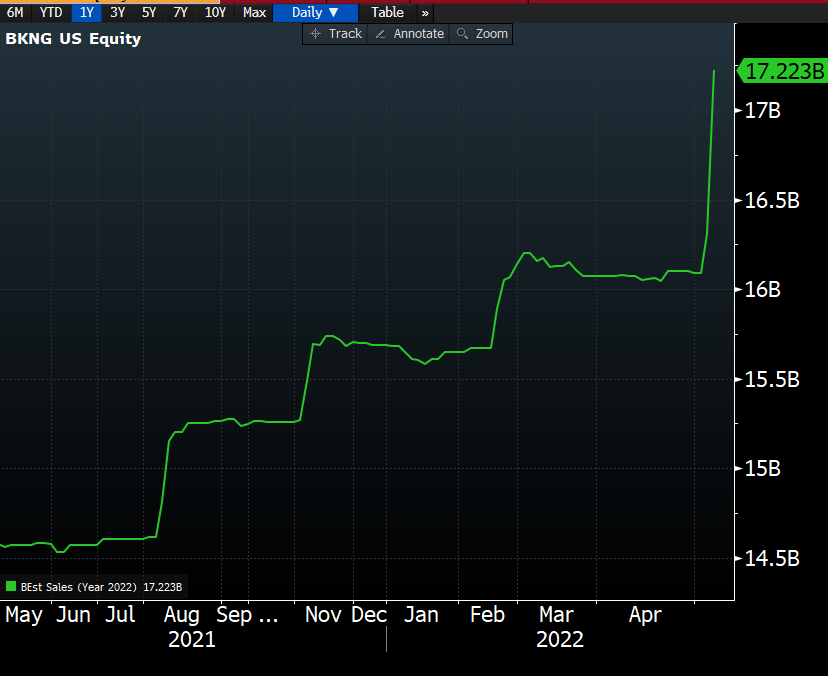
Revenue expectations for 2022 have been climbing and took another leg up after they reported…


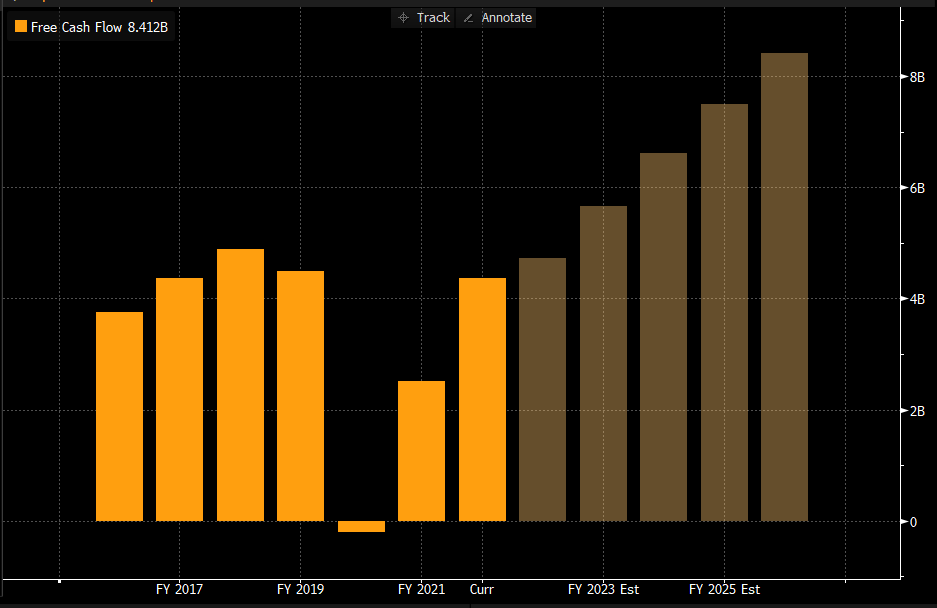
Free cash flow is expected to recover to 2019 levels this year, and strong growth is expected to continue…


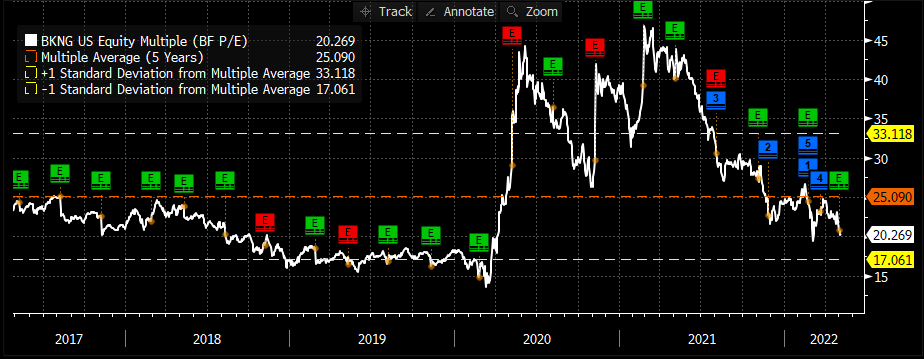
If you look at a P/E chart on the name it doesn’t give great perspective on their valuation. What looks like a higher P/E ratio in the chart below in 2020 and 2021 does not mean the stock was “expensive.” Results were impacted (earnings depressed) by Covid. And what looks like a little below average now is based on an average that is very skewed by those historical higher P/E’s during the depths of Covid…and add onto that, that current one year multiples are impacted by big forward growth expectations (e.g. 36% EPS growth expected in 2023).


Sarah Kanwal

Equity Analyst, Director


Direct: 617.226.0022

Fax: 617.523.8118


Crestwood Advisors

One Liberty Square, Suite 500

Boston, MA 02109
www.crestwoodadvisors.com


$BKNG.US

[category earnings ]

[tag BKNG]


Hilton 1Q22 Results

Share Price: $149            Target Price: $170

Position Size: 2.3%          1 Yr. Return: +22%


Key takeaways:

  • Very positive quarter and strong progress on recovery – system-wide RevPAR increased more than 80% YoY, driving adjusted EBITDA up 126%. RevPAR was approximately 83% of 2019 levels with adjusted EBITDA at 90%. Beginning of the Q was impacted by omnicrom but improved. US leisure travel continues to be a key demand driver and is expected to stay strong. Recovery of group, business transient and Chinese (still down 47% vs 2019) and European markets will all be added tailwinds going forward.
    • Leisure travel has more than recovered – leisure demand is well ahead of 2019 baseline.
    • Business travel is recovering – US business transient RevPAR increased, sequentially, versus the fourth quarter, with March down only 9% compared to 2019 levels.
  • “Inflation is our friend” – They have pricing power, re-price their product daily and have a significant portion of their revenues that are royalties tied to top line. Franchising is almost 2/3 of EBITDA and tied to top line, managing is another 25% of EBITDA where the fee stream is primarily base management fees (% of room revenue), with a smaller portion comprised of incentive management fees (% of hotel profitability). So, in an inflationary environment, pricing power = higher revenue growth and margin expansion.
  • Stable room growth ahead, underpins LT growth story – They expect 5% room growth this year, accelerating to 6-7% longer term. The pipeline (~400K rooms) represents ~38% room growth from their current installed base of  >1 million rooms and more than half are under construction (helps underpin several yrs. of predictable growth). Seeing very strong signings – rising rates not derailing development as demand for travel is increasing, hotels are the shortest duration leases in real estate and can increase prices w/ inflation, and in a tighter financing environment it helps to be associated w/ a banner, particularly one that commands the highest RevPAR premiums (which Hilton does). Almost 2/3 of their pipeline is located outside the US (franchise and mid-tier focus, tied to growing global middle class) – China is an important part of their pipeline and growth there is intact. Headwinds to construction from supply related issues (impacting unit growth this year) will abate.
  • Thesis playing out…profits recovering ahead of RevPAR as margins are going up…EPS this year is expected to be >14% above 2019 while RevPAR Tis expected to be 10% below. They expect permanent margin improvement versus prior peak levels in the range of 400 to 600 basis points over the next few years aided by cost efficiencies gained through Covid, including lowering labor intensity.
  • Reinstated buybacks a quarter earlier than expected – targeting  $1.4B-$1.8B for the full year in dividends and buybacks. Their fee-based capital-light business model and their industry leading RevPAR premiums coupled with further demand recovery, should continue to drive strong performance and meaningful FCF, which will enable them to return significant capital to shareholders. In the 3 years pre-pandemic, they reduced share count by ~15%…as RevPAR and FCF recovers, this level of buybacks should return.
  • Valuation – PT of $170 based on very conservative assumptions of significant revenue growth this year and next as RevPAR recovers, then top line growth reverting to the low end of pipeline growth (6%) over the next few years (which imbeds no RevPAR growth) and margins below guided expansion. I included a 5 yr. historical P/E ratio chart at the bottom of the page. While it shows Hilton trading at an average P/E ratio…it’s not a very helpful way to think about their valuation as earnings collapsed in 2020, then the stock quickly recovered when a vaccine was announced (well ahead of earnings recovering)…moreover the current multiple imbeds enormous growth this year and next as RevPAR recovers.


RevPAR (Revenue per available room) expected to be 10% below 2019 baseline this year…while EPS is expected to be 14% higher than 2019…


In the 3 years pre-pandemic, they reduced share count by ~15%…as RevPAR and FCF recovers, this level of buybacks should return…


$HLT.US

[category earnings]

[tag HLT]


Sarah Kanwal

Equity Analyst, Director


Direct: 617.226.0022

Fax: 617.523.8118


Crestwood Advisors

One Liberty Square, Suite 500

Boston, MA 02109
www.crestwoodadvisors.com


MSFT Q322 Earnings Update

Current Price:   $284                     Price Target: $375

Position Size:    8%                        TTM Performance: 13%


Key takeaways:

  • Broad beat & solid Q3 guidance. Azure continues to be a key driver of growth and is taking share (accelerated, +49% YoY…vs Google Cloud Platform +44% and AWS +37%).
  • Enterprise software is seeing robust demand and is a deflationary force…they sell products that help companies drive productivity and deal with inflationary pressures.
    • “in the conversations we are having with our customers…I don’t hear of businesses looking to their IT budgets or digital transformation projects as the place for cuts”
    • ”I have not seen this level of demand for automation technology to improve productivity”
    • “in an inflationary environment, the only deflationary force is software.”
    • “Businesses – small and large – can improve productivity and the affordability of their products and services by building tech intensity.”
    • ServiceNow’s CEO Bill McDermott (speaking on CNBC), “software is the most deflationary force in the world.”
  • Big and expanding addressable markets..
    • Tech is more & more strategic…and as a result is expected to double as a % of GDP by the end of the decade as companies shift spending from other areas in the organization. MSFT’s products are evolving from being primarily productivity tools to being more strategic (increasingly becoming part of the product and the go-to-market) as companies look to take advantage of new technologies (AI, AR, automation, IoT etc.) to grow and compete. So the value proposition of MSFT’s products to their customers is improving, which is key to the durability of their LT growth and profitability.
    • Cloud – well positioned with lots of growth ahead (see chart below). Cloud penetration has a ways to go as only 20-30% of workloads are in the cloud. MSFT is well positioned as more large enterprises, that are longtime customers, move to the cloud and they are growing their industry specific cloud presence which should be a driver of increased penetration.
    • Security –the attack surface is increasing w/ WFH and more distributed infrastructure. They have a >$15B security business (growing over 40%), making them one of the largest, fastest growing security businesses globally.
    • Gaming/Metaverse/Activision Blizzard – expected to close Acquisition by July 2023; would be MSFT’s largest deal ever ($69B net of cash). This represents not only investment in their gaming business (already well positioned), but also in the metaverse – it could make Microsoft the largest player in the metaverse, and the only company with a dominant position in gaming hardware, cloud services and content. MSFT has been working on building their original game content and Activision Blizzard’s library of original games and game developer talent would add to that.  In terms of the metaverse…video games represent key potential metaverse content and MSFT, w/ their HoloLens headset, has the #2 virtual reality hardware (second to Meta/FB’s Oculus headset) underpinning the immersive aspect of the metaverse. MSFT is focused on other metaverse aspects as well, including new collaboration capabilities (e.g. joining Teams meetings w/ avatars), they plan to roll out software tools related to metaverse content development and already seeing enterprise metaverse usage from smart factories to smart buildings to smart cities. They’re helping organizations use a combination of Azure IOT, digital twins and mesh to simulate and analyze any business process.
  • Well positioned – entrenched enterprise customer base (better positioned for hybrid cloud adoption); superior offering across the stack (SaaS, IaaS, PaaS); desire for multi-cloud environments (mitigate vendor lock-in risk); Power Platform (low-code, no-code tools, robotic process automation, virtual agents and business intelligence) which makes it easier for companies to incorporate new technologies.
  • Attractive valuation:
    • Valuation has gotten cheaper…trading at ~3.5% FCF yield on calendar 2022. A premium to the S&P (~4.5%) and, of the mega cap tech names that we own, this is the most expensive…but supported by a high moat, strong margins, robust secular growth and the absence of antitrust scrutiny.
    • Recurring revenue is >60% of total, underpins most of their valuation and is resilient and poised to be a greater part of the mix. Key to this is Commercial cloud (aggregates Azure, Office 365, the commercial portion of LinkedIn and Dynamics) which grew +35% YoY and is at >$90B annual run rate (Azure is about half of that).


Sarah Kanwal

Equity Analyst, Director


Direct: 617.226.0022

Fax: 617.523.8118


Crestwood Advisors

One Liberty Square, Suite 500

Boston, MA 02109
www.crestwoodadvisors.com


Apple Q2 Earnings

Current Price: $159                                                         Price Target: $185

Position Size: 7.9%                                                        TTM Performance: +23%


Key Takeaways:


  • Hitting record sales across categories despite supply chain constraints. The exception is iPad which is experiencing the most severe shortages.
  • A few headwinds…$4B to $8B impact to next Q revenue due to supply chain constraints. Next Q should be ~$85B in rev for perspective, so a mid to high single digit impact in the Q. Also, Covid restrictions having an impact to demand in China. And finally, seeing a 150bps headwind from Russia.
  • M1 success underscores their silicon and software advantage – they design their own chips for iPhone, iPad and Mac…making them one of the largest semiconductor companies in the world and giving their products an advantage b/c, not only are they some of the most advanced chips, they can tightly customize how their software and hardware work together. Apple points to success w/ Mac as evidence…which has strung together its best 7 quarters in history
  • Asked on the call about M&A intentions…NFLX was specifically mentioned in the question. Mgmt. said they are always looking for opportunities, they usually do smaller acquisitions, but wouldn’t rule out a larger one. NFLX market cap is now $87B…AAPL has $193B in cash on their balance sheet and produces over $100B in FCF annually.
  • Increased buyback authorization by $90B.
  • Reasonable valuation…
      • Trading at ~4.5% FCF yield, in line w/ the S&P, w/ another almost 3% of their market cap ($73B) in net cash on their balance sheet.
      • For reference, pre-pandemic in Jan 2020, Apple was trading at ~4.7% FCF yield and 1% dividend yield with ~7% of their market cap in net cash.
      • AAPL is down about 10% YTD (less than the tech sector) while forward FCF estimates have continued to go up.
      • Their market cap has been tracking their massive increase in FCF estimates. FCF this year should be ~85% higher than pre-pandemic fiscal 2019
      • They have a huge amount of cash on their balance sheet w/ years of buybacks to support valuation
        • Capital returns may need to expand further to hit their net-cash-neutral target in a few years. 
        • With current net cash of ~$73B and expectations of over $470B of FCF over the next 4 years, shareholder returns could be well over $500B or >20% of their current market cap.
        • They’ve returned >$550B since 2012. So, from 2012 to 2026, they may return well >$1T.


Quotes from the quarter & WSJ article on their Silicon Advantage…

  • “With Apple silicon, our teams are pushing the limits of what we once thought possible, and we are seeing leaps and bounds in performance and efficiency. Last month, we announced another breakthrough with M1 Ultra, the world’s most powerful chip for a personal computer. The incredible customer response to our M1-powered Macs, helped propel a 15% year-over-year increase in revenue despite supply constraints.”
  • “And with the all new iPad Air supercharged by M1, iPad brings more power and more versatility across the entire iPad lineup. For customers around the world, iPad continues to be essential for education, creativity, and entertainment. That’s why we’re continuing to see such a strong demand for iPad, even while navigating the significant supply constraint we predicted at the start of the quarter.”
  • From WSJ: “Mr. Srouji’s (head of Apple’s chip design) chip operation, which already designed chips that power iPhones, has helped Apple improve the profitability of its smartphones and computers. It also has positioned Apple to move into potential future products such as a car or extended-reality headsets.”
  • https://www.wsj.com/articles/the-chips-that-rebooted-the-mac-11650081649


Additional highlights:


  • SECOND-QUARTER RESULTS
    • Revenue $97.28 billion, +8.6% y/y, estimate $93.98 billion
    • Products revenue $77.46b, +6.6% y/y, estimate $75.4b
    • iPhone revenue $50.57b, +5.5% y/y, estimate $49.16b
    • Mac revenue $10.44b, +15% y/y, estimate $9.23b
    • iPad revenue $7.65b, -2.1% y/y, estimate $7.19b
    • Wearables, home and accessories $8.81b, +12% y/y, estimate $8.98b
    • Service revenue $19.82b, +17% y/y, estimate $19.78b
    • Greater China rev. $18.34b, +3.5% y/y
    • EPS $1.52 vs. $1.40 y/y, estimate $1.42
  • 5G upgrade cycle – only in the early innings of 5G. If you look at their 5G penetration around the world, there is only a couple of countries that are in the double digits yet.
  • Why we still like
    • Big moat underpinned by growing installed base which drives their virtuous cycle.. More users of their devices lures developers to create better apps which lures more users. This is key to their LT growth. Apple continues to significantly expand their installed base. And they have multiple new products being launched and more in the pipeline (e.g. AR glasses, Apple car) that could be key drivers of LT growth….and, importantly, a growing services business tied to all these products. Part of what differentiates Apple is they design their own silicon for the processor chips that are the brains of their iPhones and iPads and now their Macs, which gives them better control over performance and feature integration in their devices. This has proven to give them an advantage with the way they design their products and an advantage with developers. So, now they have Macs, iPhones and iPads running the same underlying technology which should make it easier for Apple to unify its apps ecosystem, including allowing iPhone and iPad apps to run on Macs. This advantage and the relevance of their ecosystem gets more and more important as computing power in phones increases, 5G delivers better connectivity and, as a result, we have the ability to use their devices in enhanced ways (w/ increased revenue opportunities) ….like apps that take advantage of augmented reality and IoT related technologies.


$AAPL.US

[category earnings]

[tag AAPL]


Sarah Kanwal

Equity Analyst, Director


Direct: 617.226.0022

Fax: 617.523.8118


Crestwood Advisors

One Liberty Square, Suite 500

Boston, MA 02109
www.crestwoodadvisors.com


GOOG Q1 Earnings

Current Price: $2,342    Price Target: $3,450

Position Size: 4.8%         TTM Performance: -1%


Key Takeaways:

  • Robust revenue growth and steady impressive margins, but saw weaker than expected ad revenue from YouTube.
  • Overall, strong ad revenue continues…retail and travel-related ad spending were among the strongest sectors. Overall, ad related revenue up 23% w/ “Search & Other” revenue ($40B, up 24%), Google Network ($8.2B up 21%) and YouTube ad sales ($6.9B, up +15% YoY).
  • YouTube weakness – management attributes the YouTube weakness essentially to two things: weakness in Europe, impacted by Russia/Ukraine and an increased mix of viewership of YouTube shorts (their TikTok rival product) which they don’t monetize as well as longer format videos….yet.
  • Google Cloud Platform (Azure & AWS competitor) continues to do well, +44%.
  • Investing behind growth as they ramp spending on Capex and headcount – continuing to pick up the pace of investment in office facilities and data centers. They recently announced plans to invest $9.5 billion in US offices and data centers, creating at least 12,000 new jobs in places like New York and Atlanta.
  • Valuation –The stock reasonably valued, trading at a 5% FCF yield on 2022, cheaper than the S&P at ~4.5% and growing top line and FCF/share double digits w/ margins more than 2x the S&P. Additionally, they have almost 7% of their market cap in net cash ($106B) after generating $69B in FCF in the last 12 mos. They have been stepping up their pace of buybacks lately. They repurchased $50B in shares in 2021. And announced a $70B buyback this quarter which should support the stock. Also a 20-for-1 stock split to go into effect on 7/15.


Quote from the call on the War in Europe …

  • “about 1% of Google revenues were from Russia in 2021, and that was primarily from advertising. In addition, from the outset of the war, there was a pull-back in advertiser spend, particularly on YouTube in Europe. So a couple of impacts from the war.”


More on YouTube…

  • YouTube has lots of opportunity ahead despite slowing this Q in Europe and higher penetration of YouTube shorts (strong engagement but weak monetization so far).
  • Positioned to capture the shift in advertising away from linear TV & strong value proposition to advertisers
    • YouTube presents a great opportunity to address commercial intent w/ video in a more measurable way than linear TV
    • “YouTube’s reach is becoming increasingly incremental to TV”
    • YouTube helps advertisers reach audiences they can’t reach anywhere else (especially younger audiences) and helping brands do it more efficiently
    • According to Nielsen, in the US, YouTube accounts for over 50% of ad supported streaming watch time on Connected TVs among people ages 18 and up. And over 35% of viewers in this group can’t be reached by any other ad supported streaming service.
  • E-commerce potential: They are still in the early innings w/ e-commerce potential w/ YouTube. Possibilities include: shoppable livestream events w/ large retailers or letting viewers buy directly from their favorite creators’ videos.


Sarah Kanwal

Equity Analyst, Director


Direct: 617.226.0022

Fax: 617.523.8118


Crestwood Advisors

One Liberty Square, Suite 500

Boston, MA 02109

www.crestwoodadvisors.com


Visa Q2 Earnings

Current price: $218        Target price: $278

Position size: 3.8%          TTM Performance: 4%


Key takeaways:

  • Net revenue $7.2B +25% YoY vs street $6.86B. EPS $1.79 vs street $1.67.
  • Cross border is key to growth and momentum keeps building – that strength drove their impressive beat. Cross-border was 25% of pre-pandemic revenues, it’s very profitable for them and still hasn’t fully recovered to baseline 2019….it’s ~90% of 2019 and, at historical run rates, would be 20-30% higher than 2019 levels. This suggests a continued steep recovery ahead which will be a strong tailwind to their business. Travel is a key driver and, more specifically, two of the biggest areas to recover are inbound int’l travel to the US and travel across Asia. The vast majority of the travel Visa captures on their credentials is consumer, and they are the global leader in travel co-branded cards.
  • Inflation beneficiary – their fees are a % of transaction costs which rise w/ inflation
  • Disruption fears overblown – they enable the disruptors, helping them rapidly scale and offer a strong value proposition for their fees, which are a small part of interchange. See more on this below.
  • Reasonable Valuation… Visa is a high moat, duopoly company with extremely high FCF margins (over 50%), strong balance sheet and continued runway for secular growth driven by the shift from cash to card/digital payments and new payment flow opportunities (outlined below). Trading at ~3.5% FCF yield and compounding FCF/share at a high-teens %.


Quotes from the call…

  • “In terms of the big picture, after a short four to five week impact of Omicron in December and January in the United States and many other parts of the world, the recovery continues to be robust. At this stage in terms of volumes, we have seen no noticeable impact due to inflation, supply chain issues or the war in Ukraine.”
  • “Indexed to 2019, cross border travel, excluding transactions within Europe, jumped from a low of 71 in January to 94 in March”…”There’s plenty of recovery to come in one important corridor, inbound to the US, which indexed only at 70 in Q2″…and “Asia Indexed in the high 30s, both inbound and outbound in Q2.”


They expect accelerated revenue growth versus pre-COVID over the coming years, driven by 3 strategic levers:

    1. Consumer payments – enormous opportunity to displace cash and check globally ($18T) – the pandemic has helped accelerate this. Also a LT opportunity to grow the pie for digital payments w/ the 1.7 billion unbanked. This is driven by growing merchants, grow cardholders and new modes of acceptance. Many current trends in payments, including A2A, RTP, buy now pay later, crypto and wallet are enabling new ways to pay. Mgmt. says these represent opportunities for Visa (“We enable the disruptors”). Key to this is the easy onramp to their network, the instant scalability it provides to these new entrants, the value proposition w/ value identity protection, fraud prevention, dispute resolution, security, loyalty. Visa is agnostic to who wins this. They aim to sit in the middle as a “network of networks” and to continue to offer a high value proposition for the ~15bps that gets charged to merchants.
        • Wallets: increasingly embed Visa credentials in their wallets to aid their own growth, so the consumer can use it anywhere Visa is accepted as well as receive and send cross-border P2P payments Wallet providers have been rapidly issuing Visa credentials that they see value in an open-loop ecosystem. Examples include Naranja X in Argentinian, PayPay wallet in Japan, Safaricom, the operator of M-PESA in Africa.
        • Crypto: “leaning into in a very, very big way, and I think we are extremely well positioned”. Enabling purchases, enabling conversion of a digital currency to a fiat on a Visa credential, helping financial institutions and FinTech’s have a crypto option for their customers and upgraded their infrastructure to support digital currency settlement. They have over 65 crypto platform partners that are working with them. Also working with Central Banks as digital currency is being explored in many nations.
        • E-commerce: closed a U.S. co-brand deal with Shopify. The Shopify Balance card will allow Shopify’s U.S. merchants to access funds from sales by the next business day and receive cash back on everyday business expenses like shipping and marketing.
        • Buy Now Pay Later (“BNPL”): growth is coming in several ways. BNPL FinTech’s are issuing Visa credentials so they can scale through Visa’s broad acceptance. Affirm has chosen Visa as their network partner for the Affirm debit plus card. BNPL FinTech’s are increasingly using Visa virtual cards to settle with merchants. BNPL fintech consumers also continue to use their cards to pay off their instalments. And finally, for traditional issuers, they have a network installment solution called “Visa Installments,” which enables their financial institution clients to seamlessly offer BNPL capabilities through an existing credit credential on any Visa transaction.
    1. New Flows – 10X the opportunity of Consumer payments. With a $185 trillion in B2B, P2P, B2C and G2C. P2P, which represents $20 trillion of the opp., was Visa Direct’s first use case and continues to grow substantially. A key area of future growth is cross-border P2P, or remittance.
    2. Value-added services – includes consulting, technology platforms (e.g. Cybersource, issuer processing, and risk identity and authentication), data and insights, and card benefits, all which will improve with the recovery. Opportunity to increase penetration w/ existing clients. In 2021, 40% of their clients used five or more value-added services and nearly 30% use 10 or more. They expect sustainable high teens growth in this segment.


Sarah Kanwal

Equity Analyst, Director


Direct: 617.226.0022

Fax: 617.523.8118


Crestwood Advisors

One Liberty Square, Suite 500

Boston, MA 02109

www.crestwoodadvisors.com


$V.US

[category earnings]

[tag V]


SHW Q1 2022 Earnings

Current price: $270         Price target: $330

Position size: 3%              TTM Performance: 9%


Key Takeaways:

  • Broad beat, demand trends are strong and they’re past the worst of supply chain issues. “We believe we are through the worst of the industry supply chain challenges and the incremental architectural capacity we added late last year positions us well for the upcoming architectural painting season.”
  • Inflation – still elevated but they expect this to improve in the second half. They are taking price increases to offset and are prepared to take more if necessary. Higher labor costs for customers is causing a positive mix shift to higher quality paints which can reduce labor intensity of jobs (which is the largest portion of pro project costs).
  • Taking action to offset headwinds which positions them to take share – Their actions are all aided by their scale & pricing power. Taking continued price increases, vertical acquisition (specialty polymers) that will aid supply, and they continue to invest in growth initiatives – “We’re leveraging all of our assets, including our store platform, our fleet, our distribution centers and more, to let us come up with unique and creative customer solutions that others simply can’t.”
  • Margins will improve  – as headwinds recede, strong demand and pricing actions will lead to higher margins
  • Valuation is reasonable – current yr. FCF is depressed due to the raw material headwinds they are facing and investment in new capacity. As headwinds recede, margins will expand. Low-to mid-single digit top line growth and an improvement in margins toward long-term targets, yields ~25% upside.
  • Balance sheet remains strong – leverage ratio is between 2-2.5x. Debt is 92% fixed rate.
  • Strong history of returning capital to shareholders continues – In 2021, they increased their dividend over 20%, marking the 43rd consecutive year they increased their dividend.


Quotes from the call…

On demand:

  • “Rising mortgage rates have not made an appreciable dent in the demand for our new residential customers to this point.”
  • “I’d just highlight this article by USA Today that I think captures kind of the sentiment that we have in new residential. It talks about the housing unit shortfall… despite an annual average of 1.5 million new housing units completed, and a 1.7 million spike in 2020 alone, new construction would need to accelerate to a pace that’s well above this current trend to more than 2 million housing units per year to close this gap. Even if building were to continue at the current level, the most rapid pace in more than a decade, it will still take more than 20 years to close the 5.5 million unit gap.”
  • “we made more architectural paint gallons in March than in any previous month in our company’s history”
  • “European demand also remains strong, although we continue to closely monitor for potential impacts from the war in Ukraine.”

On Supply chains:

  • “the supply chain is not completely recovered as the bottleneck has now largely moved from suppliers’ production to their transportation and logistics. In the near-term, we’re speeding this recovery by employing our own fleet and tank wagons to supplement suppliers’ delivery capabilities. Our ability in this area is unique among our competitors.”


Additional Highlights:

  • Revenue and margin headwinds will subside later in 2022…
    • Disruptions are acting as a short-term headwind – Natural disasters (winter storm Uri and Hurricane Ida) destroyed the industry’s raw material supply chain, which led to poor availability and unprecedented cost inflation due to high demand. Labor and transportation costs also became elevated throughout the year. Lastly, the new COVID variant (Omicron) added to operational complications.
  • America’s Group ($2.6B), +5.6%:
    • Sales increased 5.6% including low-double-digit pricing; same store sales increased 3.8%
    • Segment margin improved 170 basis points sequentially
  • Consumer Brands Group ($700m), -10%:
    • Sales decreased 10.1% driven by difficult prior year comparisons, lower sales outside of North America and the Wattyl divestiture (-6%). High-single-digit price realization in the quarter
  • The Performance Coatings Group ($1.65B), +20%:
    • Sales increased 20.4% including mid-single-digit volume growth and mid-teens pricing
    • Double-digit growth in North America, Asia and Latin America; high-single-digit growth in Europe
    • Packaging and Coil highest year-over-year increases and double-digit growth in every region
    • General Industrial and Auto Refinish growth in all regions
    • Industrial Wood strength in North America driven by strong architectural end markets


Sarah Kanwal

Equity Analyst, Director


Direct: 617.226.0022

Fax: 617.523.8118


Crestwood Advisors

One Liberty Square, Suite 500

Boston, MA 02109

www.crestwoodadvisors.com