Microsoft Cuts Sales Forecast, Citing Virus Impact in PC Unit

MSFT said they will not meet their Q1 sales guidance related to PC suppliers in China. They said “although we see strong Windows demand in line with our expectations, the supply chain is returning to normal at a slower pace than anticipated.” The guidance cut is only for their More Personal Computing segment which includes Surface and Window OEM licensing – the rest of their guidance remains unchanged.


Microsoft update on Q3 FY20 guidance


REDMOND, Wash. — Feb. 26, 2020 — As Microsoft closely monitors the impact of the COVID-19 health emergency, our top priority remains the health and safety of our employees, customers, partners, and communities. Our global health response team is acting to help protect our employees in accordance with global health authorities’ guidance. Worldwide, Microsoft employees are working to support organizations addressing the challenges on the ground. Microsoft also continues to make donations to relief and containment efforts, including directly providing technology to help hospitals and medical workers.


On Jan. 29, as part of our second quarter of fiscal year 2020 earnings call, we issued quarterly revenue guidance for our More Personal Computing segment between $10.75 and $11.15 billion, which included a wider than usual range to reflect uncertainty related to the public health situation in China. Although we see strong Windows demand in line with our expectations, the supply chain is returning to normal operations at a slower pace than anticipated at the time of our Q2 earnings call. As a result, for the third quarter of fiscal year 2020, we do not expect to meet our More Personal Computing segment guidance as Windows OEM and Surface are more negatively impacted than previously anticipated. All other components of our Q3 guidance remain unchanged.


As the conditions evolve, Microsoft will act to ensure the health and safety of our employees, customers, and partners during this difficult period. We will also continue to partner with local and global health authorities to provide additional assistance. We deeply appreciate the commitment of the people and organizations that have united to address this health emergency; our thoughts are with all those affected across the world.


Sarah Kanwal

Equity Analyst, Director


Direct: 617.226.0022

Fax: 617.523.8118


Crestwood Advisors

One Liberty Square, Suite 500

Boston, MA 02109

www.crestwoodadvisors.com


$MSFT.US

[tag MSFT]

[category equity research]


CCI 4Q Results and Accounting Restatement

CCI reported 4Q results, with in-line organic site rental revenues, but they reported an accounting change that impacted services revenues, EBITDA and AFFO. They received a subpoena from the SEC, which has resulted in CCI determining that their revenue recognition policy did not meet with GAAP. It seems to relate to installation services that should have been recognized over the life of the lease rather than up front. As a result, they are restating 5 years of financials and full year guidance for 2020 was reduced by 4%. More details after the call.


Sarah Kanwal

Equity Analyst, Director


Direct: 617.226.0022

Fax: 617.523.8118


Crestwood Advisors

One Liberty Square, Suite 500

Boston, MA 02109

www.crestwoodadvisors.com


BKNG Beats but weak guidance on Coronavirus impact

Key Takeaways:

·         BKNG beat on 4Q revenues and EPS.

·         The stock is down because they issued weak guidance due to impact from the Coronavirus.

·         Projecting Q1 revenue down 3% to 7%, the street had been expecting 5% growth.

·         They expect 1Q room nights booked to be down 5% to 10%.

·         Mgmt. said they saw “a significant and negative impact” and that it is not possible to predict where and to what degree outbreaks of coronavirus will disrupt travel. 


Sarah Kanwal

Equity Analyst, Director


Direct: 617.226.0022

Fax: 617.523.8118


Crestwood Advisors

One Liberty Square, Suite 500

Boston, MA 02109

www.crestwoodadvisors.com


TJX 4Q20 Earnings

Key Takeaways:

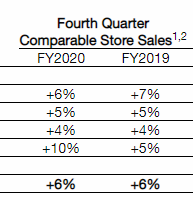
1.       Beat driven by higher than expected same store sales of +6% (vs street +3.2% and guidance of +2%-3%).

2.       They had strong SSS results across all segments with particular strength in TJX International (Europe/Australia) demonstrating continued share gains. SSS int’l were +10% vs. cons 3.6%.

3.       Guidance light, but seems conservative.

4.       They have seen no impact from Coronavirus and say it’s too soon to predict any impact. They do not directly source a significant amount of goods from China.  


Current Price:    $64                        Price Target: Raising to $70 from $65

Position Size:    3.7%                      TTM Performance: 20%


Highlights:

·         TJX reported a strong quarter beating on sales and EPS. 4Q EPS of $0.81 vs. cons. of $0.77 and guidance of $0.74-$0.76

·         Earnings guidance light, but seems conservative. Both Q1 and FY2021 guidance was slightly below the street, but mgmt. tends to guide conservatively.  

·         FY2021 guided to EPS of $2.77 to $2.83 per share vs street $2.86 w/ SSS guidance of  with comps of 2%-3% vs. consensus of 3%.

·         1Q guided to EPS of $0.59-$0.60 vs cons. of $0.61, with comps of 2%-3% versus cons. of. 3.1%,

·         They tend to guide conservatively, with EPS and revenue beating consensus 18 of the last 21 quarters

·         Traffic was again the biggest driver of SSS. The fact they continue to grow traffic while many peers are seeing the opposite, validates that their concept is resonating w/ consumers and is a promising indicator for future SSS. E-commerce sales are not included in SSS numbers.

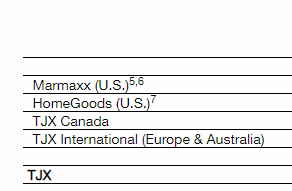
·         Marmaxx (their largest segment) – comp sales increased 6%, lapping a very strong 7% increase last year.

·         International again had the strongest SSS of +10% – they continue to take share despite a tough retail environment in Europe.

·         GM were better than expected on “significantly” higher merchandise margins but somewhat offset by higher SG&A.

·         They now have over 4,500 stores, including more than 1,200 outside of the United States.

·         They continue to see excellent inventory availability

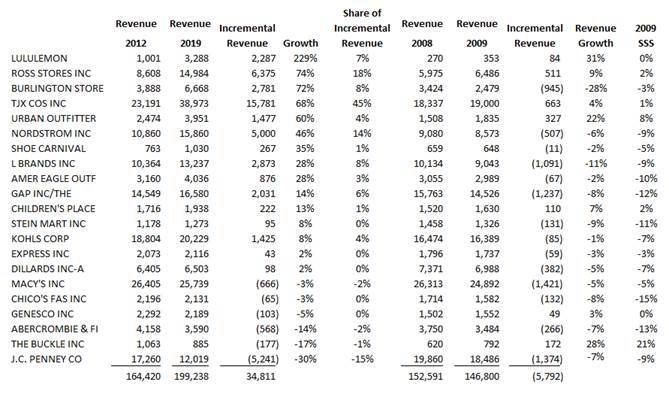
·         Chart below demonstrates TJX’s resistance to e-commerce and economic cycles. Despite the ramp in e-commerce share of retail over the last several years, of the companies listed below TJX is nearly half of aggregate incremental spend. The companies listed below represent more than 2/3 of the ~$275B in US apparel retail sales. Additionally, in the ’08 to ’09 period they were one of few retailers that continued to grow and post positive SSS.

[more]


Valuation:

·         Balance sheet is strong. They have no net debt.

·         Store openings will bolster top line growth.

·         They have been steadily FCF positive, even through the financial crisis they posted 3% FCF margins. LT FCF margins are ~7%.

·         Valuation is reasonable at >4% forward yield.

The Thesis on TJX:

·         Market leader: opportunity to benefit from a lasting paradigm shift in consumer frugality. Treasure hunters – TJX has strong brands that attract cost conscious consumers– evident through consistently strong customer traffic.

·         Strong bargaining power with suppliers due to size.

·         Quality: Solid and consistent execution and top line growth driving strong margins through cost cutting/inventory control.

·         Shareholder returns: Strong returns, balance sheet and cash flows being used for share buyback program, dividend, and store expansion.


$TJX.US

[tag TJX]

[category earnings]


Sarah Kanwal

Equity Analyst, Director


Direct: 617.226.0022

Fax: 617.523.8118


Crestwood Advisors

One Liberty Square, Suite 500

Boston, MA 02109

www.crestwoodadvisors.com


DIS CEO Stepping down

Disney just announced that Bob Iger is stepping down as CEO, effective immediately. Bob Chapek has been named the new CEO – he has been at Disney for 27 years and most recently served as Chairman of Disney Parks, Experiences and Products. Iger has been CEO for over 15 years and was expected to remain CEO until the end of 2021. While the timing was a surprise, Iger will stay on and assume the role of Executive Chairman and “will direct the Company’s creative endeavors,” while leading the Board through the end of his contract on Dec. 31, 2021. Mr. Chapek will report to Iger, and the Board of Directors. He will be appointed to the Board at a later date.  In terms of timing, Iger said the purpose of handing over the CEO role now was to turn over day-to-day management in order to free him up to focus all his time on the creative side. Chapek is 60 years old and is signing a contract for just three years.


Sarah Kanwal

Equity Analyst, Director


Direct: 617.226.0022

Fax: 617.523.8118


Crestwood Advisors

One Liberty Square, Suite 500

Boston, MA 02109

www.crestwoodadvisors.com


$DIS.US

[category equity research]

[tag DIS]


AAPL Coronavirus Update

Apple is down because they issued a statement this morning indicating they will not meet quarterly guidance due to the ongoing impact of the coronavirus. They did factor in some impact in the guidance they gave a few weeks ago, but management indicated that “work is starting to resume around the country, but we are experiencing a slower return to normal conditions than we had anticipated.” As a result, both the temporary impact to the worldwide supply of their products and to Chinese demand will be worse than expected.


Investor Update on Quarterly Guidance

Business Wire

CUPERTINO, Calif. — February 17, 2020

As the public health response to COVID-19 continues, our thoughts remain with the communities and individuals most deeply affected by the disease, and with those working around the clock to contain its spread and to treat the ill. Apple® is more than doubling our previously announced donation to support this historic public health effort.

Our quarterly guidance issued on January 28, 2020 reflected the best information available at the time as well as our best estimates about the pace of return to work following the end of the extended Chinese New Year holiday on February 10. Work is starting to resume around the country, but we are experiencing a slower return to normal conditions than we had anticipated. As a result, we do not expect to meet the revenue guidance we provided for the March quarter due to two main factors.

The first is that worldwide iPhone® supply will be temporarily constrained. While our iPhone manufacturing partner sites are located outside the Hubei province — and while all of these facilities have reopened — they are ramping up more slowly than we had anticipated. The health and well-being of every person who helps make these products possible is our paramount priority, and we are working in close consultation with our suppliers and public health experts as this ramp continues. These iPhone supply shortages will temporarily affect revenues worldwide.

The second is that demand for our products within China has been affected. All of our stores in China and many of our partner stores have been closed. Additionally, stores that are open have been operating at reduced hours and with very low customer traffic. We are gradually reopening our retail stores and will continue to do so as steadily and safely as we can. Our corporate offices and contact centers in China are open, and our online stores have remained open throughout.

Outside of China, customer demand across our product and service categories has been strong to date and in line with our expectations.

The situation is evolving, and we will provide more information during our next earnings call in April. Apple is fundamentally strong, and this disruption to our business is only temporary. Our first priority — now and always — is the health and safety of our employees, supply chain partners, customers and the communities in which we operate. Our profound gratitude is with those on the front lines of confronting this public health emergency.


Sarah Kanwal

Equity Analyst, Director


Direct: 617.226.0022

Fax: 617.523.8118


Crestwood Advisors

One Liberty Square, Suite 500

Boston, MA 02109

www.crestwoodadvisors.com


Black Knight 4Q19 Earnings

Key Takeaways:

1.       In-line revenue and better than expected EPS. Guidance essentially in-line with consensus. Q4 Revenues were +5% and adj. EPS was +8%.

2.       Seeing increasing success with cross-selling Data & Analytics (~14% of revenue), which could be a solid future growth driver for them.

3.       Solid contract renewals – they renewed more than 1/3 of the loans on their MSP mortgage servicing software with long-term contracts, indicating the strength of their product and client relationships.

4.       As discussed on their last call, they will see a 5pt hit to top line in 2020 related to client de-conversions (PennyMac). No update on the progress of the PennyMac lawsuit.

Share price: $72               Target Price: Under review

Position size: 2.5%          TTM return: 41%


Highlights:

·         Guidance is for 2020 revenue of $1.19B to $1.214B and EBITDA of $589m to $607m and EPS of $1.97 to $2.06. They expect results to be 2H weighted with growth accelerating to the high end of their range in the second half of the year.

·         2020 Revenue growth is below LT targets due to one-time headwinds, excluding those headwinds they are w/in their LT range. Their long term targets continue to be 6-8% revenue growth and mid-teens EPS growth. By segment, the expectation is mid to high-single digit growth in Servicing, high-single to low-double digit growth in Origination, and low to mid-single digit growth in Data & Analytics. 

·         In 2019, they renewed over 11 million loans (more than 1/3 of the loans on MSP) to long-term contracts last year.

·         Signed 9 new MSP clients, representing nearly 500,000 loans, which is the most new client signed in a single year since 2013.

·         Data analytics segment (~14% of revenue) revenues were up 11% driven by growth in their property data and portfolio analytics businesses.

o   Trending ahead of LT targets in recent quarter on some “extraordinary cross-sales” related to new client deals, as well as renewals. This is promising momentum in this business and suggests they are finally gaining some meaningful traction.

·         Software Solutions segment (~85% of revenue) was up 4%.

o   They continue to gain share in this business.

o   Within this segment servicing (~70% of revenue) was down 3% from a previously discussed client de-conversion. They continue to dominate first lien loans with leading share and are growing share in second lien loans. Market share for first mortgages is ~63%.

o   Originations (~16% of total revs) made up of new loans and refi’s – revenues increased 43% in Q4 – lower rates help this business. Growth driven by new clients, a tuck-in acquisition, as well as higher refinanced volumes in their Exchange and e-Lending businesses. They signed 11 new Empower clients with 9 of those clients implementing Empower now and a strong pipeline going into 2020.

Valuation:

·         Trading at <4% FCF yield on 2020 –valuation is getting more expensive but supported by growth potential, strong ROIC with a recurring, predictable revenue model (>90% recurring revenue) and high FCF margins, which is aided by high incremental margins and capex (~9% of revenue now) which should taper as they grow.

·         $1.5B in net debt – that puts their leverage ratio at 2.6x, high because of Dun & Bradstreet but decreasing.

·         Capital allocation priorities include opportunistic share repurchases, debt pay down and potential acquisitions.


Thesis:

  • Black Knight is an industry leader with leading market share of the mortgage servicing industry. 
  • Stable business with >90% recurring revenues, long-term contracts and high switching costs.
  • BKI has high returns on capital and high cash flow margins.


$BKI.UA

[tag BKI}

[category earnings]


Sarah Kanwal

Equity Analyst, Director


Direct: 617.226.0022

Fax: 617.523.8118


Crestwood Advisors

One Liberty Square, Suite 500

Boston, MA 02109

www.crestwoodadvisors.com


PLEASE NOTE!

We moved! Please note our new location above!


MSFT – Jedi contract…

The JEDI cloud contract awarded to MSFT is being challenged by AMZN. It is a $10B contract over 10 years, which would represent less than 1% of revenue to MSFT.  However, there is upside to this in that the contract might position MSFT to win more government cloud spending in the future.


Amazon Gets Injunction Blocking Microsoft’s  Pentagon Cloud Contract

A judge orders a temporary halt requested by Amazon for the $10 billion contract that was granted to Microsoft.

By Tony Owusu


A judge has granted Amazon.com an injunction in which the company was seeking to block a $10 billion contract the Pentagon awarded to rival Microsoft to build the cloud infrastructure for the military’s computer systems.

A court notice announcing the injunction was filed on Thursday, but wasn’t public, CNBC reported.

The ruling would temporarily halt work on the Joint Enterprise Defense Infrastructure project.

Amazon last week filed a motion to depose President Donald Trump, Defense Secretary Mark Esper and former Defense Secretary James Mattis over the decision to award the contract to Microsoft.

Trump has been a vocal critic of Amazon CEO Jeff Bezos and the company seeks to make sure that personal animosity didn’t play a role in awarding the contract to Microsoft.

Amazon alleges that Trump wanted to "harm his perceived political enemy" – Bezos – in exerting pressure to block Amazon from the deal. Trump has often criticized Bezos because he owns the Washington Post, which editorially has been critical of the president.

According to reports, Trump delayed awarding the contract in 2018 after receiving complaints about internal favoritism toward Amazon.

Oracle CEO Safra Catz reportedly complained to Trump about the issue at a private dinner in April 2018, according to a Bloomberg report at the time.

Amazon’s cloud business, AWS, is the market leader in cloud computing, but Microsoft’s Azure cloud company has closed the gap between the two companies in recent quarters.


This article was originally published by TheStreet.

-0- Feb/13/2020 19:42 GMT


Sarah Kanwal

Equity Analyst, Director


Direct: 617.226.0022

Fax: 617.523.8118


Crestwood Advisors

One Liberty Square, Suite 500

Boston, MA 02109

www.crestwoodadvisors.com


$MSFT.US

[tag MSFT]

[category equity research]


CSCO 2Q20 Update

Key Takeaways:

1.       Earnings results better than expected and guidance was in-line, the stock is down because management indicated on the call that the same macro-economic  factors they outlined a quarter ago continue to impact end customer spending. They continue to see elongated deal closures and scaled down or deferred projects.

2.       While weakening business confidence and a resultant slowdown in enterprise spending is a headwind for them, the secular drivers that Cisco stands to benefit from are still early stages and a looming tailwind and thus not offsetting the current macro weakness they are seeing.

3.       Their business transformation continues as their revenue mix shifts more toward more software and subscription.


Current Price: $47                            Target Price: $63

Position size: 4.5%                          TTM Performance: -1%


CSCO reported better than expected Q2 results, beating on revenue (-3.5% YoY) and EPS and guided in-line with consensus.  Q3 Revenue growth guided to -1.5% to -3.5%. Their higher mix of subscriptions is negatively impacting the top line by ~100bps. The weakness this quarter was attributed to a continuation of the weak macro environment they discussed last quarter, not company-specific issues. In August they first talked of early signs of macro weakness. That trend increased over the fall and has continued. Similar to other companies, management points to declining business confidence from uncertainties related to a  US/China  Trade  War,  Brexit, pending  election  year,  conflict  in  Hong  Kong and now the Coronavirus. While a slowdown in enterprise spending is a headwind for them, the secular drivers that Cisco stands to benefit from are intact. Long-term, Cisco stands to benefit from a product refresh cycle and evolving network demands that ultimately are driven by increasing data traffic. With rising data traffic, technologies are changing (5G, IoT, WiFi 6, AI) and networks are becoming more complex – Cisco’s products help companies solve for that by helping them simplify, automate, and secure their infrastructure. The difficult thing for Cisco right now is that these technologies are still early stages and still a looming benefit and thus not offsetting the current macro weakness they are seeing. Forward FCF yield is ~7%, and is supported by an increasingly stable recurring revenue business model and rising FCF margins. Their capital return program should limit downside – buying back shares and the 3% dividend yield that’s easily covered helps provide a floor.


Thesis intact, highlights from the quarter:

·         Guidance was in-line, and they tend to guide conservatively. They don’t miss relative to the quarterly expectations they set for themselves. They have hit (or beat) their guided top line sales numbers in 51 of the past 52 quarters. This suggests that the weakness the have been seeing may be turning a corner given sales guided -2.5% at the midpoint (w/ -100bps impact from transition to subscription). This should improve as the year progresses and they lap easier compares (which have been especially difficult this quarter and last quarter).

·         Order trends were broadly weaker as sales cycles elongated. Management again talked about smaller deal sizes and longer approval processes across industries.

·         Product mix continues to improve with more software/subscription. By year end, they target 50% of their revenue to be from software and services.  Subscription revenue was 72% of total software revenue, up 7pts YoY.

·         Operating margins improved, benefitting from the positive impact of rising software mix. This transition will continue to drive an upward trend in CSCO’s margins over the next several years.

·         By segment: Security was the strongest segment (+9% YoY) Infrastructure Platforms was the weakest (-8% YoY) segment, again driven by Service Provider routing. This should improve as Service Providers begin to build out the core of their networks for 5G. Management commented on the continued strength in the ramp of key new products  – Catalyst 9000 and Nexus 9000 (both sold w/ 3-5yr software agreements). Service revenue was up 5%, driven by software and solution support.

·         By end markets: Public sector was flat, enterprise was -7%, commercial was -4% and service provider was -11%.

·         By geography: Americas was down 8%, EMEA was down 1% and APJC was down 4%. Total emerging markets were down 7% with the BRICS plus Mexico were down 20%.


Valuation:

·         They have a 3% dividend yield which is easily covered by their FCF.

·         Capital allocation strategy of returning a minimum of 50% of their FCF to shareholders annually through share repurchases and dividends. Their annual dividend is $6B.

·         Forward FCF yield is ~7%, and is supported by an increasingly stable recurring revenue business model and rising FCF margins.

·         The company trades on a hardware multiple, but the multiple should expand as they keep evolving to a software, recurring revenue model. Hardware trades on a lower multiple because it is lower margin, more cyclical and more capital intensive.

Thesis on Cisco:

·         Industry leader in strong secular growth markets: video usage, virtualization and internet traffic.

·         Cisco is the leader in enterprise switching and service provider routing and one of the few vendors that can offer end-to-end networking solutions.

·         Significant net cash position and strong cash generation provide substantial resources for CSCO to develop and/or acquire new technology in high-growth markets and also return capital to shareholders.

·         Cisco has taken significant steps to restructure the business which has helped reaccelerate growth and stabilize margins.


$CSCO.US

[tag CSCO]

[category earnings]


Sarah Kanwal

Equity Analyst, Director


Direct: 617.226.0022

Fax: 617.523.8118


Crestwood Advisors

One Liberty Square, Suite 500

Boston, MA 02109

www.crestwoodadvisors.com


PLEASE NOTE!

We moved! Please note our new location above!


Hilton 4Q19 Results

Key takeaways:

1.       Current RevPAR trends are slowing, but still expected to be slightly positive in 2020.

2.       Their asset light model and solid net unit growth means they are less sensitive to macro driven RevPAR trends. Despite weakening RevPAR, Hilton continues to grow EBITDA and FCF/share aided by 6-7% unit growth, and a robust pipeline that represents 40% future room growth.

3.       Coronavirus is not in guidance, but likely not more than -1% impact to overall FY RevPAR and 50bps impact to unit growth. This could be ~-1% to -2% impact to FY20 EBITDA (China is only 2.7% of their EBITDA). They have shut down 150 hotels (33k rooms) in China which they are estimating could be closed for 3-6 months and an additional 3-6 months of recovery period.


Share Price: $114               Target Price: Raising to $137 from $105

Position Size: 3%              1 Yr. Return: 55%


Hilton beat on revenue and EPS – Q4 RevPAR was slightly below expectations, offset by higher licensing fees. On ~1% FY19 RevPAR growth, they grew EBITDA 10% and EPS 14%, demonstrating the strength of their asset light business model and strong unit growth. While RevPAR is weakening, Hilton’s robust development story means they are a lot less dependent on macro driven RevPAR. Their business model is structurally different than it was last cycle because they own fewer of their hotels and instead receive high margin management and franchise fees. About 7% of their EBITDA is generated from owned hotels vs over 40% in the last recession – this asset light model means less operating leverage and a less volatile earnings stream if RevPAR continues to weaken. Moreover, unit growth will aid EBITDA growth regardless of RevPAR trends. (RevPAR = revenue per available room. It’s their total room revenue divided by their total number of rooms). Their development pipeline is delivering 6-7% unit growth and has some countercyclical aspects. In 2019 they returned more than 8% of their market cap to shareholders in the form of buybacks and dividends. The stock is undervalued, trading at ~4.5% FCF yield on 2020.


Highlights:

·         Currency neutral system-wide RevPAR was -1% for Q4 and +0.8% for the full year. They maintained 2020 RevPAR guidance of 0% to +1% and expect 2020 net unit growth of 6-7%.

·         Q4 by geography – Q4 US RevPAR fell 80 bps, on softer business travel. Europe was +1.4%, Overall AsiaPac was -3.8% and w/in that China was -7.8% (includes impact from Hong Kong), Middle East & Africa was -4.3% (political tensions in Lebanon and supply growth in the UAE continued to pressure rate). Full year stats in chart below.

·         Softer business travel negatively impacted results in the US. Corporate demand (transient and group) drives 70%+ of HLT’s business system-wide.

·         Solid pipeline continues to drive capital efficient growth – Current pipeline represents close to 40% unit growth or 387k rooms. That is several years’ worth of growth w/ over 50% of that pipeline under construction, the majority of which are outside the US. More than 90% of their deals do not require any capital from them.

·         In a sensitivity analysis to a market downturn, mgmt. said they would expect flat to slightly positive growth in adjusted EBITDA and positive growth in free cash flow in an environment where RevPAR were to decline 5% to 6%. This is b/c unit growth will aid EBITDA growth regardless of RevPAR trends.

·         Continued strength in their market leading RevPAR index = counter-cyclicality – RevPAR index is their RevPAR premium/discount relative to peers adjusted for chain scale. They are the market leaders – this is helpful because it’s what leads to pipeline growth (hotel operators want to associate w/ the brand that yields the best rates and occupancy) and is helpful in a macro downturn because it’s even more crucial for a developer to be associated with a market leading brand to get financing. i.e. they would likely take more pipeline share if lending standards tighten. The other countercyclical aspect of their pipeline growth is conversions (an existing hotel changes their banner to Hilton). I.e. Hampton Inn (35 year old brand) has a RevPAR index of 120.

·         Loyalty members hit 104m and account for >64% of system-wide occupancy. Loyalty members continues to grow and % penetration continues to improve – both of which bode well for LT RevPAR trends as they typically see a doubling of wallet share once a customer signs up for the loyalty, and share improves w/ status level.  They get 75-80% share of hotel wallet from Diamond Honors customers.

·         In 2019 they returned more than 8% of their market cap to shareholders in the form of buybacks and dividends.

·         The stock is undervalued, trading at ~4.5% FCF yield on 2020.


Investment Thesis:


       Hotel operator and franchiser with geographic and chain scale diversity of 17 brands, 6,100 hotels and 970k rooms across 119 countries (Hilton, DoubleTree, Hampton Inn & Hilton Garden Inn ≈ 80% of portfolio).

       Network effect moat of leading hotel brand and global scale lead to room revenue premiums and lower distribution costs.

       Shift from hotel ownership to franchising results in resilient, asset-light, fee-based model.

       Record pipeline generating substantial returns on minimal capital will lead to increasing ROIC and a higher multiple.

       Unit growth and fee based model reduce cyclicality – Lower operating leverage vs ownership reduces earnings volatility and unit growth offsets potential room rate weakness.

       Generating significant cash which is returned to shareholders through dividends and buybacks.


$HLT.US

[category earnings]

[tag HLT]


Sarah Kanwal

Equity Analyst, Director


Direct: 617.226.0022

Fax: 617.523.8118


Crestwood Advisors

One Liberty Square, Suite 500

Boston, MA 02109

www.crestwoodadvisors.com