MSFT 1Q20 Earnings

Current Price: $139 Price Target: $150

Position size: 6.3% TTM Performance: 38%

Microsoft reported solid Q1 results, beating street high estimates on both revenue and EPS. Street is at the high end of Q2 guidance. The beat was broad based with better than expected growth in all segments. Cloud continues to be the key driver. Q1 revenue was $33B (+14% YoY) and EPS was $1.38 (+21%). Commercial Cloud business was up 39% constant currency and saw continued margin improvement, helping to drive op income up 27%. Counted w/in that is Azure, which was up 63% constant currency. They are taking share from Amazon’s cloud offering, AWS. This should continue as they are better positioned as more large enterprises, that are longtime customers, move to the cloud. Given their enterprise customer base, recent partnerships with SAP, VMware and Oracle, and superior Azure hybrid architecture, the company is uniquely positioned to capitalize on the growing demand for cloud services.

Key Takeaways:

· FY 2020 revenue guided to up double-digits and op margins are expected to increase slightly.

· Solid growth across all 3 segments:

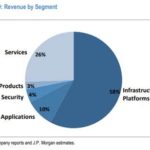
o Productivity & Business Processes, up 13% YoY, $11.1B – driven by strong performance in Office commercial and LinkedIn

o Intelligent Cloud, up 27% YoY, $10.8B – driven by continued strong growth in Azure

o More Personal Computing, up 4% YoY, $11.1B.

· Q1 Commercial Cloud (consisting of O365 Commercial, Azure, Dynamics Online, and LinkedIn Commercial – this includes some revenue from the first two segments above) was $11.6B, up 39% constant currency in the quarter.

· Within Commercial Cloud, Azure growth was +63% YoY constant currency vs. +68% last quarter. That suggests annualized revenue of ~$17B.

· Recently announced partnership with SAP makes Azure the preferred destination for every SAP customer.

· Commercial Cloud gross margins improved 400bps YoY and 100bps sequentially, driven by material improvement in Azure gross margin. Incremental cloud revenues have very high margins and should continue to drive margin expansion.

· Surface Duo – new Android-based dual-screen phone to be available next fall. Could be a promising re-entry into phone space after epic Nokia failure, but w/ Android OS instead of Windows.

Valuation:

· Trading at a 3-4% FCF yield –still reasonable for a company with double digit top line growth, high ROIC and a high and improving FCF margins.

· They easily cover their 1.5% dividend, which they have been consistently growing.

· Strong balance sheet with about $137B in gross cash, and about $51B in net cash.

Investment Thesis:

· Industry Leader: Global monopoly in software that has a fast growing and underappreciated cloud business.

· Product cycle tailwinds: Windows 10 and transition to Cloud (subscription revenues).

· Huge improvements in operational efficiency in recent quarters providing a significant boost to margins which should continue to amplify bottom line growth.

· Return of Capital: High FCF generation and returning significant capital to shareholders via dividends and share repurchases.

$MSFT.US

[tag MSFT]

Sarah Kanwal

Equity Analyst, Director

Direct: 617.226.0022

Fax: 617.523.8118

Crestwood Advisors

One Liberty Square, Suite 500

Boston, MA 02109

www.crestwoodadvisors.com

Hilton 3Q19 Results

Share Price: $94 Target Price: $105

Position Size: 2.8% 1 Yr. Return: 33%

Hilton beat on revenue and EPS, but lowered RevPAR guidance as global macro trends weaken. Despite that, EPS guidance was increased, demonstrating the strength of their asset light business model and strong unit growth. Given their robust development story, they are a lot less dependent on macro driven RevPAR. Their development pipeline is delivering 6-7% unit growth. On 0.4% RevPAR growth in 3Q, they grew EBITDA 9%. Additionally, their pipeline growth is not slowing and has some countercyclical aspects. They plan to return $1.6-$1.8B in capital to shareholders for the year (they’ve returned $1.2B so far), equating to ~7% of their market cap.

Key takeaways:

· System-wide RevPAR of 0.4%, driven by both ADR and occupancy.

· Full year RevPAR guidance lowered to 1% from 1-2% as their broad macro outlook has weakened.

· Saw softness in the US and Asia Pacific. US was +0.4% and Asia Pacific was -2.7% driven by weakness in China. China RevPAR was -5.6% – This includes impact from Hong Kong protests, where RevPAR was down 40%. Mainland China was down <3%.

· Issued 2020 RevPAR guidance of 0% to +1%. Expect 2020 net unit growth of 6-7% range.

· During the quarter they completed the sale of the Hilton Odawara Resort & Spa and subsequently entered into a 30-year management contract with the purchaser of the hotel.

· Solid net unit growth continues to drive strong performance. Pipeline of 379K rooms (>2,500 hotels throughout 111 countries). Over 200K of these hotels are outside the US and more than 50% are already under construction.

· Current pipeline represents close to 40% unit growth. With expected annual growth of about 6%, their pipeline is several years’ worth of growth with about half of it already under construction. More than 90% of their deals do not require any capital from them.

· Continued improvement in their market leading RevPAR index – RevPAR index is RevPAR premium/discount relative to peers adjusted for chain scale. They are the market leaders – this is helpful because it’s what leads to pipeline growth (hotel operators want to associate w/ the brand that yields the best rates and occupancy) and is helpful in a macro downturn because it’s even more crucial for a developer to be associated with a market leading brand to get financing. i.e. they would likely take more pipeline share if lending standards tighten. The other countercyclical aspect of their pipeline growth is conversions (an existing hotel changes their banner to Hilton).

· Tru is a fast growing new brand for them which management says has the opportunity to be much bigger than Hampton Inn. Hampton Inn is their largest brand with over 250K rooms. Demonstrating the strength in both new and existing brands: Tru has a RevPAR index of 130 (the highest brand premium in the industry) and Hampton (35 year old brand) has a RevPAR index of 120 – and a pipeline of more than 700 hotels.

· In a sensitivity analysis to a market downturn, mgmt. said they would expect flat to slightly positive growth in adjusted EBITDA and positive growth in free cash flow in an environment where RevPAR were to decline 5% to 6%. This is b/c Hilton is structurally different than it was last cycle – asset light means less operating leverage and less volatile earnings stream if RevPAR continues to weaken. Moreover, unit growth will aid EBITDA growth regardless of RevPAR trends.

· Loyalty members hit 99m and account for >60% of system-wide occupancy.

· The stock is undervalued, trading at ~6% FCF yield on 2020.

Investment Thesis:

∙ Hotel operator and franchiser with geographic and chain scale diversity of 17 brands, 5,900 hotels and 939k rooms across 114 countries (Hilton, DoubleTree, Hampton Inn & Hilton Garden Inn ≈ 80% of portfolio).

∙ Network effect moat of leading hotel brand and global scale lead to room revenue premiums and lower distribution costs.

∙ Shift from hotel ownership to franchising results in resilient, asset-light, fee-based model.

∙ Record pipeline generating substantial returns on minimal capital will lead to increasing ROIC and a higher multiple.

∙ Unit growth and fee based model reduce cyclicality – Lower operating leverage vs ownership reduces earnings volatility and unit growth offsets potential room rate weakness.

∙ Generating significant cash which is returned to shareholders through dividends and buybacks.

$HLT.US

[tag HLT]

Sarah Kanwal

Equity Analyst, Director

Direct: 617.226.0022

Fax: 617.523.8118

Crestwood Advisors

One Liberty Square, Suite 500

Boston, MA 02109

www.crestwoodadvisors.com

SHW 3Q19 Update

Current Price: $564 Price Target: Increasing to $660 from $540

Position Size: 3.7% TTM Performance: +38%

SHW beat on revenue and EPS and increased the midpoint of guidance (implies +14% YoY EPS growth). The America’s group again had impressive paint stores SSS performance of +8%. Gross margins continue to improve as recent pricing actions are gaining traction to offset raw material inflation. Performance in the quarter was driven by continued strength in North American architectural paint markets, which offset choppiness in some industrial end markets. Management talked positively about housing market strength – despite headline miss reported today in existing home sales which were down sequentially, but still up YoY.

Key Takeaways:

· SHW is benefitting from higher product prices, good volume growth, falling raw material costs and an improvement in housing.

· Margins increased in all 3 segments.

· They continue to see some softness internationally and strength in the US.

· The Americas Group: 55% of sales, +8.7%

o SSS of +8%, an acceleration from +4.3% last quarter.

o Generated strong growth in all regions and all customer end markets, led by double digit growth in residential repaint.

o Opened 31 net new stores year to date.

o Professional painting contractor customers continue to report strong demand.

· Consumer Brands Group: 16% of sales, -12%

o The decrease in the quarter was due to softer sales outside of North America, lapping load-in sales for a new customer program in 2018 and the divestiture of the Guardsman furniture protection business.

o In North America, we continued to strengthen our relationships with our largest retail partners.

o FX headwinds(-1.3%)

· Performance Coatings Group: 29% of sales, -0.3%

o Soft sales outside North America and unfavorable currency translation. FX headwinds(-1.6%)

o The segment was impacted by slowing industrial demand in some end markets, leading to slightly lower sales in the quarter.

o Despite the softer than expected top line, with moderating raw material costs margins increased YoY.

o Revenue growth strongest in coil and packaging.

Valuation:

  • Expected free cash flow of ~$2.2B in 2020, trading at >4% FCF yield.
  • Given growth prospects, steady FCF margins and high ROIC the stock is undervalued. They deserve a premium multiple based on large exposure to the N. American paint contractor market and lack of exposure to the cyclical sensitive auto OEM end market.
  • Balance sheet leverage from the Valspar acquisition continues to improve; they expect to get to under 3x by the end of the year.

· Refinanced and extended the maturity of their debt, locking in lower rates.

· Share buybacks should increase in 2020 as they get their leverage ratio down to 2-3x.

Thesis:

  • SHW is the largest supplier of architectural coatings in the US. Sherwin-Williams has the leading market share among professional painters, who value brand, quality, and store proximity far more than their consumer (do-it-yourself) counterparts.
  • Their acquisition of Valspar creates a more diversified product portfolio, greater geographic reach, and is expected to be accretive to margins and EPS. The combined company is a premier global paint and coatings provider.
  • SHW is a high-quality materials company leveraged to the U.S. housing market. Current macro and business factors are supportive of demand:
    • High/growing U.S. home equity values. Home equity supportive of renovations.
    • Improving household formation rates off trough levels (aging millennials).
    • Baby boomers increasingly preferring to hire professionals vs. DIY.
    • Solid job gains and low mortgage rates support homeownership.
    • Residential repainting makes up two thirds of paint volume. Homeowners view repainting as a low-cost, high-return way of increasing the value of their home, especially before putting it on the market.

$SHW.US

[tag SHW]

Sarah Kanwal

Equity Analyst, Director

Direct: 617.226.0022

Fax: 617.523.8118

Crestwood Advisors

One Liberty Square, Suite 500

Boston, MA 02109

www.crestwoodadvisors.com

Crown Castle Earnings Update

Crown Castle reported a good quarter yesterday with a broad beat and strong guidance. CCI beat on both site rental revenue and networks services revenue, and reported better than expected EBITDA and EPS.

Thesis intact, highlights on the quarter:

· The company is experiencing the highest level of tower leasing activity in more than a decade, and management expects this to continue.

· Organic site rental revenue was +6%

· CCI small cell pipeline in 2019 is 10 – 15 thousand nodes (trending now on the lower end around 10k)

· Management provided FY20 guidance for the first time for ~8% AFFO growth and assumes the proposed merger between T-Mobile and Sprint in 1Q20

· Strong 2020 outlook for new leasing activity for towers: +$145 million at the mid-point is $5 million higher than +$140m outlook for 2019.

· Fiber guidance reflects an expectation for improved leasing activity. Initial outlook for new leasing activity in 2020 of $165 million is +$15 million higher than the company’s 2019 outlook for $150 million in fiber solutions.

· CCI’s outlook on fiber and small cells reflects carriers’ deployment of new spectrum and densification of their networks in preparation for 5G

· Big 4 carriers make up 90% of site rental revenue – AT&T, Sprint, T-Mobile and Verizon.

· Could see churn picking up from the TMUS/S merger in 2020. However, management views a T-Mobile/Sprint merger as a long-term positive as Sprint has valuable spectrum holdings which it has not been able to fully deploy due to capital constraints, and T-Mobile appears likely to accelerate deployment of 5G as part of its anticipated integration. Management believes that the investment from a combined T-Mobile/Sprint, with or without DISH as a fourth wireless carrier, will likely more than offset the impacts of T-Mobile decommissioning duplicative sites.

· Dividend increase of 7% delivered on targeted annual range of 7-8%.

Valuation:

· Strong AFFO growth will drive the valuation (2020 expected 8% YoY). They have a 10 year AFFO CAGR of ~14%.

· High incremental margins means AFFO growth should outpace or be in line with site rental revenue growth.

· Low maintenance capex (~2% of revenue) supports high AFFO margins.

· Expected $2.479B in AFFO ($5.94/share) in 2019 is a yield of just under 5%. This is an attractive yield given the secular growth potential.

The Thesis on Crown Castle:

1. CCI is well positioned to capitalize on secular mobile data demand growth and small cell/urban opportunity.

2. Strong competitive position. Leading US tower company.

3. Toll booth business – offensive (secular growth) & defensive (4% dividend & contracted cash flows) characteristics.

4. Revenues derived from long term contracts with price escalators and good visibility.

Sarah Kanwal

Equity Analyst, Director

Direct: 617.226.0022

Fax: 617.523.8118

Crestwood Advisors

One Liberty Square, Suite 500

Boston, MA 02109

www.crestwoodadvisors.com

$CCI.US

[tag CCI]

Update on Alphabet

Yesterday 50 attorneys general from 48 states announced an investigation into anti-competitive practices at Google and Facebook – (includes DC and Puerto Rico, but not California and Alabama). The stock is not really reacting to the news. Among the concerns cited by the AG’s were the company raising costs for advertisers and questioning whether consumers are getting the best information from search results. This announcement comes after the DoJ has announced a broad review of Big Tech and is recently confirmed to be conducting an investigation of Alphabet. The FTC is investigating FB and is rumored to have plans to investigate Amazon. Below is a good excerpt from the WSJ outlining the potential case against Google. It’s not clear what the outcome may be. A required change to their business model would likely be more damaging than fines. Alphabet has been investigated by the FTC previously – in 2013 the commission voted unanimously not to bring any charges and determined that Google’s practices improved search results for the benefit of users and that any negative impact on competitors was “incidental to that purpose.” After lengthy investigations in the EU over the last few years Alphabet was fined over $9B (see below). To put that in perspective, Alphabet has over $100B in net cash on their balance sheet and produces $20-$30B in FCF annually.

Recent EU fines:

1. $1.7B in 2019 for illegal practices in search advertising aimed at cementing its dominant market position.

2. $5.1B in 2018 for abusing the market dominance of its Android operating system to extend the reach of Google’s search engine.

3. $2.7B billion in 2017 for abusing its market share to illegally provide an advantage to its own Shopping service.

The Potential Case Against Google

•That Google has used its dominance in online search to solidify its dominance in internet advertising, creating an unfair advantage over publishers and rival tech firms that sell and place ads online. Google, thanks in part to acquisitions of potential rivals such as DoubleClick, has come to dominate software tools at every layer between online advertisers and websites, including the main tech platform that connects buyers and sellers of display ads, this argument goes. That middleman status has given it great power, especially because no one else has anything like the data Google possesses on publishers, advertisers and what consumers search for. Advertisers are boosting their spending on digital ads, but much of the money goes to Google and Facebook, not publishers, whose ad revenues continue to decline. (News Corp, publisher of The Wall Street Journal, is among those raising objections.)

•That Google won or maintained its huge market share of online ad sales by excluding others that could have competed, including through contractual terms that make it harder for advertisers and publishers to work with other ad businesses that want to compete with Google. Advertisers feel they must use Google’s products, rather than tools from other companies, according to this argument. And in 2016, Google began requiring that advertisers use its tools to buy ads on its YouTube channel, which has by far the biggest audience for online videos.

Google’s Defense

•Google has an enviable place in online advertising, but it doesn’t have monopolistic pricing power. Google competes with other big tech companies including Facebook and Amazon for ad dollars, and weak demand for old advertising models—not its role in the ad-tech machinery—is the reason publishers haven’t reaped more of a windfall from digital ads.

•Google’s actions are geared toward goals like giving users the information they want, as quickly as possible. Sometimes that means directing consumers to Google sites and services, the company says. Supreme Court precedent states that companies such as Google generally have no duty to assist in promoting a rival. In a 2004 ruling, the high court threw out antitrust allegations that Verizon Communications Inc. provided insufficient service to rival telecom companies using its phone lines.

•Many of Google’s services are free to the public, with consumers effectively paying with the personal data they generate. Judges may face challenges assessing the nontraditional products that companies like Google and Facebook offer. “It’s not like having 90% of the market for toothpaste,” said Cleveland State University law professor Christopher Sagers.

Sarah Kanwal

Equity Analyst, Director

Direct: 617.226.0022

Fax: 617.523.8118

Crestwood Advisors

One Liberty Square, Suite 500

Boston, MA 02109

www.crestwoodadvisors.com

$GOOGL.US

[tag GOOGL]

Update on Q2 Earnings results…

Summary of Q2 earnings results for the S&P:

· Q2 EPS growth was -0.4% – this is better than the -2.7% expected.

· Revenue growth for Q2 was 4%. This is better than the 3.8% growth expected.

· Margins are down 50bps YoY for the S&P.

· Companies with higher international exposure are seeing lower growth because of strong dollar and weaker macro environment outside the US – see charts below.

· Percent of companies beating on revenue (56%) is well below average.

· % of companies issuing negative EPS guidance for Q3 is above average

· Highest earnings growth: health care and financials

· Biggest decline in earnings: materials and industrials. Within materials Metals & Mining earnings were down -76%. Within industrials Aerospace & Defense earnings were down -50%.

· Highest revenue growth: communication services and health care.

· Biggest revenue decline: materials.

· For CY 2019, analysts are projecting 1.5% earnings growth and 4.4% revenue growth.

· For CY 2020, analysts are projecting 10.7% earnings growth and 5.6% revenue growth.

Sarah Kanwal

Equity Analyst, Director

Direct: 617.226.0022

Fax: 617.523.8118

Crestwood Advisors

One Liberty Square, Suite 500

Boston, MA 02109

www.crestwoodadvisors.com

TJX 2Q20 Earnings Update

Current Price: $50 Price Target: $60

Position Size: 3.4% TTM Performance: 1%

TJX initially traded down after reporting revenue that missed quarterly estimates and guiding below consensus for next quarter. Since the call the stock has recovered as management indicated weather in May dampened same store sales (SSS) results which contributed to the miss. SSS in June and July materially improved. Weak SSS at HomeGoods also contributed to the miss, but mgmt. said that was almost entirely self-inflicted and not really about a weakening macro environment. Additionally, management’s commentary around their inventory positioning eased concerns of bloated inventories (inventory growth outpaced sales growth in the quarter). Full year SSS and EPS guidance maintained.

Key takeaways:

· Revenue missed on same store sales of +2% vs expected +3%.

· Traffic was again the biggest driver of SSS. E-commerce sales are not included in SSS numbers.

· EPS was in-line with expectations.

· Management sees Q3 EPS of $0.63-$0.65, below consensus of $0.68, on same-store sales growth of 1%-2%. In Q3 they are lapping their strongest quarter last year which saw a 7% consolidated comp increase and a 9% comp at Marmaxx.

· In Q2, their core Marmaxx division (60% of revenue) delivered SSS growth of +2%.

· Flat SSS at HomeGoods contributed to the miss – management attributed this to issues in a few categories which they are working to fix. This led to higher markdowns and some margin compression in this segment. Mgmt said 80% to 90% self-inflicted execution issues and very, very, very little macro environment.

· International comp sales grew an impressive 6%. Despite the challenging retail landscape in Europe they continue to take share as many other major retailers across Europe report slower sales growth and close underperforming stores.

· Higher payroll costs and escalating freight expenses from rising home-furniture penetration are margin headwinds

· Merchandise margin was down, but would have been positive ex-freight.

· In terms of inventory, mgmt. said they are “thrilled with the tremendous buying opportunities we see in the marketplace, and are in an excellent position to take advantage of them .”

· When asked on the call about the impact of tariffs they said in the “short term, we believe some of the advantageous buys that we’re making more recently could be due to early delivery of tariff category merchandise.”

· Chart below demonstrates TJX’s resistance to e-commerce and economic cycles. Despite the ramp in e-commerce share of retail over the last several years, of the companies listed below TJX is nearly half of aggregate incremental spend. The companies listed below represent ~$200B of the $275B in US apparel retail sales. Additionally, in the ’08 to ’09 period they were one of few retailers that continued to grow and post positive SSS.

Continue reading “TJX 2Q20 Earnings Update”

CSCO 4Q19 Update

Current Price: $46 Target Price: $63

Position size: 4.1% TTM Performance: 7%

CSCO reported strong Q4 results, but guided below expectations for next quarter. Revenue growth guided to 0% to +2% vs street +2.6% and Q1 adj. EPS guided to $0.80c to $0.82 vs street $0.83. Weaker than expected guidance driven by Server Provider end markets (e.g. telecoms) and China. While China is only about 3% of sales, revenue was down 25% in Q4 and is down “very dramatically” in Q1 which mgmt attributed to the trade war and said that with state-owned enterprises in China they are being uninvited to bid. Their Service Provider end markets have been weak for some time, but should improve over time as telecoms spend to build out the core of their networks for 5G. Management’s tone about the macro environment was more negative…” we did see in July some slight early indications of some macro shifts that we didn’t see in the prior quarter.”

Thesis intact, key takeaways:

· Total revenue was $13.4 billion, up 6%. Non-GAAP EPS was $0.83, up 19%. Q4 gross margin was 65.5%, up 2.3 points.

· Infrastructure platforms (largest segment, ~58% of revs) grew 6%. All of the businesses were up with the exception of routing. Switching had a great quarter with double-digit growth with the continued ramp of Cat 9K and strength of the Nexus 9K. Routing declined due to weakness in service provider end markets.

· Applications were up 11% with collaboration, AppDynamics and IoT software all up double digits.

· Security was up 14% with strong performance in identity and access, advanced threat, unified threat and web security.

· Service revenue was up 4% driven by software and solution support.

· They continue to transform their business, delivering more software offerings and driving more subscriptions. Subscription revenue was 70% of total software revenue, up 12pts YoY and 5 points sequentially. This transition will drive an upward trend in CSCO’s margins over the next several years.

· While orders were flat YoY, orders outside of service provider grew mid-single digits. Total product orders growth was flat. By geography, Americas was up 1%,EMEA was up 4% and APJC was down 8%. Total emerging markets were down 8% with the BRICS plus Mexico down 20%. By customer segments, enterprise was down 2%, commercial grew 7%, public sector was up 13% and service provider was down 21%.

· Cisco is helping their customers change their technology infrastructure to accommodate new technologies like cloud, AI, IoT, 5G and WiFi 6. Their evolving portfolio of products help customers navigate this complexity by helping them simplify, automate, and secure their infrastructure. They are in the early innings of evolving network architectures.

Valuation:

· They have a 3% dividend yield which is easily covered by their FCF.

· In their Q2 fiscal ’18 earnings call, they said they would return $31 billion through share repurchases over the following 18 to 24 months. As of Q4 fiscal ’19 they completed that commitment with share repurchases of 32.6 billion. Going forward, they will return to a capital allocation strategy of returning a minimum of 50% of their FCF to shareholders annually through share repurchases and dividends. This indicates much less buyback going forward as their annual dividend is $6B and half of annual FCF would be less than $8B.

· They have ~$9B in net cash. In the quarter they returned $6B to shareholders – $1.5B in dividends and $4.5B in buybacks.

· Forward FCF yield is ~7.5%, well above sector average and is supported by an increasingly stable recurring revenue business model and rising FCF margins.

· The company trades on a hardware multiple, but the multiple should expand as they keep evolving to a software, recurring revenue model. Hardware trades on a lower multiple because it is lower margin, more cyclical and more capital intensive.

Thesis on Cisco:

· Industry leader in strong secular growth markets: video usage, virtualization and internet traffic.

· Cisco is the leader in enterprise switching and service provider routing and one of the few vendors that can offer end-to-end networking solutions.

· Significant net cash position and strong cash generation provide substantial resources for CSCO to develop and/or acquire new technology in high-growth markets and also return capital to shareholders.

· Cisco has taken significant steps to restructure the business which has helped reaccelerate growth and stabilize margins.

$CSCO.US

[tag CSCO]

Sarah Kanwal

Equity Analyst, Director

Direct: 617.226.0022

Fax: 617.523.8118

Crestwood Advisors

One Liberty Square, Suite 500

Boston, MA 02109

www.crestwoodadvisors.com

PLEASE NOTE!

We moved! Please note our new location above!

Cisco down after hours on weak guidance

Cisco reported Q4 results that beat expectations, but guidance for their fiscal Q1 is below estimates. Revenue growth guided to 0% to +2% vs street +2.6% and Q1 adj. EPS guided to $0.80c to $0.82 vs street $0.83. More details to come.

Sarah Kanwal

Equity Analyst, Director

Direct: 617.226.0022

Fax: 617.523.8118

Crestwood Advisors

One Liberty Square, Suite 500

Boston, MA 02109

www.crestwoodadvisors.com

$CSCO.US

[tag CSCO]

BKNG 2Q Results

Current Price: $1,916 Price Target: $2,400

Position Size: 2.5% TTM Performance: -4.7%

Key Takeaways:

· Gross bookings growth was $25B up 5% YoY and up 10% constant currency. Guidance was for 4-6% growth constant currency.

· They booked 213 million room nights in 2Q, a 12% increase (6-8% guided).

· ADR’s down 1.5% a little better than the -2% last quarter. Geographic mix and stronger dollar negatively impacting ADR’s. Countries with lower ADR’s growing faster and European travelers to the US trading down b/c of stronger dollar.

· Revenues were $3.85B, up 9% (14% constant currency), better than the $3.75B expected.

· Bookings guidance for Q3 (peak travel season) was lower than expected, but they have a long history of guiding conservatively (chart below). Guidance for Q3 is +3-5% gross bookings growth constant currency, suggesting a deceleration from this quarter (partly driven by tougher compares). Despite this, management noted a “solid start to the summer travel season”

· Increased ad spend this quarter (+8%) aided higher bookings growth. They’ve been trying to “optimize” ad spend for several quarters which has been resulting in weaker bookings growth…clearly this ad spend/rev growth algorithm will continue to be a focus going forward as the trade-off between growth and spend persists.

· On the call they said “short-term return on our brand spending is running below our expectations. As a result, we plan on refining our spending levels on brand marketing in the second half of the year.”

· Investing for growth: focus on “connected trip” and payment platform that supports non-hotel properties. Investments will reduce their full year EBITDA growth by a few percentage points. Connected trip vision encompasses all of their brands w/ a goal of broadening focus from accommodations to other aspects of travel spend. They’ve been talking about this for a while, but focus here seems to be ramping with more emphasis on leveraging assets like Opentable.

· Alternative accommodations: this is their business that competes with Airbnb and HomeAway. This is growing faster than their overall business. They declined to give any details on the state of this business when asked.

· French digital services tax will have $32m full year impact.

Continue reading “BKNG 2Q Results”