Disney Update

Disney is down pre-market on below consensus Q3 results, missing on revenue and EPS. The miss was driven primarily by disappointing results at theme parks and at the acquired 21st century Fox business (21CF). Almost all of the operating income miss was the result of one-time issues that led to disappointing results at the acquired 21CF film studio and Star (India TV and streaming). They reiterated their expectation for 21CF to be accretive to EPS in FY21. Weak domestic theme park attendance was disappointing given the Star Wars Land launch at Disneyland in Anaheim. Management attributed weak attendance to admission price increases and higher hotel rates in advance of the Star Wars Land opening. Weak attendance at Disney World attributed to people deferring visits until the Star Wars Land attraction opens there later this month. Management seemed confident that these demand issues are temporary. With a slew of changes at Disney including 21CF acquisition, further acquisition of Hulu stake from Comcast, investment behind yet to be launched DTC (including forgone licensing revenue), Disney is in a spending mode ahead of an evolving business model. So it’s not surprising that results are choppy. No change in thesis, more details to come.

Sarah Kanwal

Equity Analyst, Director

Direct: 617.226.0022

Fax: 617.523.8118

Crestwood Advisors

One Liberty Square, Suite 500

Boston, MA 02109

www.crestwoodadvisors.com

$DIS.US

[tag DIS]

Black Knight 2Q19 Earnings

Share price: $60 Target Price: $60

Position size: 2.3% TTM return: 9%

BKI reported a good quarter but lowered guidance. Revenues were +6%, slightly below consensus and adj. EPS was better at $0.49 vs $0.48 consensus. Adj. EBITDA of $148m was above consensus of $146.5m. They updated guidance to the low end of the previously given range – the decrease was due to an earlier than planned client loss from a single-client product they are discontinuing. In general, the results highlight ongoing strength in their core business as they continue to win new clients and successfully expand existing relationships through cross-selling and contract renewals.

Key Takeaways:

· Despite slightly weaker than expected revenues in 2Q their strong new client pipeline in both mortgage servicing and origination software should accelerate revenue growth.

· Long term targets continue to be 6-8% revenue growth and mid-teens EPS growth. By segment, management continues to expect mid to high-single digit growth in Servicing, high-single to low-double digit growth in Origination, and low to mid-single digit growth in Data & Analytics.

· Data analytics segment (~15% of revenue) revenues were up 3% driven by growth in their property data and portfolio analytics businesses. This is a lower margin segment that has been seeing margin improvement, however this quarter margins contracted by 160bps. Adjusted EBITDA decreased 4% to $9m due to higher personnel costs as they grew their sales team

· Software Solutions segment (~85% of revenue) was up 7% driven by higher average revenue per loan and loan growth on their core servicing software solution.

o Segment EBITDA margins increased by 90bps.

o Within this segment servicing (~70% of revenue) grew 7%. This is steadier than their originations revenue. They continue to dominate first lien loans with leading share and are growing share in second lien loans. Once current commitments are implemented they will have ~70% share in first lien and ~30% share in second lien.

o Originations (~15% of total revs) made up of new loans and refi’s – revenues increased 8% driven by growth in their loan origination software business (Empower) which was up 18%. Counter cyclical aspect to this segment where falling rates bode well for mortgage origination volumes, primarily by increasing refinance activity.

· BKI has consistently performed well through tough times for their end clients, partly because they’re providing them with solutions that solve their problems like increasing efficiency and maintaining regulatory compliance.

Valuation:

· Trading at ~3.9% FCF yield –valuation is supported by growth potential, strong ROIC with a recurring, predictable revenue model (>90% recurring revenue) and high FCF margins, which is aided by high incremental margins and capex (~9% of revenue now) which should taper as they grow.

· Leverage ratio now at 3x, because of Dun & Bradstreet.

· Capital allocation priorities include opportunistic share repurchases, debt pay down and potential acquisitions.

Thesis:

  • Black Knight is an industry leader with leading market share of the mortgage servicing industry.
  • Stable business with >90% recurring revenues, long-term contracts and high switching costs.
  • BKI has high returns on capital and high cash flow margins.

$BKI.UA

[tag BKI}

Sarah Kanwal

Equity Analyst, Director

Direct: 617.226.0022

Fax: 617.523.8118

Crestwood Advisors

One Liberty Square, Suite 500

Boston, MA 02109

www.crestwoodadvisors.com
PLEASE NOTE!

We moved! Please note our new location above!

BKI down on lowered guidance

BKI beat on earnings but lowered guidance. Revenues were +6%, slightly below consensus and adj. EPS was better at $0.49 vs $0.48 consensus. They updated full year guidance to the low end of the previously given range. The decrease was due to an earlier than planned client loss from a product they are discontinuing. More details to come.

Sarah Kanwal

Equity Analyst, Director

Direct: 617.226.0022

Fax: 617.523.8118

Crestwood Advisors

One Liberty Square, Suite 500

Boston, MA 02109

www.crestwoodadvisors.com
$BKI.UA

[tag BKI}

2Q Earnings Update

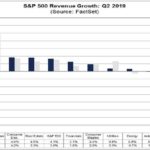
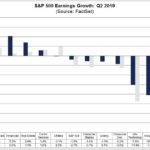
77% of the companies in the S&P 500 have reported 2Q results …

· # of EPS beats are above the 5 yr. average, # of sales beats are below average. Negative EPS guidance is above average.

· Revenue and EPS growth rates have improved since the start of the quarter:

· The blended (combines actual and estimated results) earnings decline for Q2 is -1%. This is better than the -2.7% expectation at June 30. Boeing is the largest contributor to the earnings decline for the entire S&P 500. If this company were excluded, the blended earnings growth rate for the S&P would improve to 0.5% from -1.0%.

· The blended revenue growth rate for the quarter is 4.1%. This is better than the +3.8% expectation at June 30.

· Companies with more international revenue exposure are reporting a much larger decline in revenues.

· Companies with >50% of revenues outside of the US, have a blended revenue decline of -2%.

· Companies with >50% of revenues inside the US, have blended revenue growth +6.6%.

· EPS beats are driven by healthcare, REITs and energy. Revenue beats also driven by energy and healthcare.

· 8 sectors are reporting growth in revenues, led by Communication Services and Health Care.

· 1 sector (Industrials) is reporting no growth in revenue.

· 4 Sectors are reporting EPS growth led by healthcare and energy.

· 7 sectors are reporting a decline in EPS led by materials, industrials, and tech

· Consumer discretionary has the highest P/E at 21.3x and Financials have the lowest at 11.9x.

· For CY 2019, analysts are projecting earnings growth of 1.9% and revenue growth of 4.4%.

[tag equity research]

Sarah Kanwal

Equity Analyst, Director

Direct: 617.226.0022

Fax: 617.523.8118

Crestwood Advisors

One Liberty Square, Suite 500

Boston, MA 02109

www.crestwoodadvisors.com

Update on CSCO

Couple of news items on Cisco…

1. There are reports that Cisco is cutting its workforce in China – the layoff is rumored to be mostly sales positions. CSCO has two offices in Shanghai, one for R&D and one for sales – the cut would reportedly not impact the R&D office. Cisco denied the rumor when contacted by The Global Times of China. China is about 3% of Cisco’s revenue. Cisco reports quarterly results on August 14.

2. Cisco settled an $8.6M lawsuit w/ a whistleblower over faulty video surveillance software – there were security flaws that permitted hacking of Cisco’s video surveillance software which Cisco sold to the military, multiple federal agencies, international airports, etc. The whistleblower identified the issues in 2008 and reported them to Cisco, but apparently Cisco did not alert customers until 2013 of "multiple security vulnerabilities " in the software. Cisco said, "there was no allegation or evidence that any unauthorized access to customers’ video occurred"…though video feeds could "theoretically have been subject to hacking."

Sarah Kanwal

Equity Analyst, Director

Direct: 617.226.0022

Fax: 617.523.8118

Crestwood Advisors

One Liberty Square, Suite 500

Boston, MA 02109

www.crestwoodadvisors.com

$CSCO.US

[tag CSCO]

TJX and AAPL down on new tariff announcement

TJX and AAPL down on new tariff announcement of 10% on another $300B in Chinese imports that would take effect Sept. 1. A draft list was published in May which included a long list of consumer and technology goods (including Apple’s major products). Retail/apparel names down big on the news. M, JWN, PVH, GPS, KSS, URBN all down 6-8%. As a reminder, in mid-June Apple’s Taiwanese manufacturing partner Hon Hai Precision (better known as Foxconn) told investors they have enough capacity outside of China to assemble iPhones for the US market. Most iPhone components are sourced outside of China but labor intensive assembly occurs within China. Apparently 25% of Foxconn’s production capacity is outside the mainland. This addresses concerns that Apple would need to either raise prices to offset potential tariffs or take a margin hit. Foxconn also indicated that investments are being made in India for Apple to expand production plants as a way to diversify the supply chain away from China.

Sarah Kanwal

Equity Analyst, Director

Direct: 617.226.0022

Fax: 617.523.8118

Crestwood Advisors

One Liberty Square, Suite 500

Boston, MA 02109

www.crestwoodadvisors.com

$AAPL.US

[tag AAPL]

$TJX.US

[tag TJX]

Apple 3Q19 Earnings Results

Apple reported better than expected revenue and earnings, with revenue of $53.8B vs $53.4B expected and EPS of $2.18 vs $2.10 expected. Revenue was up 1%, returning to growth, despite 300bps headwind in the quarter from currency. They also issued guidance above the street with a range of $61B-$64B for Q4 – the street was at $61B. They are making progress on diversifying away from the iPhone. This was the first quarter in many years where the iPhone represented less than 50% of revenue. They saw an impressive 48% growth with their “Other Products” business on robust wearables growth (e.g. Apple Watch). A return to revenue growth in China on a constant currency basis was a big relief given sharp declines in the last couple quarters. Services, however, were a slight disappointment at $11.5B vs consensus $11.8B – that represented 13% growth. Services is a key part of their long-term story and is higher margin. The next couple quarters will be important for the Services segment as they launch Apple TV+, Apple Arcade and Apple Card.

Key Takeaways:

· Performance in China was a key positive – they returned to growth on a constant currency basis. Last quarter they reported China revenue down 22%.

· iPhone revenues (-12% YoY) were a little light vs expectations after beating last quarter.

· Revenue excluding iPhone was up 17% from last year with growth across all categories.

· Mac sales were better than expected after weak performance last quarter. Mac and iPad sales grew 11% and 8% YoY, respectively, when broader notebook and PC market declined YoY in 2Q

· Services revenue decelerated from 16% growth last quarter to 13% growth. However, excluding a one-time item from last year and Fx headwind, currency neutral Services growth was 18%. Management reiterated their target of doubling FY16 Services revenue in FY20. Accounted for ~21% of sales and ~1/3 of gross profit.

· Paid subscriptions grew by 30M+ in F3Q19 to over 420M.

· Apple recently announced a $1B acquisition of Intel’s smartphone modem business to further their long-term strategy of owning and controlling the primary technologies behind key products. This could reduce reliance on 3rd party vendors and help Apple differentiate and expedite the development of future products. Qualcomm, who Apple had been in a long legal battle with, dominates the baseband processor market – they design the chips that allow smartphones to connect with data networks. Qualcomm was Apple’s supplier, then b/c of the legal battle they moved to Intel, now they’ll be using Qualcomm again for 5G chips, but this acquisition signals more in-house design long-term. Apple already designs in-house the processor chips (their A12 Bionic chip) that are the “brains” of their phones, iPads etc.

Valuation:

· Trading at about a 1.4% dividend yield, and >6% FCF yield.

· They have about $102B in net cash on the balance sheet. That’s over 11% of their market cap.

· The stock is undervalued and substantial buyback from management’s goal of net cash neutral will support valuation.

· In addition to the >$100B in net cash they already have, they produce about $60B in FCF annually. That’s more than all the other FAANGs combined.

· In Q3 they returned $21B to shareholders through $17B in share repurchases and $3.6B in dividends.

The Thesis for Apple:

  • One of the world’s strongest consumer brands and best innovators whose product demand

has proven recession resistant.

  • Halo effect -> multiplication of revenue streams: AAPL products act as revenue drivers

throughout portfolio – iPhone, iPod, MacBooks, iPad > iTunes, Apps, Software, Accessories,

  • Strong Balance and cash flow generation.
  • Increasing returns to shareholders via dividends and buybacks.

$AAPL.US

[tag AAPL]

Sarah Kanwal

Equity Analyst, Director

Direct: 617.226.0022

Fax: 617.523.8118

Crestwood Advisors

One Liberty Square, Suite 500

Boston, MA 02109

www.crestwoodadvisors.com

Alphabet Q2 Results – Stock up on beat

Current Price: $1,252 Price Target: $1,350

Position Size: 4.7% TTM Performance: -2%

Alphabet reported earnings, beating on the top line and EPS. Currency neutral net revenue accelerated to +24% YoY vs. +19% in 1Q. Revenue beat and acceleration was a relief after missing on the top line last quarter on a deceleration that wasn’t sufficiently explained. Additionally, some cost pressures moderated – TAC as a percent of revenue decreased and capex growth decelerated. Cloud was one of the top contributors of growth and, after over a year of no specific detail on cloud, they indicated it’s at an $8B run rate. They also announced a new $25B stock repurchase plan.

Key takeaways:

· Top growth drivers were mobile search, YouTube and cloud.

· Operating margin of 23.6% beat estimates by ~100bps as operating expense growth slowed.

· The biggest operating expense increase, once again, was in R&D expenses, reflecting their focus on product innovation. Headcount is also key driver in opex increases.

· Cloud is now at an $8B run-rate. This is double the run rate revealed in Q1 last year. On Amazon’s call yesterday they indicated that AWS growth slowed to 37% from 50% (this was slower than expected growth). Microsoft’s Azure grew 68% in the quarter. This substantiates the idea that the cloud positioning of Google, along with MSFT, is improving.

· Google had a change in leadership in their cloud business this year and is looking to triple its cloud division sales force this year.

· They mentioned some major cloud customers including Lowe’s and Vodafone,

· YouTube: channels with >1M subs grew 75%. YouTube Music and YouTube Premium now available in over 60 countries, up from five markets at the start of 2018.

· They have long talked about hardware as a growth priority for them and gave some positive data points around the most recent Pixel phone launch in May. They also said to stay tuned for a new hardware launch coming in the Fall.

· Stadia, their streaming video game business will also launch in the Fall.

· While Amazon is poised to take share in online advertising, growth in AMZN’s emerging ad business again decelerated this quarter while Google saw accelerating growth.

· Waymo announced that it has entered into an exclusive partnership with Renault and Nissan to explore driverless mobility services for passengers and deliveries in France and Japan.

· Increasing buybacks: repurchased $3.6B of stock in 2Q vs. $3B in 1Q and announced a new $25B stock repurchase plan – there’s ~$7B remaining on previous authorization.

· ESG: announced a $1 billion investment in housing across the Bay Area to help address the chronic shortage of affordable housing. And earlier this week, they invested $50 million in Housing Trust Silicon Valley’s TECH Fund, which furthers the goal to help communities succeed over the long-term and expands access to housing for those who need it most.

Valuation:

· Operating cash flow was $12.6 billion with free cash flow of $6.5 billion.

· Reasonable valued, trading at >4% FCF yield on 2020.

· $108B in net cash, ~14% of their market cap.

$GOOGL.US

[tag GOOGL]

Sarah Kanwal

Equity Analyst, Director

Direct: 617.226.0022

Fax: 617.523.8118

Crestwood Advisors

One Liberty Square, Suite 500

Boston, MA 02109

www.crestwoodadvisors.com

Alphabet Q2 Results – Stock up on earnings beat

Alphabet is up >6% after-market – they reported earnings, beating on top line and EPS. Alphabet 2Q Rev. Ex-TAC $31.71B vs street $30.84B. EPS was $14.21 vs street $11.49. Positives included strong growth in “other” revenue which includes cloud and some moderation in capex spending which has been very elevated. More details to come.

$GOOGL.US

[tag GOOGL]

Sarah Kanwal

Equity Analyst, Director

Direct: 617.226.0022

Fax: 617.523.8118

Crestwood Advisors

One Liberty Square, Suite 500

Boston, MA 02109

www.crestwoodadvisors.com

Hilton 2Q19 Results

Share Price: $96 Target Price: $105

Position Size: 2.9% 1 Yr. Return: 18%

Hilton beat on revenue ($2.5B vs $2.4B) and EPS ($1.06 vs $1.02, +23%). Full year RevPAR guidance lowered as global macro trends weaken. Despite that, EPS guidance was increased, demonstrating the strength of their high incremental margin, fee driven business. On 1.4% RevPAR growth in 1Q, they grew EBITDA 11% – again ahead of the high end of guidance and consensus. While RevPAR is weakening, they are outpacing peers and their model is a lot less dependent on macro driven RevPAR growth and much more pipeline dependent. Their pipeline growth is not slowing and has some countercyclical aspects. They reiterated their plan to return $1.3-$1.8B in capital to shareholders for the year, equating to 5-7% of current market cap. They’ve already returned almost $800m YTD.

Key takeaways:

· RevPAR of 1.4% (this was the mid-point of guidance) outperformed the industry for the 6th consecutive quarter. RevPAR increase driven by increases in both ADR and occupancy.

· Full year RevPAR guidance lowered to 1-2% from 1-3% as their broad macro outlook has weakened.

· Solid net unit growth continue to drive strong performance. Net unit growth of 7% is running ahead of originally targeted 6.5% for the year. Current pipeline of 373k rooms represents 40% unit growth. With expected annual growth of about 6%, this is several years’ worth of growth with about half of it already under construction. >50% of pipeline is outside of the US. And more than 90% of their deals do not require any capital from them.

· Continued improvement in their market leading RevPAR index – RevPAR index is RevPAR premium/discount relative to peers adjusted for chain scale. They are the market leaders – this is helpful because it’s what leads to pipeline growth (hotel operators want to associate w/ the brand that yields the best rates and occupancy) and is helpful in a macro downturn because it’s even more crucial for a developer to be associated with a market leading brand to get financing. i.e. they would likely take more pipeline share if lending standards tighten. The other countercyclical aspect of their pipeline growth is conversions (an existing hotel changes their banner to Hilton).

· In a sensitivity analysis to a market downturn, mgmt. said they would expect flat to slightly positive growth in adjusted EBITDA and positive growth in free cash flow in an environment where RevPAR were to decline 5% to 6%. This is b/c Hilton is structurally different than it was last cycle – asset light means less operating leverage and less volatile earnings stream if RevPAR continues to weaken. Moreover, unit growth will aid EBITDA growth regardless of RevPAR trends.

· Tru is a fast growing new brand for them which management says has the opportunity to be much bigger than Hampton Inn. Hampton Inn is their largest brand with over 250K rooms.

· Their model is resilient because their pipeline is their growth driver.

· China is seeing weakness – their Chinese business is largely driven by Chinese domestic leisure travelers – these consumers are being negatively impacted by the trade war. Ongoing protests in Hong Kong are also having an impact.

· Loyalty members hit 94m from 89m last quarter and account for >60% of system-wide occupancy. Goal is to have 100m members by the end of the year.

· The stock is undervalued, trading at ~6.5% FCF yield on 2019.

Investment Thesis:

∙ Hotel operator and franchiser with geographic and chain scale diversity of 17 brands, 5,900 hotels and 939k rooms across 114 countries (Hilton, DoubleTree, Hampton Inn & Hilton Garden Inn ≈ 80% of portfolio).

∙ Network effect moat of leading hotel brand and global scale lead to room revenue premiums and lower distribution costs.

∙ Shift from hotel ownership to franchising results in resilient, asset-light, fee-based model.

∙ Record pipeline generating substantial returns on minimal capital will lead to increasing ROIC and a higher multiple.

∙ Unit growth and fee based model reduce cyclicality – Lower operating leverage vs ownership reduces earnings volatility and unit growth offsets potential room rate weakness.

∙ Generating significant cash which is returned to shareholders through dividends and buybacks.

$HLT.US

[tag HLT]

Sarah Kanwal

Equity Analyst, Director

Direct: 617.226.0022

Fax: 617.523.8118

Crestwood Advisors

One Liberty Square, Suite 500

Boston, MA 02109

www.crestwoodadvisors.com