Visa 3Q – Beat and slight FY EPS raise

Current Price: $181 Price Target: $185

Position Size: 4.3% TTM Performance: 29%

Visa continued to perform well in the third quarter with better than expected revenue and EPS. Net revenue was +11% vs street +8%. EPS was $1.37 vs consensus $1.32. Full year revenue guidance reiterated and EPS guidance raised on lower client incentives. Purchase volumes accelerated from last quarter but were slightly weaker than expected. Easter was blamed for weakness last quarter and benefited this quarter. Cross border, which accounts for about a quarter of gross revenue and is higher yield, also improved. Fluctuations in exchange rates leads to choppiness in this business. They reaffirmed full-year 2019 net revenue growth of "low double-digits" on nominal basis and slightly increased adjusted EPS growth to “mid-to-high-teens.” Management said volume growth through the first few weeks of Q4 remained solid.

Key Takeaways:

· They had 52 billion transactions (+10%) on their network driving >$2.2T in total volume, +9%, an acceleration from +8% last quarter. Credit was +7% and debit was +11%.

· US payments volume growth was ~9%.

· International payments volume growth in constant dollars was +2.2%. FX was ~670bps headwind.

· They saw decent growth across all geographies.

· Announced extension of their relationship with the largest issuer, JPM, through 2029.

· More emphasis on potential of Visa Direct – this capability supports long-term secular growth in non-traditional transactions (i.e. not consumer-to-business (C2B)). This enables direct, real-time, bank account to bank account transfers and is an important capability for them long-term that drives growth in B2B, B2C, P2P, G2C. This technology, which powers Venmo and enables new payment flows like an insurance reimbursement, massively increases their addressable market. Recently closed Earthport acquisition supports this, especially with cross border.

· Contactless payment will also be a growth driver – Many markets, including the US, are very underpenetrated. In more mature markets like Australia there’s 90% penetration. Contactless = wave your card over reader instead of swipe. It leads to higher penetration of small transactions where cash tends to be used.

· Total cards outstanding up 3% to 3.4B. One third credit, two thirds debit.

Valuation:

· Strong FCF continues to support buybacks.

· Trades at a ~3.5% FCF yield. Reasonable for a company w/ >50% FCF margins, high ROIC, and, absent a recession, should continue growing top and bottom line double digits.

Thesis:

· Visa is the number one credit and debit network worldwide – accounting for about half of all credit and roughly three fourths of all debit card transactions.

· We are still in the earlier innings of the digitization of electronic payments. This is a secular tailwind supporting Visa’s growth as 1.) Electronic payments continue to replace cash 2.) Commerce moves online 3.) Consumer spending grows globally

· Visa’s asset light “toll both” business model is characterized by recurring revenues, high incremental margins, low capital expenditures, and high free cash flow.

· Visa’s recent acquisition of Visa Europe should be a nice tailwind over the next few years as the European market is in the earlier stages of electronic payment adoption and Visa is well positioned to gain market share and improve margins in the region.

$V.US

[tag V]

Sarah Kanwal

Equity Analyst, Director

Direct: 617.226.0022

Fax: 617.523.8118

Crestwood Advisors

One Liberty Square, Suite 500

Boston, MA 02109

www.crestwoodadvisors.com

PLEASE NOTE!

We moved! Please note our new location above!

DoJ Big Tech Review

Multiple news sources reporting that the Justice Department is “opening a broad antitrust review into whether dominant technology firms are unlawfully stifling competition.” This review broadly targets firms like Apple, Amazon, Facebook and Alphabet, but is not the company specific review that has been recently rumored. A specific investigation into any of these companies could also be announced. According to the WSJ quoting DoJ officials, “there is no defined end-goal yet for the Big Tech review other than to understand whether there are antitrust problems that need addressing, but a broad range of options are on the table…the department’s inquiry could eventually lead to more focused investigations of specific company conduct.”

Sarah Kanwal

Equity Analyst, Director

Direct: 617.226.0022

Fax: 617.523.8118

Crestwood Advisors

One Liberty Square, Suite 500

Boston, MA 02109

www.crestwoodadvisors.com

$GOOGL.US

$AAPL.US

[tag GOOGL]

[tag AAPL]

SHW 2Q19 – strong performance despite unfavorable weather

Current Price: $488 Price Target: $540

Position Size: 3.2% TTM Performance: +8%

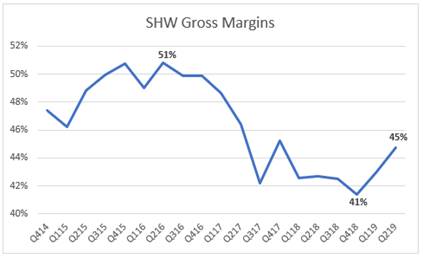
SHW missed slightly on revenue and beat on EPS. The stock is up on better margin outlook and impressive paint stores SSS performance. Margin improvement is expected with re-affirmed full year EPS guidance despite lowered sales guidance. Gross margins improved as recent pricing actions are gaining traction to offset raw material inflation. They expect continued GM improvement on stronger volumes and lower YoY raw materials. Biggest margin improvement in Consumer Brands Group and Performance Coatings, which drove the beat. They also reported strong +4.3% SSS in the Americas Group, an acceleration from last quarter. This was a relief given wet weather, lapping tough SSS, and their competitor, PPG, last week reporting flat SSS in N. America stores.

Key Takeaways:

· SHW is set to benefit from higher product prices, good volume growth, falling raw material costs and an improvement in housing.

· They continue to see softness in Asia and Europe.

· The Americas Group: 55% of sales, +5%

o SSS +4.3%

o Higher paint sales across all end markets in N. American stores and price increases.

o Segment margins increased 50bps.

o Opened 20 net new stores year to date.

o Professional painting contractor customers continue to report solid backlogs and project pipelines going forward.

· Consumer Brands Group: 16% of sales, +3.4%

o Growth due primarily to a new customer program launched in 2018 and price increases

o FX headwinds(-1.6%)

o Segment profit increased to 17.5% from 11.7% in 2Q last year due primarily to selling price increases, good cost control.

o Sales and profitability improved in N. America and Europe, but were partially offset by softer demand in Asia, Australia & New Zealand.

· Performance Coatings Group: 29% of sales, +3.8%

o Soft sales outside North America and unfavorable currency translation. FX headwinds(-2.7%)

o Segment profit increased to 11.4% from 10.5% in 2Q last year due primarily to selling price increases and good cost control.

o Revenue growth in Packaging and coil was more than offset by softness most notably in industrial wood division, which continues to be impacted by tariffs.

o Geographically, sales were up in Latin America and flat in N. America, offset by softness in Asia and Europe where sales decreased by low-double digit and mid-single digit percentages respectively.

· Guidance implies margin improvement:

o FY sales guidance lowered from +4-7% to +2-4%.

o Reaffirmed full year 2019 adjusted diluted net income per share guidance to be in the range of $20.40 to $21.40 vs $18.53 in 2018.

Valuation:

  • Expected free cash flow of ~$2B in 2019, trading at ~4.5% FCF yield.
  • Given growth prospects, steady FCF margins and high ROIC the stock is undervalued. They deserve a premium multiple based on large exposure to the N. American paint contractor market and no exposure to the cyclical sensitive auto OEM end market.
  • Balance sheet leverage from the Valspar acquisition continues to improve; they expect to get to under 3x by the end of the year.
  • Buybacks should accelerate as Sherwin returns to its historical capital allocation.

Thesis:

  • SHW is the largest supplier of architectural coatings in the US. Sherwin-Williams has the leading market share among professional painters, who value brand, quality, and store proximity far more than their consumer (do-it-yourself) counterparts.
  • Their acquisition of Valspar creates a more diversified product portfolio, greater geographic reach, and is expected to be accretive to margins and EPS. The combined company is a premier global paint and coatings provider.
  • SHW is a high-quality materials company leveraged to the U.S. housing market. Current macro and business factors are supportive of demand:
    • High/growing U.S. home equity values. Home equity supportive of renovations.
    • Improving household formation rates off trough levels (aging millennials).
    • Baby boomers increasingly preferring to hire professionals vs. DIY.
    • Solid job gains and low mortgage rates support homeownership.
    • Residential repainting makes up two thirds of paint volume. Homeowners view repainting as a low-cost, high-return way of increasing the value of their home, especially before putting it on the market.

$SHW.US

[tag SHW]

Sarah Kanwal

Equity Analyst, Director

Direct: 617.226.0022

Fax: 617.523.8118

Crestwood Advisors

One Liberty Square, Suite 500

Boston, MA 02109

www.crestwoodadvisors.com

MSFT 4Q19 Earnings

Current Price: $139 Price Target: $150

Position size: 6.4% TTM Performance: 31%

Microsoft reported solid Q4 results with better than expected growth in all segments. Cloud continues to be the key driver. Q4 revenue was $31B (+14 YoY constant currency) and EPS was $1.37 (+24% constant currency). Commercial Cloud business was up 39% and saw continued margin improvement, helping to drive op income up 24% constant currency. Counted w/in that is Azure, which was up 73%. They are taking share from Amazon’s cloud offering, AWS. This should continue as they are better positioned as more large enterprises, that are longtime customers, move to the cloud. Just two days ago AT&T chose MSFT’s cloud – one of their largest cloud commitments to-date. Given their enterprise customer base, recent partnerships with VMware and Oracle, and superior Azure hybrid architecture, the company is uniquely positioned to capitalize on the growing demand for cloud services.

Key Takeaways:

· Solid growth across all 3 segments:

o Productivity & Business Processes, up 14% YoY, $11.1B

o Intelligent Cloud, up 19% YoY, $11.4B

o More Personal Computing, up 4% YoY, $11.3B.

· For the full year Commercial Cloud (consisting of O365 Commercial, Azure, Dynamics Online, and LinkedIn Commercial – this includes some revenue from the first two segments above) was $38B. That’s 30% of total revenue, and grew 39% in the quarter.

· Within Commercial Cloud, Azure growth was 64% YoY (68% constant currency) vs. 75% cc last quarter.

· Commercial Cloud gross margins improved 600bps YoY and 200bps sequentially, driven by material improvement in Azure gross margin.

· Similar to last quarter, the only area of weakness was gaming.

Valuation:

· For the full year they returned $30B to shareholders.

· Trading at a 3-4% FCF yield –still reasonable for a company with double digit top line growth, high ROIC and a high and improving FCF margins.

· They easily cover their 1.3% dividend, which they have been consistently growing.

· Strong balance sheet with about $134B in gross cash, and about $56B in net cash.

Investment Thesis:

· Industry Leader: Global monopoly in software that has a fast growing and underappreciated cloud business.

· Product cycle tailwinds: Windows 10 and transition to Cloud (subscription revenues).

· Huge improvements in operational efficiency in recent quarters providing a significant boost to margins which should continue to amplify bottom line growth.

· Return of Capital: High FCF generation and returning significant capital to shareholders via dividends and share repurchases.

$MSFT.US

[tag MSFT]

Sarah Kanwal

Equity Analyst, Director

Direct: 617.226.0022

Fax: 617.523.8118

Crestwood Advisors

One Liberty Square, Suite 500

Boston, MA 02109

www.crestwoodadvisors.com

Update on Apple and Tariffs

Yesterday Apple’s Taiwanese manufacturing partner Hon Hai Precision (better known as Foxconn) told investors they have enough capacity outside of China to assemble iPhones for the US market. Most iPhone components are sourced outside of China but labor intensive assembly occurs within China. Apparently 25% of Foxconn’s production capacity is outside the mainland. This addresses concerns that Apple would need to either raise prices ~13-15% to offset potential tariffs or take a margin hit. Foxconn also indicated that investments are being made in India for Apple to expand production plants as a way to diversify the supply chain away from China.

$AAPL.US

[tag AAPL]

[equity research]

Sarah Kanwal

Equity Analyst, Director

Direct: 617.226.0022

Fax: 617.523.8118

Crestwood Advisors

One Liberty Square, Suite 500

Boston, MA 02109

www.crestwoodadvisors.com

TJX 1Q20 Earnings Update

Current Price: $52 Price Target: $60

Position Size: 3.6% TTM Performance: 19%

TJX reported Q1 EPS and same store sales (SSS= sales at stores open >1yr.) that were better than expected. EPS was $0.57 vs consensus $0.55 and EPS guidance was raised. SSS were +5% vs consensus +3.6%. Full yr. SSS guidance of +2-3% was maintained. They plan to buyback 2.5-4% of their market cap this fiscal year. It has again been a very mixed quarter of results so far for retailers. KSS, JWN have stood out with weak results. TJX, along with other off-price retailers, continue to take market share.

Key takeaways:

· Traffic was again the biggest driver of SSS (SSS numbers do not include e-commerce).

· Core Marmaxx division (60% of revenue) delivered SSS growth of +6%. Remarkable performance given Marmaxx’s average age of their store base is 20 years old!

· International comp sales grew an impressive 8%. Despite the challenging retail landscape in Europe they continue to take share.

· Merchandise margin was down, but would have been positive ex-freight.

· Just launched e-commerce for Marshall’s.

· When asked on the call about the impact of tariffs they said they incorporated a minor impact in their guidance. “Historically, disruptions in the marketplace have created off price buying opportunities for us.”

· Chart below demonstrates TJX’s resistance to e-commerce and economic cycles. Despite the ramp in e-commerce share of retail over the last several years, of the companies listed below TJX is nearly half of aggregate incremental spend. The companies listed below represent ~$200B of the $275B in US apparel retail sales. Additionally, in the ’08 to ’09 period they were one of few retailers that continued to grow and post positive SSS.

Continue reading “TJX 1Q20 Earnings Update”

CSCO 3Q19 Update

Current Price: $56 Target Price: Raising to $63 from $54

Position size: 5% TTM Performance: 24%

CSCO reported very strong 3Q results. Sales and EPS were better than expected and guidance was ahead of consensus. Higher tariffs are included in this better than expected guidance. Adjusted revenue was up 6% and EPS was up 18% (aided by buybacks). They delivered growth across all geographies and businesses, improving margins, double-digit EPS growth, and continued solid cash generation. “We had another strong quarter of performance across the business, demonstrating our ability to execute despite the ongoing uncertainty in both the macro and geopolitical environments.”

Thesis intact, key takeaways:

· Cisco is helping their customers change their technology infrastructure to accommodate new technologies like cloud, AI, IoT, 5G and WiFi 6.

· Their evolving portfolio of products help customers navigate this complexity by helping them simplify, automate, and secure their infrastructure. They are in the early innings of evolving network architectures, so there is a lot of runway to the growth they are seeing.

· Cisco has the only integrated multi-domain intent-based architecture with security at the foundation. It is designed to allow customers to securely connect their users and devices over any network to any application, no matter where they are.

· Tariff increase to 25% is in guidance and offset with pricing and supply chain optimization. “We see very minimal impact at this point.”

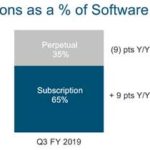
· Transition to recurring revenue model. The percentage of recurring revenue is now ~1/3 – they set a goal of 37% by 2020. They are on track to drive software revenue to 30% of total revenue by FY20. Subscription revenue was 65% of total software revenue, up 9 points YoY. This transition will drive an upward trend in CSCO’s margins over the next several years.

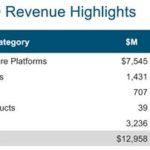
· Their largest segment, Infrastructure Platforms (58% of revenue), was up +5% YoY with solid growth across all businesses, switching had another good quarter with growth driven by the continued ramp of the Cat 9K. Routing grew driven by SD-WAN.

· Security was up 21% – pleased also with the integration of Duo into the security portfolio.

· Service revenue was up 3% driven by software and solutions support.

· By geography, Americas was flat, EMEA was up 9% and APJC was up 6%. Total emerging markets was up 5% with the BRICS plus Mexico down 2%.

· In terms of customer segments, enterprise was up 9%, commercial grew 5%, public sector was up 10%, and service provider continues to be weak, down 13%. This is similar to reports from competitors like Juniper which saw weakness in service provider. Service provider revenue is lumpy from quarter to quarter, it’s driven by only a few large customers whose capex is down YoY and will likely be weak until increased network build out of 5G.

Valuation:

· They have a 2.5% dividend yield which is easily covered by their FCF.

· Buyback authorization now at $18B, or over 7% of their current market cap.

· They have ~$17B in net cash. In the quarter they returned $7.5B to shareholders – $1.5B in dividends and $6B in buybacks.

· Forward FCF yield is 6.5%, well above sector average and is supported by an increasingly stable recurring revenue business model and rising FCF margins.

· The company trades on a hardware multiple, but the multiple should expand as they keep evolving to a software, recurring revenue model. Hardware trades on a lower multiple because it is lower margin, more cyclical and more capital intensive.

Thesis on Cisco:

· Industry leader in strong secular growth markets: video usage, virtualization and internet traffic.

· Cisco is the leader in enterprise switching and service provider routing and one of the few vendors that can offer end-to-end networking solutions.

· Significant net cash position and strong cash generation provide substantial resources for CSCO to develop and/or acquire new technology in high-growth markets and also return capital to shareholders.

· Cisco has taken significant steps to restructure the business which has helped reaccelerate growth and stabilize margins.

$CSCO.US

[tag CSCO]

Sarah Kanwal

Equity Analyst, Director

Direct: 617.226.0022

Fax: 617.523.8118

Crestwood Advisors

One Liberty Square, Suite 500

Boston, MA 02109

www.crestwoodadvisors.com

PLEASE NOTE!

We moved! Please note our new location above!
Disney gets full control of Hulu

Disney and Comcast came to an agreement giving Disney full operational control of Hulu effective immediately. Comcast continues to own its 33% stake until 2024, at which point Disney or Comcast can force a sale at a price not lower than $5.8B. The deal also ensures Hulu will continue to have access to NBCU content. This is a positive for Disney as joint operational control was the hurdle in determining an international rollout strategy for Hulu and a bundling strategy for Hulu, Disney+ and ESPN+.

$DIS.US
[TAG DIS]

Sarah Kanwal Equity Analyst, Director

Direct: 617.226.0022
Fax: 617.523.8118

Crestwood Advisors
One Liberty Square, Suite 500
Boston, MA 02109
www.crestwoodadvisors.com

Apple lawsuit

There was a Supreme Court ruling yesterday, which allowed a lawsuit from a group of iPhone users who accused Apple of overcharging for apps. The ruling didn’t express an opinion on the merits of the case it only affirmed the plaintiffs right to sue Apple and for the case to proceed in a lower court. The plaintiffs argue that developers mark up app prices to recoup a 30% commission which Apple imposes on most App Store sales. They’re asking for financial damages and allege anti-competitive behavior. It could take a couple of years before there is any concrete action to follow yesterday’s ruling. The plaintiffs still have to prove Apple had monopoly power and abused it and that the 30% Apple charges app developers is an anti-competitive overcharge. Google, which operates its own app store, Google Play, allows Android users to access apps from other sources. Apple could take that same approach.

Apple typically charges a 30% fee which is typically reduced over time. Services revenue is ~20% of total revenue. Fees from app developers is a subset of that.

Sarah Kanwal Equity Analyst, Director

Direct: 617.226.0022
Fax: 617.523.8118

Crestwood Advisors
One Liberty Square, Suite 500
Boston, MA 02109
www.crestwoodadvisors.com