Apple 1Q19 Earnings Results

Apple reported slightly better than expected Q1 results, though expectations were based on lowered guidance given by the company on Jan 2. Management cited four main factors that negatively impacted their 1Q results: iPhone launch timing vs a year ago, FX headwinds, supply constraints, weakness in emerging markets especially China. The last factor was given most of the blame. iPhone upgrades were also weaker than expected in part because the relative strength of the US dollar has made their products more expensive in many parts of the world. Revenues were down 4.5% (-3% constant currency). The decline was due to 15% lower iPhone revenue which makes up a little over 60% of sales. Though iPhone sales were down, the rest of the business grew 19%. The stock is likely up because Q2 guidance was not as bad as feared and the earnings call focused on opportunities for Apple beyond the iPhone.

Key Takeaways:

· Weakening iPhone sales and no more unit numbers – this is the first quarter where they are not reporting unit numbers. Different iPhone launch timing from a year ago impacted their results. The iPhone X launch fell into Q1 last year, instead of Q4 making the comparison tough this quarter. It is likely that average selling prices (ASPs) dropped a little this quarter because they are lapping the iPhone X launch, so the down 15% is a combination of lower units and lower ASPs. Unit sales have been a major concern given a mature smartphone market. 2018 was the 2nd year in a row of global unit declines in smartphones. The industry is expected to return to modest growth this year and next year aided by 5G compatible phones and foldable phones.

· Weakness in China –Over 100% of their worldwide YoY revenue decline was driven by their performance in Greater China. Mgmt said revenues were down $4.8B YoY, which implies revenue down 27% – despite that¸ revenues in China did grow for the calendar year. China is the largest smartphone market (30% share) and sales in 2018 were down high single digits.

· 900 million active iPhone installed base – this is a new disclosure and an important one. While units only grew 0.5% in fiscal 2018, and were in decline in 1Q19, their active base of iPhone users actually grew 9% because people are keeping their phones longer and there is a secondary market for phones. Growing their active installed base (which is now 1.4 billion devices including 500 million non-iPhone devices) is key to growing their services business.

· Non-iPhone revenue was strong – Services grew 19%, Mac revenue grew 9%, iPad sales grew 17% and the Wearables business, which includes the Apple Watch and AirPods, surged 33%.

· Gross margin disclosure – Apple is now breaking out separately gross margins of products and services. The faster growing services business has 63% gross margins vs 34% for products.

· Future beyond the iPhone – ApplePay, Apple News, Apple Music (50 million subscribers vs 87 million paid subscribers for Spotify), health tracking, AppleTV. Management also spoke of “some exciting announcements coming later this year” which I think is likely related to AppleTV.

Valuation:

· Strong balance sheet and FCF generation continue. $130B in net cash or 17% of their market cap.

· The stock is undervalued and the substantial buyback will support valuation. Management’s commitment to be net cash neutral “over time” would mean either returning to shareholders or spending on M&A their current $130B of net cash plus annual FCF production of around $60B. That’s about $300B over the next 3 years or 40% of their market cap.

· Trading at close to a 1.8% dividend yield, an 8% FCF yield and ~13.5x P/E.

The Thesis for Apple:

  • One of the world’s strongest consumer brands and best innovators whose product demand

has proven recession resistant.

  • Halo effect -> multiplication of revenue streams: AAPL products act as revenue drivers

throughout portfolio – iPhone, iPod, MacBooks, iPad > iTunes, Apps, Software, Accessories,

  • Strong Balance and cash flow generation.
  • Increasing returns to shareholders via dividends and buybacks.

$AAPL.US

[tag AAPL]

Sarah Kanwal

Equity Analyst, Director

Direct: 617.226.0022

Fax: 617.523.8118

Crestwood Advisors

One Liberty Square, Suite 500

Boston, MA 02109

www.crestwoodadvisors.com

SHW Update

SHW is down after releasing preliminary sales and earnings results this morning that were weaker than expected. Q4 sales were up 2% vs guidance of up mid-single-digits. Sales were negatively impacted by architectural paints in the US, driven by weak results in October and November (they gave guidance on Oct 25). Architectural Paints consist primarily of the chain of paint stores which had SSS of +3%. Of that, 2.5% was pricing so volumes were flattish. Sales rebounded a little in December and continue to improve. Sales for Consumer Brands and Performance Coatings Groups also fell short of expectations. Performance Coatings was particularly weak in China. As a result of the revenue miss, adj. EPS for the full year is now expected to be $18.53 compared to guidance of $19.05 to $19.20. Street was at $19.11. Their quarterly call is on Jan 31.

$SHW.US

[tag SHW]

[category Equity Research]

Sarah Kanwal

Equity Analyst, Director

Direct: 617.226.0022

Fax: 617.523.8118

Crestwood Advisors

One Liberty Square, Suite 500

Boston, MA 02109

www.crestwoodadvisors.com

Update on Apple

Talking points on Apple’s lowered guidance for Q1:

· Guidance lowered primarily because of weaker iPhone sales in China.

· Timing is causing concern because of maturing smartphone market (declined in 2017 & 2018).

· Weakness in China may be more macro related than Apple specific. Overall smartphone sales were down 8% in China in Q318 – other indicators of a softening economy (especially with luxury) include commentary from TIF, COH, SBUX, Auto manufacturers and December PMI in contraction. China is the largest market globally for smartphones (about 1/3 of the industry). iPhones sold in China only account for about 12% of Apple’s revenue.

· The last time Apple’s multiple was this low they were experiencing big declines in revenue in China – from 2016-2017 they had 6 consecutive quarters of declines and were losing share.

· Trading at an 8.5% FCF yield implies no growth. Apple has ~$130B in net cash on their balance sheet. That’s about $27/share or 19% of their market cap. They’re trading at about a 12x P/E or closer to 10x ex-cash.

· Goal of net cash neutral means they have ~$300B of cash to spend in the next 3 years or so, which is over 40% of their market cap.

· Apple reports earnings on Jan 29.

$AAPL.US

[category Equity Research]

[tag AAPL]

Sarah Kanwal

Equity Analyst, Director

Direct: 617.226.0022

Fax: 617.523.8118

Crestwood Advisors

One Liberty Square, Suite 500

Boston, MA 02109

www.crestwoodadvisors.com

AAPL down on reduced guidance

Apple reduced their Q1 guidance (they report results on Jan 29). Revenue guidance was reduced almost entirely on weaker performance in emerging markets, particularly with iPhones in Greater China. AAPL expected some weakness in emerging markets, but it turned out to have a significantly greater impact than they had projected. In a letter to investors Tim Cook pinned this on trade tensions and a weakening economy in China. “Market data has shown that the contraction in Greater China’s smartphone market has been particularly sharp” – so likely not just an Apple issue. Service segment revenues in China were strong and installed base of devices grew.

Overall, Services generated over $10.8 billion in revenue during the quarter, growing to a new quarterly record in every geographic segment, and is on track to achieve their goal of doubling the size of this business from 2016 to 2020.

$AAPL.US
[category Equity Research]
[tag AAPL]

Sarah Kanwal

Equity Analyst, Director

Direct: 617.226.0022

Fax: 617.523.8118

Crestwood Advisors

One Liberty Square, Suite 500

Boston, MA 02109

www.crestwoodadvisors.com

Selling Aramark, proceeds to TJX and HLT

Recommending we sell Aramark and add 100bps to TJX and 50bps to HLT.

Rationale for selling ARMK:

· The quality of this holding seems to be eroding – it’s one of the highest leverage ratios in our portfolio, thin margins, low ROIC, less confidence in execution, concerns of earnings quality and rising cost of capital for an acquisition driven company.

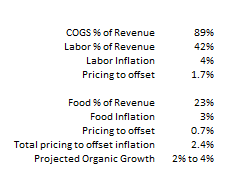
· Organic revenue growth targets 2-4%, which means almost no real growth for a company that is very exposed to rising input costs and needs to pass some through on pricing. Things like better labor productivity have aided in offsetting wage increases, but there is a limit to this.

· Gross margins are about 11% and labor is their largest expense at 47% of COGS. Food is 27% of COGS. They expect 4% inflation in pricing next year and at least 3% in food. That means they need to take almost 2.5% in price to pass this through, which may be most or all of their organic growth next year. The low end of their organic growth target is only 2%. About ~30% of contracts are pass through, so they can contractually pass along inflation.

· FCF margins average 1.7% and valuation relies on FCF margins improving. However, new contract growth has a profitability lag because they require up-front costs that weigh on margins. This will be a drag on FCF.

o They capitalize up-front cash payments for renovations of client facilities. This hits the capex line and is in “other assets” on the balance sheet (net of accumulated amortization it’s around $1B). The up-front money they are spending on build-outs and renovations are key to them winning contracts – Aramark is essentially financing these assets (restaurant build-out and equipment) for their customers, but the “cost” to the customer is in Aramark’s margin. So Aramark gets a higher margin, a more bloated balance sheet (and lower ROIC) and the customer often owns the equipment at the end…which is usually a key test of whether it’s an operating lease or a capital lease. So part of their competitive advantage vs smaller players in this fragmented market is that they can lend use of their balance sheet.

o They have a spotty track record with accruals and expect net income to outpace FCF for the foreseeable future – their capex has been outpacing depreciation for the last few years – a good reason to look at their FCF margins instead…which are razor thin and requires lending out their balance sheet.

· Stock based comp is resulting in share dilution which they expect to be about 1% per year.

· The opportunity with this name and the thesis is about consolidating a fragmented industry…which does seem to be a big opportunity, but they haven’t been executing as well as hoped. While they benefit from scale, some of their technology initiatives they talked about in their investor day highlight a difficulty with their model: complexity. They try to manage wage inflation through improved labor scheduling because when they don’t, they have excess overtime and use of (higher cost) agency labor. They’ve acquired different technologies to help them manage this and help manage rising food costs. They do benefit from scale in purchasing power, but they also seem to suffer from it a little as well in the sense that this is an extraordinarily low margin business and they need to manage a gazillion employees and varied ingredient costs. The magic in restaurant chains can be that they keep stamping out the same box over and over again. Same menu, same labor model, consistent four wall margins. For Aramark, each “box” is more built to suit. Menus can be unique, labor requirements vary. In an environment of rising input costs it can make things very difficult.

$HLT.US

$ARMK.US

$TJX.US
[category Research Trade]
[tag AAPL]

[tag ARMK]

[tag HLT]

[tag TJX]

Sarah Kanwal

Equity Analyst, Director

Direct: 617.226.0022

Fax: 617.523.8118

Crestwood Advisors

One Liberty Square, Suite 500

Boston, MA 02109

www.crestwoodadvisors.com

Selling CTSH, proceeds to AAPL and IVV

We are selling Cognizant and adding 75bps to Apple and 175 bps to IVV.

Rationale for selling Cognizant:

· Labor arbitrage model of offshore outsourcing is becoming less attractive.

o Offshore wages are rising, narrowing the wage gap.

o While digital is driving growth, it only accounts for 29% of revenues. Growing at over 20%, this accounts for basically all their organic growth. Other 70%, legacy business has challenges and some negative impact from digital trends.

o The cloud is leading to lower labor intensity in some of CTSH’s key areas. This is also leading to less attractive contract terms and a loss of pricing power.

o Much of their India labor base (70% of their labor force) needs to be re-skilled – shortage of relevant skills is driving attrition and wages, which means CTSH is paying to train a labor force they are having a hard time keeping.

o Attrition and data security concerns (especially in data sensitive industries) is driving some insourcing, where companies hire their own teams offshore.

o Barriers to entry are eroding – customers are increasingly using smaller competitors with niche technology expertise.

Rationale for adding to Apple:

· Attractive valuation underpinned by high loyalty installed base and recurring revenue of services.

o A conservative DCF with low-single digit top line growth and slightly eroding FCF margins gives a >$200 PT. Current price is $168.

o As an alternate sum-of-the-parts view:

§ Subscription model companies trade at around an average multiple of 8x EV/annual recurring revenue (ARR). The multiple varies depending on growth.

§ 8X Apple’s very high-growth Services business ($40B annual run rate) contributes $320B in enterprise value.

§ Apples total EV is $677B (mkt cap is ~$800 less about $123B in cash). That means the rest of the business underpins the remaining $357B.

§ An LTV analysis of Apple’s high-loyalty installed base of iPhones already supports most of their valuation. LTV analysis is basically the net present value of a subscriber.

§ LTV can vary a lot depending on assumptions, so I use this as more of a scenario analysis: Apple has a 1.4B installed base of devices. Assuming an average of 1.5 devices per user and 90% iPhone penetration, that gives an installed base of about 840m (estimates vary, but this is slightly conservative). ASP’s are about $800, which can loosely be translated to an ARPU of about $215 using a 3.5-4 yr replacement cycle (again conservative). Further assuming a mid-30% contribution margin (or around $75/sub), no attrition, no growth, and an 8% discount rate this can be viewed as a perpetuity. These assumptions basically support Apple’s entire enterprise value. No attrition is the only non-conservative assumption. They actually don’t need to maintain ASP’s to make this math work either, they just need to maintain the recurring $75/head.

§ So, clearly, backing into an LTV based on a $357B enterprise value bakes in some bearish assumptions for what is the world’s most valuable consumer franchise. Moreover, this assigns no value to sales of iPads, Macs, Apple Watch etc.

§ While smartphones are maturing, Apple has a record of successfully transitioning from one product to the next…Mac to iPod to iPhone. They have done this with the assistance of multiple bolt-on acquisitions and have a lot of cash to do the same with Services. They also have had massive success without being first to the game…Blackberry, for example, led in smartphones before them. There are massive opportunities with Apple Music, Apple Pay, potential print & video subscription model, health wearables, CarPlay etc.

§ Including cash on the balance sheet and annual FCF production, they have >$300B in cash to deploy over the next 3 years to be net cash neutral (which is a stated goal). That’s over a third of their market cap.

Sarah Kanwal

Equity Analyst, Director

Direct: 617.226.0022

Fax: 617.523.8118

Crestwood Advisors

One Liberty Square, Suite 500

Boston, MA 02109
www.crestwoodadvisors.com

Black Knight Investor Day summary

BKI held an investor day last week. The key takeaways are that they maintained their long term growth expectations, but growth will now be more reliant on their ability to cross-sell products like data analytics. Additionally, they announced an investment in Dun & Bradstreet which has resulted in some weakness in the stock.

· LT outlook unchanged – Given higher penetration in 1st and 2nd lien loan servicing (70% of revenue), this suggests confidence in their cross-selling opportunities.

· Guidance is for 6-8% revenue growth, 50-100bps of margin expansion per year, and mid-teens EPS growth. They aim to keep leverage ratio at 3x.

· Growth opportunity:

o Revenue drivers are 1pt from loan growth, 2pts from rev/loan (price escalators and renewals), and 3-5pts on sales from new clients and from higher share of spending with existing clients (i.e. cross-selling).

o Most of their business is recurring revenue (93%) based on long term contracts. Servicing accounts for about 70% of their business and is not susceptible to exogenous factors like interest rates which can impact mortgage originations. It is based on the volume of mortgages outstanding. They have over 70% market share of the 1st lien market and, w/ their pipeline, about 30% of 2nd lien. This gives them an opportunity to sell their origination software (where their market share is quite low) and data analytics to existing customers.

· Dun & Bradstreet acquisition:

o $375m for <20% stake. They will draw down on their revolver to finance this.

o BKI CEO (Anthony Jabbour) will also be DNB CEO, but will be run as a separate company.

o DNB is a leading source of commercial data analytics and insights for businesses. Their data helps companies gauge risk management matters like who to extend credit to, will a customer pay on time, what credit limits they should set and how to avoid supply chain disruptions. That business is ~60% of revenue. Their other 40% of revenue is Sales & Marketing Solutions which provides things like lead generation, digital marketing solutions and market research.

o There is some skepticism around this acquisition for several reasons. For starters, it may occupy a lot of Anthony Jabbour’s time which could be detrimental to BKI. Also, there are no obvious synergies…nor did management specifically point to any. DNB’s data has different use cases, different end markets and they have struggled with organic growth. I think the commonality is really around two companies that have unique data sets which could be valuable as utilization of AI progresses because, as many are saying, “data is the new oil.”

o Management’s justification for the acquisition is that it diversifies them away from the mortgage market and they said that “the other compelling value for us in this space is we’ll have a front row seat to see how this industry unfolds over the coming years. And we think that’s an option that’s really worthwhile for us because of where we think this company can grow on a pure financial basis, but also where it can help us from our ability to really become further and further ahead of the pack in the data and analytics industry.” This is clearly lacking in any real detail, but it was as close to a justification as they gave. And I think it is consistent with my prior point about how they view their potential with AI.

· An example of their cross-sell opportunities:

o AIVA is their AI technology that can help clients automate what is still a very paper intensive origination process.

o Mortgage originations are expensive and getting more expensive partly because they are so labor intensive. They are also prone to errors. Why? A mortgage processor receives roughly 50 documents per loan, which equates to about 280 pages per loan. With over 7m originations projected for 2018, the mortgage industry is processing 350 million documents or 2 billion pages.

o The documents need to be verified, classified and entered into an origination system. AIVA can read, analyze and extract the data. It then creates queues of documents for a processor to scan and make corrections. In doing this, each new set of origination documents serves as training data, making AIVA “smarter” and more efficient.

o This obviously would speed up, lower the cost and increase the accuracy of the process. BKI says it reduces a 95 minute process to a 5 minute process. They are still in the early stages of selling this.

Sarah Kanwal

Equity Analyst, Director

Direct: 617.226.0022

Fax: 617.523.8118

Crestwood Advisors

One Liberty Square, Suite 500

Boston, MA 02109
www.crestwoodadvisors.com

Fun Fact on TJX

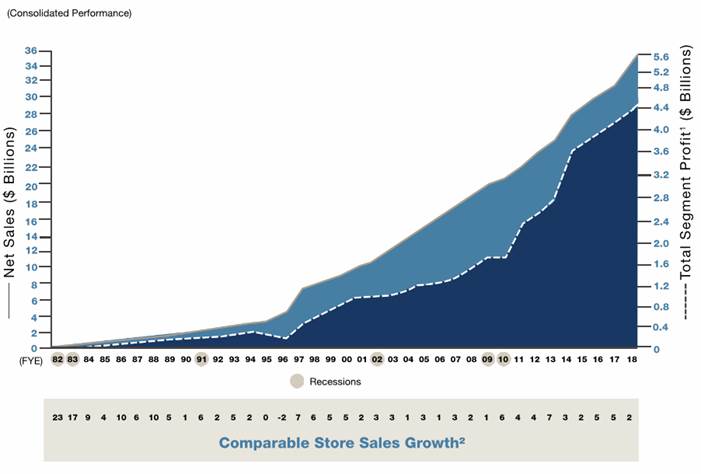
TJX has only had one year of negative comparable store sales growth in their 41 year history. Below is a chart going back to 1982 with comparable store sales at the very bottom – the only year it was negative is 1996. So, despite the severity of the last recession, they saw growth. Comparable store sales is also referred to as same store sales (SSS) – it measures year over year sales growth of stores open at least 12 months, so it excludes the impact of store openings or closures. Some companies include e-commerce sales in this measure – TJX does not.

[tag TJX]

Sarah Kanwal

Equity Analyst, Director

Direct: 617.226.0022

Fax: 617.523.8118

Crestwood Advisors

One Liberty Square, Suite 500

Boston, MA 02109
www.crestwoodadvisors.com

TJX 3Q19 Earnings Update

Current Price: $47 Price Target: $60 (updated for the stock split)

Position Size: 2.3% TTM Performance: 29%

TJX reported a good quarter amidst a tough day with retailers. They beat on revenue and were in line on EPS. There’s a theme emerging from retail generally – demand is strong but profits are pressured by rising wages, higher freight, higher cost of e-commerce fulfillment. A bunch of retailers are down today on generally strong SSS, but increasing profit pressure. SSS have been robust driven by high consumer confidence, record unemployment, rising wages, tax cuts. Retail sales growth for the holiday season is expected to be ~4.5-5%, which is really high.

· TJS Q3 SSS were an impressive +7%. This was an acceleration from +6% last quarter. Traffic was again the biggest driver. Core Marmaxx division (60% of revenue) delivering SSS growth of 9%. HomeGoods SSS were +7%. SSS numbers do not include e-commerce.

· Full year SSS guidance raised to 5% for consolidated TJX and raised to 6% for Marmaxx division. Q4 SSS guidance is 2-3%. Excluding impact of the tax act, EPS guidance raised from $2.06 to a range of $2.08 to $2.09

· For next year, they are expecting incremental margin pressure to continue from freight, wage increases, and supply chain investments. They expect freight and wage each to have about a 2% negative impact to EPS growth in fiscal 2020.

· In the Q3, gross margins were lower than expected driven by lower merchandise margin. While merchandise margin was down, it would have been up excluding freight costs. This is the same trend as last quarter. This was offset by better SG&A leverage.

· Inventory was up 17%, well ahead of sales. This is not alarming given robust SSS – it is a function of buying strategy based on inventory availability.

· Management was again resoundingly positive regarding inventory availability. They said they continue to see “abundant” availability of supply not just of inventory generally, but of better brands.

· Performance was solid across all divisions and geographic regions.

· Despite a “challenging consumer environment”, Europe continues to do well and they are taking share. International (Europe & Australia) SSS were +3% a slight deceleration from 4% last quarter. They have over 500 stores in Europe- in mainland Europe, they are in only 4 markets: Austria, Germany, Poland and the Netherlands. They also have stores in the UK.

· Canada also saw a slight deceleration to +5% from +6% last quarter.

Continue reading “TJX 3Q19 Earnings Update”

CSCO 1Q19 Update

Current Price: $46 Target Price: $54

Position size: 4.4% TTM Performance: 30%

Thesis intact, key takeaways:

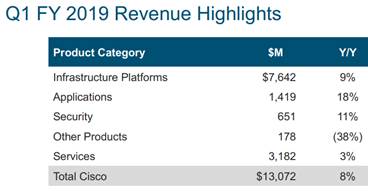
· Cisco reported a really solid Q1 with better than expected sales and EPS and issued guidance in-line with consensus. Top line growth was ~8%. FY19 sales growth is expected to be +5-7% and GM guided better than expected.

· Impact of the 10% tariff was immaterial in the quarter. They were able to offset with pricing. Their guidance assumes some impact from the tariff escalation to a 25%.

· The transformation they laid out 3 years ago is working, driven by their transition to a software and services focused business. They accelerated revenue growth, expanded margins, generated strong operating cash flow and double-digit EPS growth.

· Growth was broad-based across all geographies, product categories, and customer segments.

· The percentage of recurring revenue is now ~1/3 – they set a goal of 37% by 2020.

· Gross margins increased by 110bps YoY mostly driven by Product gross margins, while Service margins where basically flat.

· Switching had another great quarter and routing returned to growth.

· Campus switching strength – Infrastructure Platforms segment (58% of revenue; +7% YoY) driven solid demand for their Catalyst 9k products. Catalyst 9K was launched last year and is only sold with a subscription. The product is a key part of their strategy of shifting to recurring revenue. It involves “intent-based networking” – this automates configuration, saving labor hours. The reason it’s relevant and resonates with customers is because networks are becoming more complex. Enterprises are expanding to multi-cloud and hybrid-cloud environments with growing data traffic from a proliferation of new devices.

· They have $43B in cash. In the quarter they returned $6.5B to shareholders through dividends and buybacks.

Valuation:

· They have close to 3% dividend yield which is easily covered by their FCF.

· Forward FCF yield is over 7%, well above sector average and is supported by an increasingly stable recurring revenue business model and rising FCF margins.

· The company trades on a hardware multiple, but the multiple should expand as they keep evolving to a software, recurring revenue model. Hardware trades on a lower multiple because it is lower margin, more cyclical and more capital intensive.

Thesis on Cisco

· Industry leader in strong secular growth markets: video usage, virtualization and internet traffic.

· Significant net cash position and strong cash generation provide substantial resources for CSCO to develop and/or acquire new technology in high-growth markets and also return capital to shareholders.

· Cisco has taken significant steps to restructure the business which has helped reaccelerate growth and stabilize margins.

$CSCO.US

[tag CSCO]

Sarah Kanwal

Equity Analyst, Director

Direct: 617.226.0022

Fax: 617.523.8118

Crestwood Advisors

One Liberty Square, Suite 500

Boston, MA 02109

www.crestwoodadvisors.com

PLEASE NOTE!

We moved! Please note our new location above!