Booking Holdings 2Q Earnings Update

Current Price: $1,896 Price Target: $2,400

Position Size: 3% TTM Performance: 18%

· Revenue (+20%) and EPS (+36%) were better than expected, but guidance was a disappointment. Gross bookings were basically in line with consensus at $23.9B, up 15% (11% constant currency).

· They saw EBITDA margin expansion this quarter, but guided to weaker than expected margins next quarter.

· Though they do have a track record of guiding conservatively (see below), their expected deceleration in gross bookings to 5% to 8% constant currency growth is meaningful.

· In general, these results are very similar to last quarter as they continue to prioritize profit over growth. Part of the disappointment is that weak room growth is happening while the global travel market is extremely healthy. Though, this disruption to room night growth is somewhat self-inflicted.

· Room night growth slowing due to reduced ad spend:

o Current quarter was good, but they guided to a slowdown in Q3. Room growth for Q2 was +12% ahead of the high end of their +7-11% guidance. Guidance for next quarter is 6-9% (consensus +13%). They blamed the deceleration on the World Cup and weather (heatwave) in Europe.

o Ad spend has been part of their engine of growth and their ability to spend at scale has enabled their success. They have been trying to dial this back for several quarters.

· They want people to go directly to them to book in the same way they go directly to Amazon to buy something. This means less performance ad spend and more general brand advertising like TV. They are seeing an increase in direct booking as a result.

· On the call they said “I think we are in a fairly good position in terms of our optimization right now in terms of the balance between growth and profitability but there are always areas where we’re experimenting constantly in these channels”

· If they succeed in making the shift to higher ROI brand ad spend and continue to increase direct traffic as a % of the mix that should help margins long-term. But if this experiment doesn’t start paying off, I expect they re-adjust ad spending. Whether or not they need to back track on this calculated bet, the long-term thesis is still intact.

· They continue to work on a local experience product through both organic investment and acquisitions.

Continue reading “Booking Holdings 2Q Earnings Update”

Cognizant 2Q18 Earnings Results – Weaker Revenues at Better Margins

Current Price: $77 Price Target: $101

Position Size: 3% TTM Performance: 20%

Cognizant reported 2Q18 revenue up 9% but below the street and at the low end of guidance. This included a $31m rev benefit from the adoption of new accounting rules. Excluding the accounting change, rev was up ~5%. Lower than expected revenue is on weakness in their largest end market, financial services. Higher gross margin, lower OpEx, and a lower tax rate led to EPS that was ahead of consensus, $1.19 vs $1.10. They maintained fully year revenue guidance, but street is well ahead of the midpoint of full year guidance. FY EPS guidance raised and is slightly ahead of consensus. Q3 rev and EPS guidance was below the street.

· Their high exposure to legacy IT, exposure to financials, and a growing war for talent, is leading to concerns that achieving both revenue growth and margin expansion may be difficult for them.

· “The story among large money-centric banking clients remains mixed.” Financials are their largest end market and they continue to see weak spending at banks on legacy IT work. On a positive note, they are seeing some digital work at banks that is offsetting some of this decline – they gave examples of projects related to blockchain implementation, cloud migration and AI related work. “We are optimistic about this shift because banks have realized that they have no choice but to rewrite their futures with digital.”

· Weak guidance for Q3 and high employee attrition (hit 22% this quarter) are also a concern.

· Despite this, Cognizant will continue to benefit from an overall strong IT spending environment and some of their slower growth end markets should improve. Spending from banks should improve as rates rise and healthcare will continue to improve with the transition to value based care. Legacy represents the vast majority of IT spend and it is still early innings of the digital transformation that is occurring across industries. Continue reading “Cognizant 2Q18 Earnings Results – Weaker Revenues at Better Margins”

AAPL Q318 Solid Quarter and Closing in on $1 trillion

Current Price: $205 Price Target: $230

Position Size: 3.6% TTM Performance: 28%

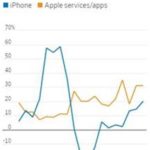
Apple beat on top and bottom line and issued guidance ahead of consensus. They missed by a very small margin on iPhone units (41m units), but this is not a key quarter for phones given new product launches in Sept. Revenues were up 17% an acceleration from last quarter and their 7th straight quarter of accelerating growth. EPS was up 40%. Growth was impressive across products with the exception of Mac and iPad. iPhone revenues were +20% almost entirely driven by price increases. Services grew 31% to $9.5B representing 18% of rev in the quarter. “Other” revenue was up 37% driven by Wearables (Apple Watch, AirPods and Beats) which were up 60%, exceeding $10B for TTM. Mac and iPad revenues were both down 5%. Together they account for about 18% of TTM revenue.

[MORE]

Thesis intact. Key takeaways:

  • Buybacks – they have repurchased almost $220 billion of their stock (including $20B this quarter) since they announced in March 2012 that they would start to buy back shares (and pay a dividend). Since that time, shares outstanding have dropped by about 25%.
  • Price increases are sticking – iPhone X was the most popular phone in the quarter again which drove the ASP up 20% to $724. Market share leader Samsung recently reported smartphone revenue down 22% driven largely by lower ASPs, citing “intense price competition.”
  • Demand is strong – substantiated not just by their ability to take price, but 3.5m units of lower channel inventory means demand was stronger than what was reported.
  • Gaining share – Not surprising given the last point, iPhones grew faster than the market, taking share in many geographies including the US and Greater China. Units in the US were up double digits.
  • Services performance is playing into bull thesis – Apple’s ability to monetize their >1.3B installed base through higher margin services is widely viewed as the bull thesis on the stock and next leg of growth as the smartphone market matures. (Higher margin less investment) They are on track to meet services revenue target ($50B in 2020) sooner than planned. They hit 300m paid subscribers (+60%) though they don’t break this out at all. This nice thing about this leg of growth is that it’s highly margin accretive and requires less investment in the sense that they sort of crowdsource some R&D by harnessing the power of an army of outside app developers and then share in the value they create.
  • Exclusive content is a focus – This quarter they announced a partnership with Oprah for original content.
  • Active installed base on iPhone grew double-digits. With units only up slightly this underscore the lengthening replacement cycle which started with the decline in subsidized phone plans.
  • China – Revenues were up 19% in the quarter, slightly trailing US growth. Represents 18-19% of total sales. Top 3 selling phones in the quarter were iPhones and iPhone X was the number one phone. They opened their 50th retail store in China during the quarter.
  • While Services are widely considered as the next growth opportunity, Apple also has the opportunity to grow in Enterprise. This is not really talked about much yet, but I think several things hint at their Enterprise aspirations. Tim Cook gave multiple examples on the call of how enterprises are now using iPads and iPhones (they even gave a shout out to Aramark as an example). Earlier this year they announced a new initiative that will make is easier for developers to make apps available on Macs. So apps will work across devices. With most businesses now being BYOD, having a desktop that functions seamlessly with the mobile devices that employees are already using makes sense. MSFT did this with Windows 10. It was the first version of Windows that was the same across devices. But the prevalence of Windows on desktops didn’t drive purchasing decisions on mobile. Apple may have an opportunity in the reverse. On the call Luca Maestri said “more and more companies are giving their teams a choice when it comes to the devices they use at work, including Salesforce…the majority of their 35,000 employees are using Macs.” And Cook said, “We’re working with key partners in the enterprise to change the way work gets done with iOS and Mac.” Global PC shipments last year were 262m units and Apple only has about 7% unit share. https://www.itproportal.com/features/the-rise-of-apple-in-the-enterprise/
  • Trade:
    • Tim Cook’s view on tariffs generally: “They show up as a tax on the consumer and wind up resulting in lower economic growth and sometimes can bring about significant risk of unintended consequences.”
    • View on current tariffs: Of the three tariffs implemented so far, none of their products are directly affected. For the proposed 4th tariff of $200B that’s in comment period, they are evaluating and will give their feedback to Washington. It’s a “tedious process” and they’re not commenting publicly on that yet.
  • “Cord cutting is going to accelerate and accelerate faster than widely thought.” (AAPL and GOOGL are both potential beneficiaries of this).

Valuation:

  • Strong balance sheet and FCF generation continue. $129B in net cash. YTD FCF is about $48B, full yr should be about $64B.
  • The stock is undervalued and the substantial buyback will support valuation. Trading at close to a 1.5% dividend yield, a 7% FCF yield and a <15x P/E.
  • Returned almost $25 billion to investors during the quarter, including $20B in share repurchases. They have $90B left in their authorization.

The Thesis for Apple:

  • One of the world’s strongest consumer brands and best innovators whose product demand

has proven recession resistant.

  • Halo effect -> multiplication of revenue streams: AAPL products act as revenue drivers

throughout portfolio – iPhone, iPod, MacBooks, iPad > iTunes, Apps, Software, Accessories,

  • Mac gaining share in PC market and iPhone robust global demand driven by China/EM.
  • Strong Balance and cash flow generation.
  • Increasing returns to shareholders via dividends and buybacks.

$AAPL.US

[tag AAPL]

Sarah Kanwal

Equity Analyst, Director

Direct: 617.226.0022

Fax: 617.523.8118

Crestwood Advisors

One Liberty Square, Suite 500

Boston, MA 02109

www.crestwoodadvisors.com

PLEASE NOTE!

We moved! Please note our new location above!

Black Knight 2Q18 Earnings

They missed slightly on top line, beat on EBITDA and EPS and reiterated full year guidance. The street is at the high end of their guidance for the year. Revenues were up 5% – a consistent pace with last quarter. Data analytics segment (~15% of revenue) revenues declined 4% as they lapped some upfront revenues from long-term strategic license deals. Growth going forward in this segment should be ~3-5%. Software Solutions segment revenues were up 7% as servicing grew 7% and originations grew 5%. This segment is 85% of revenue and is comprised primarily of servicing revenue (75% of total revs) which is steadier than their originations revenue (10% of total revs). On the servicing side, they continue to dominate first lien loans with 62% share and are growing share in second lien loans. At the end of 2017 they had 13% share of second lien, they now stand at 17% share and expect to reach 30% once current commitments are implemented. Originations continue to be negatively impacted by rising rates, but the drag from lower refinancing activity is diminishing as it’s a shrinking portion of segment revenue.

Key Takeaways:

· Guidance seems conservative given they expect an acceleration in revenue growth through the rest of the year that would come at high incremental margins.

· Returned to growth in the Origination business after a stretch of declines driven by lower refinancing activity.

· Better EBITDA margins driven by higher mix of Software Solutions segment revenues and better margins in that segment.

· In June they acquired an AI company called HeavyWater to gain AI capabilities. Their “AIVA” AI technology will help lenders and servicers complete manual, repetitive tasks more efficiently. It can be used to automate tasks like verifying income and assets in the loan origination process, replacing hours of work per loan and improving the quality of the process.

· They are not expecting revenue from HeavyWater in ’18, but expect there to be a $2m headwind to adj. EBITDA in the second half, spread equally between Q3 and Q4.

· New products:

o Service Digital – customer facing mobile tool that enables mortgage payment, scenario analysis on refinancing etc. Banks can use to help in customer retention and cross-selling. Will help BKI grow rev per loan.

o Actionable Intelligence Platform – analytics platform launching in August. Will also help BKI grow rev per loan.

Continue reading “Black Knight 2Q18 Earnings”

Visa 3Q18 Earnings Update

Current Price: $142 Price Target: Raising to $160 from $135

Position Size: 3.3% TTM Performance: 41%

· Reported better than expected quarter and raised EPS guidance. Full year EPS growth expected up low 30% vs prior up high 20%.

· Visa Europe accretion quicker than expected. They expect double-digit accretion this year which is two years ahead of plan.

· Broad based growth in global purchase volume, +11%.

· Client incentives lower as a % of revenue, reversing longstanding upward trend.

· Stronger dollar caused slight deceleration in cross border volumes (+10%). Highlights the impact on their business to a strengthening dollar –i.e. not just translation but also transactions.

· B2B initiatives progressing – 11% of volume now, growing at a faster rate than the overall business. Retail payment market is $45 trillion; B2B market is $120 trillion.

o Blockchain and “B2B Connect”: Processing speeds make blockchain impractical for low-value high-volume transactions (most of their existing business), but it is applicable for high-value, low-volume cross-border B2B transactions. These transactions are “one of the largest single pain points in B2B payments today” – Visa is piloting a blockchain based technology to address this called “B2B Connect.”

Visa reported very strong 3Q18 results and raised guidance. Beat driven by higher data processing revs and lower client incentives. Net revenues were up 15% and full year revenue growth guidance maintained at up low-double-digits. Guidance includes lower incentive outlook and lower projected tax rate of 20.5% – 21.5% (from 21-22%). In a reversal of last quarter trends, they saw weakness in cross-border volume driven by a stronger dollar. Because so much of Visa’s revenues (almost 28%) are generated from cross-border (spending in a country different than the card’s origin) their business is susceptible to currency fluctuations. Constant currency payment volumes were up 11% and processed transactions were up +12%. The integration of Visa Europe is progressing ahead of expectations and nicely accretive to margins. Cards outstanding grew 4% (to 3.3B), with 4% growth in credit cards and 4% growth in debit cards.

Visa is continuing to develop new avenues for growth as the payments industry changes. Contactless payment penetration continues to rise globally (e.g. FitBit and Garmin embedding Visa tokens in devices). They are positioning themselves to grow in the evolving P2P and B2B markets. For example, in March they acquired Fraedom to help expand their B2B business. This expands their addressable market from the $45 trillion retail payment market to the $120 trillion B2B market and the $60 trillion P2P market. Visa is also in the early stages of standardizing their digital checkout with the “Common Button” – an association with Amex and MasterCard to offer a common user interface for digital payments. The platform will create a single button checkout across sites and devices, eliminating the friction of online checkout across various sites.

Continue reading “Visa 3Q18 Earnings Update”

Sherwin Williams 2Q18 Earnings

Current Price: $432 Price Target: $480

Position Size: 2% TTM Performance: 25%

· Sherwin reported better than expected revenue and EPS for 2Q and guidance for the year was raised, aided by a lower tax rate. FY18 EPS for core business expected to increase 24% at the midpoint.

· Margins impacted by raw material costs (mainly propylene) that are trending slightly higher than the 5-6% that was expected.

· Volumes were strong across segments – they are taking share. Competitor PPG reported earnings recently and is losing share in architectural paint to SHW particularly at Lowe’s.

· Commentary around demand trends improved sequentially – last quarter they talked about a “slow start to the painting season in North America” and “choppy global economic growth.” This quarter they saw positive demand trends that were “broad-based across most businesses and geographies.”

· Housing turnover is low, but rising demand and low inventory have led to higher home prices which helps demand.

Pro forma sales (adj. for Valspar acquisition) were up 7.5%. Despite higher than expected raw material costs (mainly propylene), guidance for the year was raised though largely driven by a lower tax rate, but does assume some sequential gross margin improvement. Excluding all the moving parts with Valspar, YoY 2018 EPS of the core business at the mid-point is expected to be up 27% vs previous guidance of up 24%. Gross margins are improving as price increases are catching up with input cost increases. Raw material costs inflation was slightly higher than the 5-6% they were expecting and will remain higher than they previously anticipated. As seems to be a recurring theme across sectors in earnings so far, they are seeing strong demand but higher input costs. The Americas Group segment (60% of rev and includes no Valspar) sales were +7.7% driven by +6.8% SSS (4.3% volume; 2.5% price/mix) – this is an acceleration from +5.2% last quarter. Trends improved as the quarter progressed and the weather improved. They are seeing stronger demand in their chain of paint stores from contractors than DIY customers. Consumer Brands Group (15% of rev) sales were +1.5% (new rev recognition accounting, ASC 606, reduced this by 5pts) and Performance Coatings Group (25% of rev) sales were +11%. Q3 will be the first quarter that they fully lap Valspar, so pro-forma estimates will stop obscuring comparability starting next quarter. In general, the integration seems to be on or ahead of schedule, at least in the sense of recognizing synergies.

Continue reading “Sherwin Williams 2Q18 Earnings”

Alphabet 2Q18 Earnings

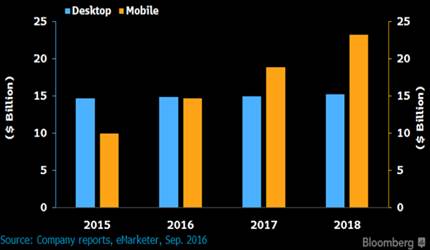
Alphabet reported very strong Q218 results, beating on sales and earnings. Google segment revenues were up 25% and other revenue, which includes cloud, was up 37%. Mobile search and YouTube continue to drive ad revenue. Importantly, traffic acquisition costs (TAC) were down as a percentage of revenue (23% of revenue vs 24% last quarter). This was a key positive in the quarter as TAC accounts for most of cost of sales. Management previously suggested this reversal was coming. Two dynamics have been driving higher TAC: the mix shift to mobile and to programmatic. Although these evolving ad formats monetize differently and are lower margin than desktop search they continue to represent meaningful growth opportunities. They report their ad revenues in two buckets: “Google Properties” (rev from search, Gmail, YouTube etc) and “Google Network Members” (rev from 3rd party sites that use AdSense, AdMob or DoubleClick to sell ads on their sites). Google Properties has lower TAC and is growing faster (>80% of ad revenue). Starting last quarter, they changed their monetization metrics. For Network Member properties they switched from reporting clicks (how many times people clicked on an ad) to impressions (how often ads are viewed). The change represents the growing importance of (higher TAC) programmatic on Network properties (which is largely monetized by impression). They also had solid performance in their non-ad businesses. Hardware is seeing strong growth and their cloud business continues to see momentum as they work to catch up with Amazon and Microsoft. Today (at their “Google Cloud Next” event) they announced an important new hybrid cloud solution that targets Microsoft Azure’s dominance in this space. This underscores the growing importance of hybrid solutions as cloud penetration increases. The CEO spent a lot of time on the call talking about applications of AI across their business and their opportunity in cloud. He echoed a similar sentiment that Satya Nadella (MSFT CEO) did last week – that despite AWS’s early lead, cloud should not be viewed as winner-take-all on a customer level because… “businesses are going to embrace multiple clouds over time.” He also indicated that he thinks cloud adoption is still in early stages and that “there’s a lot of opportunity.”

With the exception of lower TAC, this quarter follows a similar trend of rising expenses and investment impacting margins as they “invest ahead of growth.” Higher operating expenses are largely related to head count increases in R&D (tech talent) and sales & marketing. Capex continues to remain elevated, increasing from $2.8B in 2Q17 to $5.5B this quarter. This is a similar pace of growth as last quarter (ex the Chelsea Market purchase). They continue to invest in things like equipment and data centers. The investments in technical infrastructure reflect expanding applications of machine learning across the company.

[MORE]

Valuation:

· FCF for the quarter was $4.7B and is expected to be $26B for the year.

· Trading at a ~3% FCF yield. Although the stock looks more expensive, it is on depressed FCF margins which should improve as capital intensity normalizes. No change in thesis.

· $98B in net cash, $140/share or 11% of their market cap.

Thesis on Alphabet:

· Online advertising as a share of overall Ad budgets will continue to grow as:

o People spend more time on the internet/mobile internet vs tv, radio, newspapers etc

o Higher ROI (+ easier to measure) per marketing dollar spent online vs other ad mediums

· They are the global leader in search.

· Well positioned to benefit from increased smartphone penetration.

· Flexible business model provides operating leverage with high returns ROIC and huge free cash flow generation.

$GOOGL.US

[tag GOOGL]

Sarah Kanwal

Equity Analyst, Director

Direct: 617.226.0022

Fax: 617.523.8118

Crestwood Advisors

One Liberty Square, Suite 500

Boston, MA 02109

www.crestwoodadvisors.com

PLEASE NOTE!

We moved! Please note our new location above!

Microsoft 4Q18 Earnings Report

Current Price: $106 Price Target: $120 (new target price; increased from $105)

Position size: 5% TTM Performance: 42%

Microsoft reported solid Q4 results beating on the top and bottom line and delivering above consensus guidance. Revenue growth accelerated slightly from 16% last quarter to +17%, with double digit revenue growth across all segments. Revenue was $30B for the quarter and for the year crossed $100B for the first time. Top line results were aided by the weaker dollar which added 2pts. Windows and the PC cycle still matter, but Cloud is the key driver of growth. They saw strong demand in both, driven by a robust IT spending environment. Though Microsoft has trailed AWS, Cloud adoption is moving into a phase where Microsoft should have an advantage. The results this quarter substantiate that. The key is hybrid cloud and multi-cloud. Early cloud adopters tended to be smaller companies and digital native companies – companies that didn’t have enormous legacy data centers with tons of money invested in equipment or with critical data that they wanted to keep in-house. As larger companies with legacy IT infrastructure increasingly shift to the cloud, they will take a hybrid approach, which just means they still keep some stuff on-premise. It is a bridge between the old and new. Microsoft has an advantage with Azure stack because it is a highly differentiated product and the leading technology for hybrid. They are also well positioned because they have entrenched enterprise relationships. The trend to multi-cloud refers to companies wanting to use multiple vendors so there is no vendor lock-in or loss of bargaining power. So, adopting AWS doesn’t mean you wouldn’t also use Azure. Microsoft is and will continue to be a beneficiary of this trend.

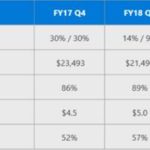
Commercial Cloud (Office 365 commercial, Azure, Dynamics 365) revenues were $6.9B, up 53% and accounting for 23% of revenue in the quarter (up slightly from 22% last quarter). For the full year, Commercial Cloud was $23.2 a little ahead of expectations and full year cloud run rate is now close to $28B. Importantly, cloud margins continue to improve (+600bps YoY) which will help drive better FCF margins as the business scales. Within Commercial Cloud, Azure grew 89%. The “More Personal Computing” segment which includes Windows, Xbox, Surface, and all other hardware continues to improve. That segment accelerated to 17% growth on solid results from Windows Commercial (+23%), Surface (+25%) and gaming (+39%). This segment performance is consistent with their previous comments of an improving commercial PC market and a “stabilizing” consumer PC market. Free cash flow in the quarter was over $7.4B down 15% YoY reflecting higher capex in support of their cloud business. Capex was $4B in the quarter vs $2.3B in 4Q17. They returned $5.3 billion to shareholders with $3.2B in dividends and $2.1B in share repurchases.

Valuation:

· They produced $32B in FCF for the year putting them at close to a 4% FCF yield – reasonable for a company with double digit top line growth, high ROIC and a high and improving FCF margins.

· They easily cover their 1.6% dividend, which they have been consistently growing.

· Strong balance sheet with about $134B in gross cash, and about $57.5B in net cash.

· Increasing price target to $120 based on ~30% FCF margins and mid-to-high single digit top line growth.

Investment Thesis:

· Industry Leader: Global monopoly in software that has a fast growing and underappreciated cloud business.

· Product cycle tailwinds: Windows 10 and transition to Cloud (subscription revenues).

· Huge improvements in operational efficiency in recent quarters providing a significant boost to margins which should continue to amplify bottom line growth.

· Return of Capital: High FCF generation and returning significant capital to shareholders via dividends and share repurchases.

$MSFT.US

[tag MSFT]

Sarah Kanwal

Equity Analyst, Director

Direct: 617.226.0022

Fax: 617.523.8118

Crestwood Advisors

One Liberty Square, Suite 500

Boston, MA 02109

www.crestwoodadvisors.com

PLEASE NOTE!

We moved! Please note our new location above!

TJX 1Q19 Earnings Update

TJX beat on revenue and EPS with better than expected SSS. Performance was solid across divisions and concerns around inventory availability were dispelled. SSS were +3% vs guidance of +1-2% with strong performance across their apparel and home categories. Traffic was the primary driver across all 4 divisions. Marmaxx division (60% of revenue) SSS were +4% driven mostly by traffic and slightly by ticket. International SSS were +1% despite a “challenging retail environment” in Europe (where they have over 500 stores). Full year guidance is 1-2% SSS (in their 40+ yr. history they’ve had only 1 year of negative SSS). They also mentioned they “have been disproportionately attracting new millennial and Gen Z customers.” Merchandise margins compressed a little, but gross margins were flat. They are seeing some headwinds from wages and “significantly higher” freight costs, offset by positive Fx and a lower tax rate. The midpoint of full year guidance was raised despite these headwinds and with a lower expected tax benefit. Full year EPS should be about $4.07 plus a $0.72 benefit from a lower tax rate.

Continue reading “TJX 1Q19 Earnings Update”

Cisco 3Q18 Earnings Update

Thesis intact, key takeaways:

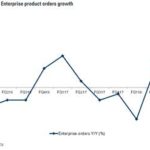
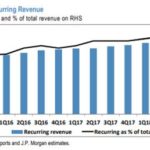
Cisco reported Q3 earnings and beat on the top and bottom line and guided in line with street. While the quarter was strong, the growth of Services revenue (26% of revs) seemed to be a little lower than expected and gross margins were lower. They had 70 bps of gross margin compression driven almost entirely by higher memory costs. This is similar to previous quarters and is an industry wide phenomenon. They continue to make good progress on their transformation from a hardware business to a software and services focused business. The percentage of recurring revenue is now at 32% – they set a goal of 37% by 2020. Enterprise saw accelerated growth at +11% YoY driven by strong growth with Catalyst 9k units –the 9k switches are only sold with a subscription and are a key part their strategy of shifting their core business to recurring revenue. They saw strength in both campus and data center switching. Additionally, Applications and Security were both strong – up +19% and 11% respectively. As expected, Service Provider revenue trends continue to be weak, pressuring router sales – though exposure to this end market is decreasing. They repurchased $6.2bn worth of shares in Q3 and still have $25B remaining in their buyback authorization which they aim to complete in 1.5-2yrs.

Valuation:

· They have 3% dividend yield which is easily covered by their FCF.

· FCF yield of over 6.5% is well above sector average and is supported by an increasingly stable recurring revenue business model and rising FCF margins.

· The company trades on hardware multiple, but the multiple should expand as they keep evolving to a software, recurring revenue model. Hardware trades on a lower multiple because it is lower margin, more cyclical and more capital intensive.

Thesis on Cisco

· Industry leader in strong secular growth markets: video usage, virtualization and internet traffic.

· Significant net cash position and strong cash generation provide substantial resources for CSCO to develop and/or acquire new technology in high-growth markets and also return capital to shareholders.

· Cisco has taken significant steps to restructure the business which has helped reaccelerate growth and stabilize margins.

$CSCO.US

[tag CSCO]

Sarah Kanwal

Equity Analyst, Director

Direct: 617.226.0022

Fax: 617.523.8118

Crestwood Advisors

One Liberty Square, Suite 500

Boston, MA 02109

www.crestwoodadvisors.com

PLEASE NOTE!

We moved! Please note our new location above!