Quick Update On Earnings So Far…

So far ~80% of the companies in the S&P 500 have reported earnings.

78% have beat on EPS. The 5-year average is 70%.

77% have beat on sales which is a record.

55% of companies have issued negative guidance which is well below the 5 yr average.

For EPS beats: consumer discretionary, tech and Energy have had the highest % surprise.

For revenue beats: REITs, Industrials and utilities have had the highest % surprise.

According to FactSet, the market is rewarding upside earnings surprises less than average and punishing downside earnings surprises more than average.

For all of 2018, analysts are projecting earnings growth of 19.5% and revenue growth of 7.2%.

Forward P/E Ratio is 16x – it was 16.4x at the beginning of the year. The 5-year average is 16.1x and the 10-Year average is 14.3x.

Continue reading “Quick Update On Earnings So Far…”

Booking Holdings 1Q Earnings Update

Current Price: $2,045 Price Target: $2,400

Position Size: 3% TTM Performance: 20%

Bookings reported a better top and bottom line but guidance disappointed. Total bookings for the quarter increased 21% to $25B (+12% constant currency). The source of the disappointing 2Q guidance is expectations of decelerating room night growth (+7-11% vs +13% in 1Q) caused by a reduction in performance advertising spend. Performance ad spending is primarily with Google and to a lesser extent with sites like TripAdvisor and Trivago. They are making a deliberate trade-off in reducing costlier (and fading ROI) performance ad spend, despite the impact to room night growth. The benefit is hitting margins and was the cause of the big EPS beat. This strategy is not new – rising advertising costs have been a theme across the industry and their response is consistent with what they have said the last couple quarters and is not a surprise. They are shifting ad dollars to brand advertising (like TV) in an attempt to get more direct traffic to their site as the ROI on performance advertising has gone down and as a result direct traffic is increasing as a % of the mix. After last quarter, many speculated that this may disrupt room night growth – which it has. The long-term thesis, however, is intact and they still have plenty of runway for growth.

Continue reading “Booking Holdings 1Q Earnings Update”

Aramark 2Q18 Earnings Update

Aramark reported 2Q18 earnings, beating on the top and bottom line and raising the midpoint of EPS guidance. Revenue was up 6% constant currency with about 2% organic growth. The quarter included partial results from AmeriPride and a full quarter of Avendra. The key positive was the improvement in adjusted operating margins in conjunction with top line growth as the two together have been elusive. Importantly, the margin expansion was led by their core US food service business in contrast to their competitor Sodexo’s profit warning on inflation and increased competition. Sentiment was bad heading into the quarter as Aramark has had trouble hitting their organic growth and margin targets. In 2017, they disappointed with organic growth, but saw margin expansion. Then last quarter they saw meaningfully improved top line growth at the expense of 50bps in margin contraction. This was largely blamed on the onboarding of new contract wins. Management says they are on track to hit the FY18 7.2% margin target that they set in 2015, though with much of it back half weighted (implies a 7.9% adj. op. margin in 2H18 vs 6.5% in 1H18). Legacy growth was slightly below long-term target for 1Q, but they said they expect the legacy business to hit their “at least 3%” target for the full year. For 1H18 they are at 3.4%. Without adjustments, their operating profit would have been down almost 30%. Some of their adjustments and the capitalization of certain client related costs are a source of skepticism around the validity of their margins. This margin concern has been reinforced by profit issues at Sodexo and talk of rising delivery costs from their primary distributor, Sysco. Specifically, client contract incentives represent cash payments for renovations of client facilities – this hits the capex line and is in “other assets” on the balance sheet (net of accumulated amortization it’s close to $1B). Adj. operating income adds back that depreciation and, in doing so, added 80bps to the 2Q adj. operating margin. Longer term, their acquisitions will help with margins through increased purchasing scale with Avendra and better capacity utilization and route density with AmeriPride.

Continue reading “Aramark 2Q18 Earnings Update”

Black Knight 1Q18 Earnings

They beat on top and bottom line and reiterated full year guidance. Revenues were up 5%, slightly ahead of expectations. The street is at the high end of their guidance for the year. They continue to face some headwinds, but their pipeline of new business is solid which provides some reassurance on top line growth going forward. Drivers for the business primarily include new client wins, mortgage originations and total active loans. Their pipeline is strong with several new customer wins reported (e.g. added JPM to their originations solutions pipeline), but the pace of implementation has been a source of disappointment as the process for migrating new customers onto their platform, often from in-house or highly customized solutions, can be complex and slow. This was the cause of their guide down last quarter. Additionally, similar to last quarter, rising rates are negatively impacting mortgage originations, with industry volumes down 14%. That drop is driven by lower refinancing activity which now makes up 37% of originations – that’s the lowest proportion of total originations since 1995. In 2012 that proportion was 72%. This will continue as rising rates mean fewer people will be in a position to benefit from refinancing. This is a headwind in their Software Solutions segment (~85% of revenue), though originations make up only 10% of revenue and servicing is 75% and much steadier. Refi’s are a sub-segment of that 10% and, given pent-up demand in housing, purchases are going to start to outpace this. Overall, Software Solutions segment revenues were up 5% as servicing grew 7% and originations declined 4%. On the servicing side, they continue to dominate first lien loans with 62% share and are growing share in second lien loans. At the end of 2017 they had 13% share of second lien, they now stand at 17% share and expect to reach 30% once current commitments are implemented. Mortgage servicing costs continue to rise and should aid growth in this business as potential cost savings are an impetus for banks to adopt BKI’s software. Data analytics segment (~15% of revenue) revenues were up 3%. Growth going forward in this segment should be ~3-5%. M&A continues to be a focus, especially with the new CEO.

Continue reading “Black Knight 1Q18 Earnings”

Microsoft 3Q18 Earnings Report

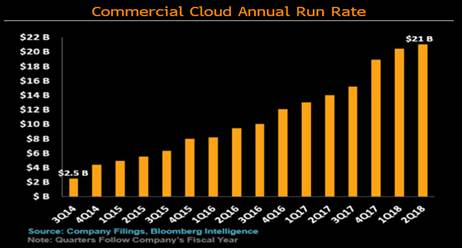
Microsoft reported solid 3Q results beating on the top and bottom line and delivering strong guidance. Overall revenue grew 16% aided by the weaker dollar which added 3pts to the top line. They saw strong growth across all 3 segments with cloud continuing to be the key the driver of growth. Commercial Cloud (Office 365 commercial, Azure, Dynamics 365) revenues were $6B, up 58% (an acceleration from last quarter) and accounting for over 22% of revenue in the quarter. Despite the higher mix of lower gross margin cloud, their operating margin improved 200bps as the top line beat resulted in better leverage of opex and better than expected EPS. While cloud margins are a drag now, they will help drive better FCF margins as the business scales. Within Commercial Cloud, Azure grew 93% – estimates are for this business to be about $8B in revenue this year and for commercial cloud to be $22-23B or about 20% of total revenue. They are the number two cloud player behind AWS. The “More Personal Computing” segment which includes Windows, Xbox, Surface, and all other hardware showed meaningful improvement. That segment, which has been in decline, grew 13% to nearly $10 billion on solid results from the Surface and gaming. This segment performance is in line with their comments last quarter of a stronger than anticipated commercial PC market and that the consumer PC market was “stabilizing.” Overall they are seeing positive demand across their business and are positioned to benefit from a strong IT spending environment with digital transformation, migration to the cloud (especially hybrid where they have an edge) and companies positioning their infrastructure for IoT. Free cash flow in the quarter was over $9B and they returned $6.3 billion to shareholders pretty evenly split between dividends and share repurchases.
Valuation:

· The stock is reasonably priced trading at close to a 5% FCF yield for a company with double digit top line growth, high ROIC and a high and improving FCF margin (~30%).

· They easily cover their 1.75% dividend, which they have been consistently growing.

· Strong balance sheet with about $132B in gross cash, and about $55B in net cash.

Investment Thesis:

· Industry Leader: Global monopoly in software that has a fast growing and underappreciated cloud business.

· Product cycle tailwinds: Windows 10 and transition to Cloud (subscription revenues).

· Huge improvements in operational efficiency in recent quarters providing a significant boost to margins which should continue to amplify bottom line growth.

· Return of Capital: High FCF generation and returning significant capital to shareholders via dividends and share repurchases.

$MSFT.US

[tag MSFT]

Sarah Kanwal

Equity Analyst, Director

Direct: 617.226.0022

Fax: 617.523.8118

Crestwood Advisors

One Liberty Square, Suite 500

Boston, MA 02109

www.crestwoodadvisors.com

PLEASE NOTE!

We moved! Please note our new location above!

Visa 2Q18 Earnings Results

Visa reported very strong 2Q18 results and raised guidance. Adjusted EPS was $1.11 (high end of street estimate was $1.06). Broad based global economic growth spurred an acceleration in payment volume growth, fueled by debit spending globally. International was particularly strong with an acceleration in cross-border volume (outbound from Europe, inbound to the US) driven by the weaker dollar. Payment volumes were up 10% and processed transactions were up +12%. EPS guidance raised from mid-20% growth to high 20’s growth. The integration of Visa Europe continues on pace with expectations. Revenue growth is now expected to be low-double-digits, up from the previous guidance of high-single-digits. Cards outstanding grew 4% (to 3.3B), with 2% growth in credit cards and 5% growth in debit cards. Debit cards continue to outpace, partly driven by Millennials who favor debit over credit. As expected, the trend of rising incentives continues as competition is intense for share of customers’ wallets and for business with issuers. Visa is continuing to develop new avenues for growth as the payments industry changes. Contactless payment penetration continues to rise globally. They are positioning themselves to grow in the evolving P2P and B2B markets. For example, in March they acquired Fraedom to help expand their B2B business. This expands their addressable market from the $45 trillion retail payment market to the $120 trillion B2B market and the $60 trillion P2P market. Visa is also in the early stages of standardizing their digital checkout. They recently announced an agreement with Amex and MasterCard to offer a common user interface for digital payments. The platform will create a single button checkout across sites and devices, eliminating the friction of online checkout across various sites.

Continue reading “Visa 2Q18 Earnings Results”

TJX Q4 Earnings Update

TJX reported a great Q4 amid a difficult retail environment. Sales were up 8% on 4% SSS and 4% square footage growth. Notably, traffic was the primary driver of SSS at all of their concepts. Comp store sales exclude e-commerce, which is still small but “grew significantly.” Total global store count now stands at 4,070. They clearly have the model in brick and mortar that is working. They opened 250 stores in 2017 as other retailers continue to shrink their store count. They plan to grow stores 6% this year with most of the growth coming from their home concepts. They increased their dividend by 25% to $1.56, putting them close to a 2% yield.

  • Marmaxx, their largest division, had 3% SSS on positive traffic and negative ticket.
  • Overall merchandise margins are strong though there was some contraction at HomeGoods.
  • Same store inventories were up in-line with sales.
  • Wage increases negatively impacted EPS growth by about 1%.
  • 2018 FCF was $2B and they returned $2.4B to shareholders.
  • They plan to repatriate $1B in cash in 2019

Current Price: $84 Position Size: 2%

Price Target: $84 TTM: 5.4%

Guidance:


  • 2019 sales of $37.7B, +5%. Assumes SSS of 1-2% and 6% store growth.
  • 2019 EPS: $4.04, +5%, assumes an increase in merchandise margins.
  • Wage increases will negatively impact EPS by 2% and will continue to have a negative impact beyond 2019.
  • Fx should be about a 1% benefit.
  • For SSS by division they expect:
    • Marmaxx +1-2%
    • HomeGoods +2-3%
    • Canada +2-3%
    • International 1-2%

Inventory Availability:


  • There have been investor concerns that inventory is getting more rationalized at retailers resulting in fewer closeouts and less available inventory in the off-price channel.
  • Management addressed this on the call saying that, “availability has never been an issue for TJX in over our 41-year history. Throughout 2017 overall availability of inventory from top vendors was as good as it has ever been.”
  • They are one of the most efficient and discrete channels for vendors to clear inventory, whereas clearing inventory online is not as discrete and can be brand damaging.
  • Their sourcing scale is part of their competitive advantage and they source from 20k vendors in 100 countries.
  • Additionally, on the call management pointed to online vendors as a new source of inventory.

Future growth will rely increasingly on the Home category and International:


  • Given this, management is looking towards the home category as their next leg of growth. They are accelerating store openings and are bring the Canadian HomeSense concept to the US.
  • One the call they introduced a long-term store target for HomeSense in the U.S. of 400 stores, from the 4 stores today.
  • They also expect to add 483 HomeSense stores in Canada, bringing the total there to 600.
  • In Europe, they are the only major off-price retailer.

Valuation:


  • Their balance sheet is strong with no net debt.
  • Store openings will bolster top line growth.
  • They have been steadily FCF positive with LT FCF margins averaging about 6-7% and high ROIC.
  • Assuming a normalized FCF margin, they trading at about a 5% forward yield.

Cisco Q218 Earnings Update

Cisco reported a strong quarter beating on top and bottom line. Revenue is finally growing again. As they shift from a hardware focused company to a software focused company, one side of the business has been cannibalizing the other dragging down growth. But the higher growth, higher margin, recurring revenue software business, now 33% of revenue, bodes well for future profitability. They increased the dividend by 14% (>3% yield) and increased the buyback authorization from $6B to $31B. They expect to utilize this over the next 18-24 months, which means buying back 15% of their market cap. They had a one-time $11B tax hit in the quarter as they plan to repatriate $67B cash.

Key positives from the quarter:


  • Revenue was up 3% to $11.9B, EPS was up 10% and FCF was also up 10%.
    • Americas +6%, EMEA +6%, Asia 0%, Emerging Markets +1%
  • Guidance better than expected – revenue +3-5%; EPS $0.65
  • Commercial order growth jumped to 14% from 12% in FQ1 and 4% in FQ4’17. Driven by rapid Catalyst 9k adoption.
  • Gross margins improved 60bps because of the mix shift toward services revenue.
  • Tax rate guidance of 20%
  • Service provider continues to be weak with orders down 5%
  • Strong innovation pipeline

Cisco’s margins are expanding as their revenue model evolves:


  • The hardware business isn’t growing, software is growing 12-15% and services are growing mid-single digits.
  • Services and software carry higher margins than hardware and are less capital intensive.
  • By 2020 they expect at least 50% of revenue from software.
  • About 33% is recurring revenue currently.

Intent-based networking will be a growth driver:


  • One of the biggest IT shifts since the invention of the router – transforms how networks function.
  • “Intent-based networking systems monitor, identify, and react in real time to changing network conditions.” Helping firms grapple with the growing digitization of their business.
  • Only Cisco delivers an end-to-end, intent-based networking strategy.
  • Major product is “Catalyst 9K”
      • Fastest ramping product in the history of the company.
      • Was the driver of the 14% commercial order growth.
      • Will enhance gross margins.

Valuation:


  • FCF steadily outpaces net income, so the company is cheaper than it looks on a P/E multiple.
  • They have over a 3% dividend yield which is easily covered by their FCF.
  • FCF yield of over 6% is well above sector average and is supported by an increasingly stable recurring revenue business model.
  • The company trades closer to a hardware multiple, but the multiple should expand as they keep evolving to a software, recurring revenue model. Hardware trades on a lower multiple because it is lower margin, more cyclical and more capital intensive.


Cognizant 4Q17 Earnings Update

Cognizant reported very strong results for 4Q17, beating on top and bottom line, issuing solid guidance and significantly increasing their dividend. The dividend, which was just initiated in 2Q17, was increased by 33% (increase driven by tax reform). Revenues were up 10.6% and EPS was up 18.4%, excluding a one-time repatriation tax expense of $617m. Full year FCF was $2.1B, up almost 57% YoY. They returned all of their FCF to shareholders through share repurchases ($1.9B) and dividends ($265m).

Current Price: $76                              Price Target: $76

Position Size: 2.3%                              TTM Performance: +43%

Cognizant is well positioned for the accelerating shift to digital:


  • In recent years, the news has been dominated by the rise of digital natives like Facebook, Amazon, Netflix and Google
  • Going forward, they say previously dominant companies rise as the “new generation of digital heavyweights.”
  • While a digital transformation is remaking and disrupting business models, Cognizant is helping legacy players adapt.
  • Digital related revs grew 30% in 2017, accounted for 27% of revenue and is higher margin.

Thesis intact, highlights from the quarter:


  • 4Q17 Revenue of $3.83B up 10.6%.
  • Consulting & Technology Services revenue up 10.2%.
  • Outsourcing Services revenue up 11%.
  • About 40% of their revenue from fixed price contracts – continuing to shift mix of business towards this.
  • Employee metrics reflect improving resource alignment
    • Annualized attrition was 17.9%; (460) bps lower than 3Q17
    • Utilization: Offshore (excluding trainees) increased to 83%; On-site was 92%
  • They acquired Netcentric and Zone in 4Q17 to expand their digital marketing capabilities.

Results across all segments were solid with the best results in the Communications, Media & Technology segment of +18%:


    • Financial Services saw strength with insurance and mid-tie banking clients which offset continued weakness with larger banking clients (notably, they are starting to see recovery).


    • Healthcare saw strong demand from payer clients (e.g. insurers). Shift from fee-for-service to value based care is driving demand as it requires data-driven insights and increased digital collaboration.


    • Products & Resources saw growth in manufacturing and logistics clients, offsetting weakness in retail


  • Communications, Media & Technology had sold growth across all sectors.

For the full year, they saw solid results across all regions except the UK which was down 2%.

First Quarter & Full Year 2018 Outlook

The Company is providing the following guidance:


  • Q1 2018 revenue $3.88B to $3.92B, street was at $3.88B.
  • Q1 2018 EPS at least $1.04, street was at $1.01.
  • Full year 2018 revenue $16B to $16.3B, bracketing street estimate of $16.2B.
  • Full year 2018 EPS at least $4.53, street was at $4.35.
  • Tax rate 24%
  • $0.80 dividend, raised 33%, trading at a 1% yield.
  • Expecting continued share repurchases.

Investment Thesis:


  • With a FCF yield of 5%, 1% dividend yield, secular growth tailwinds, strong balance sheet and ROIC running in the mid-20’s, the stock is still cheap.
  • They are well positioned to benefit from the “SMACK” megatrend (Social, Mobile, Analytics, Cloud, and Key disruptors) which is driving corporations to rethink the way they do business.
  • Digital readiness and cloud computing are reshaping client demand for IT services. Cognizant is well positioned to benefit from this shift and trades at an attractive valuation.


Aramark 1Q18 Earnings Update

Aramark reported their 1Q18 results beating on top and bottom line and raising guidance. Increased outlook was based primarily on taxes, currency and acquisitions. No change to outlook of legacy business. They saw broad based growth across all lines of business and all geographies. Seeing a strong pipeline of new business opportunities. They did have some margin compression, driving operating income down 3%, which was more than offset by the lower tax rate, driving the EPS beat. Costs associated with the onboarding of new customers, weaker uniform margins and technology investments (kiosk and mobile ordering) contributed to the operating profit decline. They expect margins to improve in the back half of the year as onboarding costs abate and as labor productivity initiatives are implemented. They booked a $184m gain on re-measurement of deferred tax liability on the lower tax rate.

Thesis intact, key takeaways:

Strong organic growth was a key positive in the quarter:


  • Organic revenue growth was a nice improvement from their Q4 results where they missed organic growth targets.
  • Revenues were up 6% on 5% organic growth and 1% currency.
  • Organic growth driven by volumes, price increases (to offset labor and food inflation), and improving retention rates.
  • International had particular strength in Europe and emerging markets.

Inflation and margin compression are concerns:


  • They are expecting 3% inflation in their business, but feel they are well positioned to recover rising costs.
  • Though wage inflation is fairly broad based they did say it varies across regions in the US.
  • They have labor productivity initiates (centralized hiring and demand driven scheduling) aimed at offsetting wage increases.
  • They also have some shielding to inflation because of about 1/3 of contracts have a pass-through mechanism (cost plus, escalators) and another 1/3 with renegotiation rights.
  • There is some concern around potential competitive pricing actions given a tax windfall, as low margin businesses, where competition is high, are more likely to have tax benefits competed away though pricing.
  • This dynamic could be offset by their historically higher tax rate than peers – management said it may be more of a level playing field for them going forward.

Recent acquisition integration:

Avendra and AmeriPride both closed within the last couple months.

  • Expect the acquisitions to be earnings dilutive in 2018, but FCF accretive.
  • Interest expense increased to $350m.
  • Leverage ratio is up, but they extended their debt maturities and now have so significant maturities for 7 years. Will use FCF and tax benefit to de-lever.

Outlook raised:


  • Increased outlook based primarily on taxes and currency. No change to outlook of legacy business.
  • They expect 3% organic revenue growth and a 1-2% currency benefit.
  • 2018 EPS guidance of $2.15-$2.30. This was raised from the EPS guidance they gave last quarter of $2.10 to $2.20.
  • Capex at 3.5% of sales – this is line with historical level.
  • FCF outlook of at least $400m maintained despite raise in EPS outlook- not yet updated to reflect the benefits of tax reform and the acquisitions, so this number is likely to go up. Street numbers were closer to $500m.
  • Expected tax rate of 26% is a 700bps improvement.
  • Will use tax savings to decrease leverage ratio which climbed up with acquisitions. Aiming to get below 4.5x by year end.

The Thesis on Aramark:


  • ARMK is an industry leader in the food, facilities, and uniform outsourcing market. The market is large and growing supported by favorable outsourcing trends.
  • Aramark has an opportunity to continue expanding margins driven by productivity initiatives and operating leverage.
  • The stock currently trades at a trough multiple vs. the market and at a discount to peers which I expect to mean revert thanks to low double digit EPS growth for the next few years driven by margin improvement, deleveraging, and improving top line.
  • ARMK is well positioned to weather economic cycles due to a diversified customer base and greater than half of their revenues coming from non-cyclical industries.
  • As deleveraging continues shareholder returns should increase via dividend growth and buybacks.