GOOG Q4 Earnings

Current Price: $2,977    Price Target: $3,450

Position Size: 4.8%         TTM Performance:+64%


Key Takeaways:

  • Better than expected revenues (+33%) and operating income (+40%). Search and Google Cloud Platform (“GCP”) were key bright spots while YouTube ad growth was a little weaker than expected.
  • Digital ad spending continues to surge – saw broad-based strength in advertiser spend, particularly w/ retailers
  • Cloud strength continues – was +45%, margins improving
  • Ramping spending on Capex  and headcount – continuing to pick up the pace of investment in office facilities and data centers. Saw a 6,500 increase in headcount. The biggest they’ve seen in any quarter ever. “The majority were again in technical roles”…”we do continue to be a magnet for great talent.”
  • Declared a 20-for-1 stock split to go into effect on 7/15. “The reason for the split is it makes our shares more accessible.”


Quote…

  • “we are definitely looking at blockchain and such an interesting and powerful technology with broad applications, so much broader again than any one application. So, as a company, we are looking at how we might contribute to the ecosystem and add value. Just one example, our cloud team is looking at how they can support our customers’ needs in building, transacting, storing value, and deploying new products on blockchain based platform.”

Big focus on Retail/e-commerce continues again this call…

  • “I’ve said it before, I’ll say it again, the future of retail is omnichannel..”
  • “On 80% of searches, actually we show no top ads and most of the ads that you see are on searches with commercial intent”
  • Goldman: they are “uniquely positioned to capitalize on the blurring of the lines between advertising, commerce and media consumption business models in the years ahead.”
  • Omnichannel and next-gen user experiences are core to their shopping strategy, including:
    • Easier ways for businesses to show the local services they offer across Search and Maps.
    • Free shipping and easy return annotations across Search and Shopping.
    • AR capabilities that bring in-store moments online and let users try before they buy.
    • Instantly shoppable images with Google Lens.
    • New visual, browsable experience on Search.
    • Early innings w/ e-commerce potential w/ YouTube (see below)
    • Local inventory ads that highlights which products are in-stock and when to pick them up.
      • Global searches for “gift shops near me” jumped 60% year-over-year in October, with searches for “gifts near me” up 70% in Google Maps. People increasingly want to know what’s available nearby before they get to the store. Their new in-stock filter helps with that – shoppers can find local stores that carry the products they want, right from Search.

Heavy focus on AI capabilities again on the call which is relevant across segments – AI enhances search and their ad offerings and GCP customers can tap into their AI expertise as a service.

“Search & Other” revenue: $43B, up 25%

  • Retail was again by far the largest contributor to the YoY growth of their Ads business.
  • Media & entertainment, Finance and Travel were also strong contributors.

YouTube ad sales: $8.6B, up +43% YoY

  • Strong value proposition to advertisers & positioned to capture the shift in advertising away from linear TV
    • “YouTube’s reach is becoming increasingly incremental to TV”
    • YouTube helps advertisers reach audiences they can’t reach anywhere else (especially younger audiences) and helping brands do it more efficiently
    • Nielsen found that US advertisers who shifted just 20% of spend from TV to YouTube generated a 25% increase to the total campaign reach within their target audience while lowering the cost per reach point by almost 20%.
  • E-commerce potential: ” There’s a lot more to come…including tapping into commerce on YouTube“. They are still in the early innings w/ e-commerce potential w/ YouTube. Possibilities include: shoppable livestream events w/ large retailers or letting viewers buy directly from their favorite creators’ videos.

Network ad revenues: $9.3B, up 26%. This is revenue from ads placed on sites other than their own, like an ad placed on the NYT site.

Other revenues: $8.2 billion, up 22%

  • Driven primarily by growth in hardware, which benefited from the successful launch of the Pixel 6 and Pixel 6 Pro
  • Also includes Fitbit revenues and YouTube non-advertising revenues

Google cloud = Google Cloud Platform (“GCP”) + Google Workspace (i.e. collaboration tools):

  • Revenue grew 45% YoY to $5.5B; backlog increased more than 70% to $51 billion
  • GCP’s revenue growth was again above Cloud overall, reflecting significant growth in both infrastructure and platform services.

Other Bets

  • For the full year, revenues were $753 million and the operating loss was $5.3B versus an operating loss of $4.5B in 2020.
  • October marked the one year anniversary of “Waymo One” fully autonomous commercial ride-hailing service in Arizona
  • Waymo Via continues delivering freight into the Southwest U.S.

ESG:

  • They aim to operate on 24-7 carbon free energy by 2030
  • New Carbon Footprint tool gives customers carbon emissions insights associated with their Google Cloud Platform usage


Valuation – They generated $67B in FCF in the last 12 mos. and ended the quarter with $111B in net cash, >5% of their market cap. The stock is still reasonably valued, trading at a >4% FCF yield on 2022 and theyve been stepping up their pace of buybacks. They repurchased $50B in shares in 2021.


Sarah Kanwal

Equity Analyst, Director


Direct: 617.226.0022

Fax: 617.523.8118


Crestwood Advisors

One Liberty Square, Suite 500

Boston, MA 02109

www.crestwoodadvisors.com


CCI Q4 Results

Current price: $180         Target price: $201

Position size: 2.1%           TTM Performance: 12%


Key takeaways:

·         Reported results that beat expectations, issued strong guidance and gave very positive commentary around long-term outlook as customers began upgrading their existing cell sites as part of the first phase of the 5G build out in the U.S.

  • Saw strong AFFO/share growth of 14% and guided to FY22 AFFO/share growth of 6%, which is in-line with their long-term target.
  • Inflection point in new small cells and overall business – The highest level of tower application volume in history and strong demand for small cells during FY21 is a strong tailwind in driving long-term revenue growth.
  • Dividend raised 11%. Well ahead of long-term dividend growth target 7% to 8% target as they are growing the dividend in line with AFFO/share growth.


 Additional highlights:

  • Quotes from the call:


  • “We expect elevated levels of tower leasing to continue this year and believe we will once again lead the industry with the highest U.S. tower revenue growth in 2022.”
  • I believe our strategy capabilities and unmatched portfolio of more than 40,000 towers and more than 80,000 route miles of fiber concentrated in the top US markets put Crown Castle in the best position to capitalize on the current environment and to grow our cash flows and our dividends per share both in the near term and for years to come.”
  • Quotes from the call (when answering a question around carrier implications going into FY22 and its impact on CCI): “I can’t think of another time in history of our business where we’ve had four well capitalized carriers [AT&T, Verizon, T-Mobile, and Dish] with spectrum and the desire to deploy network.”
  • Seeing record tower growth now; small cell growth will be longer term driver
    • Customers upgrading existing tower sites as a part of their first phase of 5G build-out.
      • Mid-band (C-band) and high-band (mmWave) spectrum are both are relevant for 5G and will drive lease up activity for CCI.
      • Carrier spend is currently focused on deploying mid-band spectrum as this is the first stage of 5G deployment and is often referred to as the “goldilocks” band as it is an ideal balance between bandwidth and propagation (i.e. its ability to carry more data and travel far distances). It can be deployed via towers and small cell, but towers remain the most cost-effective way for carriers to deploy spectrum at scale and establish broad network coverage.
      • Carriers just spent a ton (~$90B) at the recent C-band spectrum auctions… and now they’re focused on deploying it.
      • This near-term carrier focus is on C-Band deployment is stalling small cell deployment growth. C-band spectrum sits next to the spectrum used by air traffic control and is the tied to the FAA concerns in the news. On the call related to this they said, “There has not been any change in their behavior with our customers and we don’t expect there to be any impact to our 2022 outlook.”
    • Small cells are the next stage…
      • High-band (mmWave) spectrum is the next stage and is relevant for what’s often called the “real 5G” which would deliver on the huge gains in performance that 5G promises (step function increase in latency and bandwidth). It has significantly more capacity, but over a fraction of the geographic coverage area (lower propagation) which is why it needs to be deployed using small cells connected to fiber, making it ideal for dense urban areas. This densification is a driver of additional leasing as it’s a critical tool for carriers to accommodate continued growth in mobile data demand b/c it enables carriers to get the most out of spectrum assets by reusing it over shorter and shorter distances.
      • Growth in small cells should drive improving returns as they expect decreasing capital intensity for growth within their small cell and fiber business. With small cells there are “anchor nodes” and “colocation nodes” – the first “anchor” nodes are a lower ROI and additional nodes on existing infrastructure have higher incremental margins. So as lease-up activity continues, their ROI improves.
      • Small cell business is indeed picking up – this is key to the long-term thesis:  the CEO said they are “seeing an inflection in our small cells business” as customers are ” planning for the next phase of the 5G build out” for what they “expect will be a decade-long investment cycle as our customers develop next-generation wireless networks.” They small cell commitments they’ve secured in the last 12 months equate to 70% of the total small cells they’ve booked in their history prior to 2021.
  • Balance sheet strength – They continue to methodically reduced the risk profile of their balance sheet. Since they achieved their initial investment grade credit rating over 5 yrs. ago, they have increased average debt maturity from 5 yrs. to >9yrs, reduced average borrowing costs to 3.1% from 3.8% and increased the mix of fixed-rate debt to > 90% from < 70% w/ no meaningful near term debt maturities. So limited near term exposure to rising rates.
  • Sustainability/ESG considerations…
    • Continue to aim for their goal of carbon neutrality by 2025 for Scope 1 and 2 emissions.
    • With labor shortages and rising prices, they have continued to make an effort to provide value and opportunity for their carriers: “…we’re happy to provide the capital at a much lower cost than what the markets can provide them capital because of the opportunity that we have to see returns from multiple operators across that same asset.”
    • Their solutions also help address societal challenges like the digital divide in under-served communities by advancing access to education and technology. “To date, we have invested nearly $10 billion in towers, small cells and fiber assets located in low income areas.”
    • Enhanced focus on ESG may drive increased revenue opportunities from things like smart cities and “broadband for all” and lower operating costs in areas like tower lighting and electric vehicles.
  • Reasonably valued – trading at >4% 2022 AFFO yield. With LT AFFO/share growth of 7-8% and >3% dividend yield, they should compound total returns low double-digits over a long period of time as demand for their shared infrastructure offering is tied to robust mobile data growth (~30% annually).


Micah Weinstein

Research Analyst


Direct: 617.226.0032

Fax: 617.523.8118


Crestwood Advisors

One Liberty Square

Suite 500

Boston, MA 02109

www.crestwoodadvisors.com


SHW Q4 2021 Earnings

Current price: $285         Price target: $330

Position size: 3.65%        TTM Performance: 23%


Key Takeaways:

  • Results being weighed on by supply chain constraints – Q4 sales in-line with expectations but earnings fell short. Positive demand commentary. Second half weighted outlook for FY22 due to near term headwinds.
  • They will benefit from strong demand trends, pricing actions and improving margins when current headwinds recede – Raw material availability, Omicron variant, inflation pressures, and supply chain constraints meaningfully impacted revenue growth and margins across all segments. Strong consumer demand, increase in volume, and pricing action will address these concerns and help push the company past these short-term headwinds. Management sees raw material supply issues receding in FY22 which will help drive growth and margins back to historical levels. A moderation in commodity prices will also help fundamentals recover.
  • Quotes from the call
    • Raw material availability remained a challenge. There was some improvement, but recovery was not as quick as we would have liked. Commodity and other costs remained elevated and we continue to implement price increases. The new wrinkle was the impact of the Omicron variant which was meaningful.”
    • We see an operating environment with strong demand across architectural and industrial end-markets.”
    • “Our outlook also assumes that the market rate of inflation for our raw material basket will be up by a low double-digit to mid-teens percentage in 2022 compared to 2021″
    • “We expect to open between 80 and 100 new stores in the U.S. and in Canada in 2022. We’ll be focused on sales reps, capacity and productivity improvements, systems as well as product innovation.”


Additional Highlights:

  • Revenue and margin headwinds will subside later in 2022…
    • Disruptions are acting as a short-term headwind – Natural disasters (winter storm Uri and Hurricane Ida) destroyed the industry’s raw material supply chain, which led to poor availability and unprecedented cost inflation due to high demand. Labor and transportation costs also became elevated throughout the year. Lastly, the new COVID variant (Omicron) added to operational complications.
    • They’re taking action (all of which is aided by their scale & pricing power) – continued price increases, vertical acquisition (specialty polymers) that will aid supply, and they continue to invest in growth initiatives – they have significant production capacity available today and are bringing 50 million gallons of incremental architectural production capacity. “We’re leveraging all of our assets, including our store platform, our fleet, our distribution centers and more, to let us come up with unique and creative customer solutions that others simply can’t.”
    • Gross Margins will improve – w/ price increases, higher volumes and falling inflation through FY22. “We expect to see year-over-year inflation in all four quarters with the largest impacts likely occurring in the first quarter in gradual reductions each quarter as the year progresses.”
  • America’s Group ($3B), +3.0%:
    • A decrease in segment margin was caused by lower sales volume and higher raw materials costs, but were slightly offset by selling prices increases.
    • 35 net new stores opened in Q4 2021, and they are expecting to open an additional 80-100 new stores in 2022 (U.S. and Canada, specifically).
  • Consumer Brands Group ($647m), -7.8%:
    • The Wattyl divestiture played a material part in this – when adjusted for this, sales growth was flat.
    • A decrease in segment margin was caused by lower sales volume, higher raw material costs, and supply chain inefficiencies detracted, but were partially offset by good cost control and increases in selling price.
  • The Performance Coatings Group ($1.5B), +18.7%:
    • Strong growth driven mainly by price and volume increases.
    • Segment margin decreased largely due to increasing raw material costs (inflation was the highest for this segment), but somewhat offset by strong operating leverage from higher volume, selling price increases, and good cost control.
  • FY Guidance: expect high single-digits to low double-digit percentage sales increase – heavily weighted in the second half of FY22.
    • TAG: up mid-to-high sing-digit percentage.
    • CBG: down mid-teens percentage – includes negative 4% related to Wattyl divestiture.
    • PCG: up low-to-mid single-digit percentage.
    • Expecting continued margin headwinds, especially in the first half of FY22, but a recovery in the second half of FY22 across all segments.
      • “…’10, ’11, ’12, we saw that big run up in titanium dioxide, we saw our margins get to contract and then we saw growth from ’13 to ’16 of almost 600 basis points. We expect to see a similar environment today.”
  • Strong macro indicators that point to strong recovery for the company and overall industry
      • Near record highs for the Remodeling Market Index
      • Strong LIRA (leading indicator of remodeling activity)
      • Large backlog of entry level and luxury homes
      • Strong momentum in the Architectural Billings Index and Dodge Momentum Index
    • Continued choppiness for raw material availability, especially in the first quarter of FY22.
  • Balance sheet remains strong – leverage ratio is between 2-2.5x. Debt is 92% fixed rate.
  • Strong history of returning capital to shareholders continues – In 2021, they increased their dividend over 20%, marking the 43rd consecutive year they increased their dividend.
  • Valuation – trading at ~3.1% forward FCF yield; inflation is negatively impacting margins and working capital.


Apple Q1 Earnings


Current Price: $170                                                    Price Target: $185

Position Size: 7.85%                                                        TTM Performance: +29%


Key Takeaways:


  • Solid revenue beat as supply chain problems were less severe than expected. Semi shortages and Covid related manufacturing disruptions impacted Q1 by $6B less than the $10B expected.  
  • iPads were the weakest product as they were hardest by shortages – this was consistent w/ the guidance they gave last quarter
  • Gross margins well ahead of guidance – 43.8% up 160 basis points quarter due to volume leverage and favorable mix partially offset by higher cost structures. Guidance was for 41.5 to 42.5% (up from <40% in 2020).
  • China continues to be strong – +21% YoY growth, significantly growing the installed base.
  • Guidance – Expect to achieve solid year-over-year revenue growth and set a March quarter revenue record despite significant supply constraints. Supply constraints will be a smaller impact in Q2 than in Q1 (December quarter). They expect Services growth to decelerate as they lap tough compares.


Additional highlights:


  • Seeing record demand – Q1 revenue was $124B, +11%, reached new all-time records in the Americas, Europe, Greater China, and the rest of Asia-Pacific and it was also an all-time record quarter for both products and services. They saw growth across every product category except iPad (due to supply chain issues)
  • Segments:
    • iPhone – revenue 58% of revenue, grew +9.2% YoY, well ahead of estimates. The iPhone 13 family continues to be in very high demand. Installed base is >1 billion devices.
    • Mac –  Revenues were up +25% YoY despite supply constraints. All-time record and the last 6 quarters for Mac have been its best four quarters ever.
    • iPad – revenue was down -14% YoY due to significant supply constraints
    • Wearables – revs were +13% YoY. Apple watch installed base continues to expand as more than 2/3 of Apple Watch buyers in the quarter were new to the product.
    • Strong Services growth driven by growing installed base which hit a record of 1.8B
      • Revenue +24% YoY; set a new all-time revenue record ($19.5B).
      • Now at 785m subs, added 40m from Q4; and up 165m from last yr. and 5x the number of subs they had less than  5yrs. ago.
  • 5G upgrade cycle – only in the early innings of 5G. If you look at their 5G penetration around the world, there is only a couple of countries that are in the double digits yet.
  • Why we still like
    • Big moat underpinned by growing installed base which drives their virtuous cycle.. More users of their devices lures developers to create better apps which lures more users. This is key to their LT growth. Apple continues to significantly expand their installed base. And they have multiple new products being launched and more in the pipeline (e.g. AR glasses, Apple car) that could be key drivers of LT growth….and, importantly, a growing services business tied to all these products. Part of what differentiates Apple is they design their own silicon for the processor chips that are the brains of their iPhones and iPads and now their Macs, which gives them better control over performance and feature integration in their devices. This has proven to give them an advantage with the way they design their products and an advantage with developers. So, now they have Macs, iPhones and iPads running the same underlying technology which should make it easier for Apple to unify its apps ecosystem, including allowing iPhone and iPad apps to run on Macs. This advantage and the relevance of their ecosystem gets more and more important as computing power in phones increases, 5G delivers better connectivity and, as a result, we have the ability to use their devices in enhanced ways (w/ increased revenue opportunities) ….like apps that take advantage of augmented reality and IoT related technologies.
    • Reasonable valuation…
      • Trading at ~4% FCF yield on 2022 (a small premium to the S&P) and a 0.5% dividend yield w/ another almost 3% of their market cap ($80B) in net cash on their balance sheet.
      • For reference, pre-pandemic in Jan 2020, Apple was trading at ~4.7% FCF yield and 1% dividend yield with ~7% of their market cap in net cash.
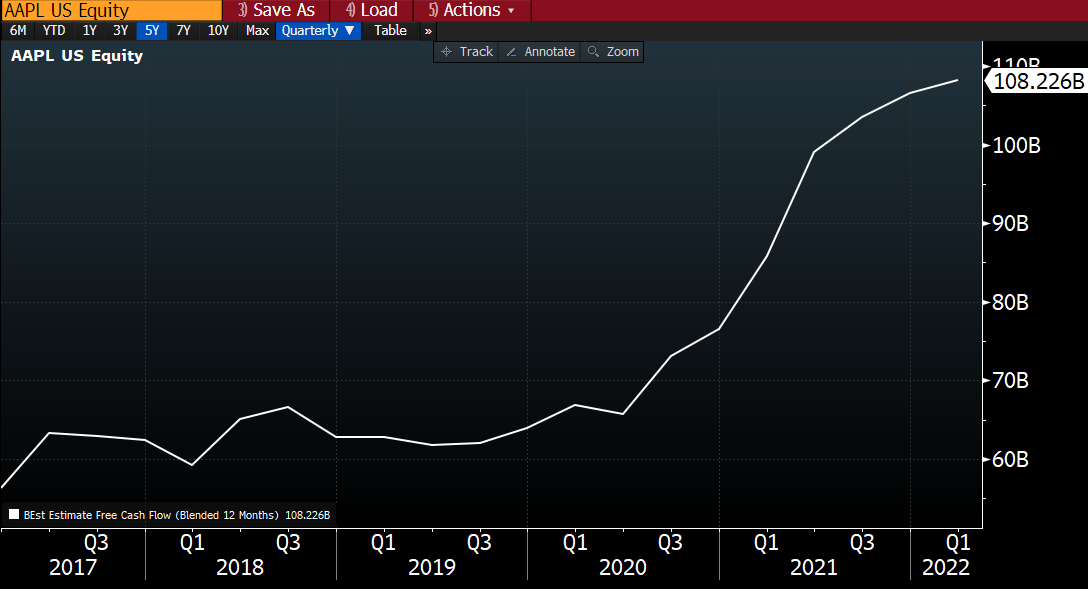
      • Their market cap has been tracking their massive increase in FCF estimates. FCF this year should be ~80% higher than pre-pandemic fiscal 2019
      • Huge amount of cash on their balance sheet w/ years of buybacks to support valuation
        • Capital returns may need to expand further to hit their net-cash-neutral target in a few years. 
        • With current net cash of ~$80B and expectations of over $460B of FCF over the next 4 years, shareholder returns could be over $500B or almost 20% of their current market cap.
        • They’ve returned >$550B since 2012. So, from 2012 to 2026, they may return >$1T.


$AAPL.US

[category earnings]

[tag AAPL]


Sarah Kanwal

Equity Analyst, Director


Direct: 617.226.0022

Fax: 617.523.8118


Crestwood Advisors

One Liberty Square, Suite 500

Boston, MA 02109
www.crestwoodadvisors.com


MSFT Q222 Earnings Update

Current Price:   $294                     Price Target: $375

Position Size:    7.7%                     TTM Performance: 27%


Key takeaways:

  • Broad beat, solid Q3 guidance and commercial bookings growth.
  • Revenue growth was +20% YoY revenue growth and EPS +22% YoY.
  • Azure continues to be key growth driver – they saw slight deceleration (+45% from +48%), but forecasted for a re-acceleration. As I’ve noted many times, this business can be lumpy w/ an increasing amount of large contracts. While a small acceleration/deceleration here can often move the stock short-term, they key point is that they are well positioned in this business and continue to take share. This will be a solid long term growth driver for the company.


Additional Highlights:


  • Quotes…
    • On labor market: “We are experiencing a great reshuffle across the global labor market as more people in more places than ever rethink how, where and why they work” benefitting LinkedIn
    • On the reimagined work environment: “The future of how we work, connect, and play, one thing is clear: the PC will be more critical than ever. There has been a structural shift in PC demand emerging from this pandemic.”
    • On inflation: they sell products that help companies deal with inflationary pressures. “Digital technology is a deflationary force in an inflationary economy. Businesses – small and large – can improve productivity and the affordability of their products and services by building tech intensity.”
    • On the metaverse:  as the digital and physical worlds come together we’re seeing real enterprise metaverse usage from smart factories to smart buildings to smart cities. We’re helping organizations use the combination of Azure IOT, digital twins and mesh to help digitize people places and things in order to visualize, simulate and analyze any business process.”
  • Commercial cloud, which aggregates Azure, Office 365, the commercial portion of LinkedIn and Dynamics grew +32% YoY, closing in on a $90B annual run rate (Azure is >$40B run rate, so approaching half). They continue to see significant growth in the number of $10 million plus Azure and Microsoft 365 contracts.
  • Secular growth: While Microsoft benefited from accelerated digital transformation from the pandemic, they are well positioned to capitalize on a number of long-term secular trends that will continue to drive mid-to-high teens earnings growth. Secular drivers include public cloud and SaaS adoption, continued digital transformation, AI/ML, BI/analytics, and DevOps. As organizations become increasingly digital, MSFT’s products are evolving from being primarily productivity tools to being more strategic tools. This suggests an improving value proposition to customers, which is key to the durability of their LT growth and profitability.
  • Segment detail…
    • Productivity and Business Processes ($16B, +19% YoY):
      • LinkedIn – revenue increased 37% (up 36% in constant currency) driven by Marketing Solutions growth and an improving job market in their Talent Solutions business.
      • Office 365 Commercial (rev +19%)- driven by installed base expansion as well as higher ARPU. Demand for security, compliance and voice offering drove continued momentum in E5 (highest tier) licensing.
      • Dynamics 365 (rev +45%) – Power Platform (low-code, no-code tools, robotic process automation, virtual agents and business intelligence) now has >20 million monthly active users.
    • Intelligent Cloud ($18B, +26% YoY):
      • Server products and cloud services revenue increased 29% with Azure revenue growth of 46% driven by strong demand for their consumption based services.
      • An increasing mix of large, long-term Azure contracts can drive quarterly volatility in the growth rates.
      • Leader in hybrid cloud and have more datacenter regions than any other provider and continuing to add data center regions and extending their infrastructure to the 5G network edge helping operators and enterprises create new business models and deliver ultra-low latency services closer to the end-user. AT&T for example is bringing together its 5G network with MSFT’s cloud services to help General Motors deliver next generation connected vehicle solutions to drivers.
    • More Personal Computing ($13.3B +12% YoY):
      • Windows OEM revenue increased 25%. Seeing continued strength in PC demand despite ongoing supply chain disruptions.
      • Surface revenue increased 8%
      • Gaming revenue increased 8%. Xbox hardware revenue grew a 4%, driven by demand for new consoles and better than expected supply. Xbox and content and services revenue increased 10%.
      • Search advertising revenue increased +32% YoY as companies pick up spending on digital advertising
  • Microsoft is looking to acquire Activision Blizzard in an all cash deal for $69B (net of ~$6B in cash). MSFT has ~$125B in cash on hand. It is expected to close by July 2023 pending approval by regulators…approval could be an issue. This acquisition would be MSFT’s largest deal ever (see chart below). This acquisition represents not only investment in their gaming business, but also in the metaverse. MSFT has been working on building their original game content and Activision Blizzard’s library of original games and game developer talent would add to that.  In terms of the metaverse…video games represent key potential metaverse content and MSFT, w/ their HoloLens headset, has the #2 virtual reality hardware (second to Meta/FB’s Oculus headset) underpinning the immersive aspect of the metaverse. MSFT is focused on other metaverse aspects as well, including new collaboration capabilities (e.g. joining Teams meetings w/ avatars) and they plan to roll out software tools related to metaverse content development. “When we talk about the metaverse, we’re describing both a new platform and a new application type, similar to how we talked about the web and websites in the early ’90s” CEO Satya Nadella said. Others are investing heavily in this space as well…Google is working on hardware, Apple is also working on a VR/AR headset that could be released later this year. In October Accenture said it bought 60K Oculus headsets to train new employees.


  • Valuation:
    • Valuation has gotten cheaper…trading at >3% FCF yield on 2022. A premium to the S&P and of the mega cap tech names that we own, this is the most expensive…supported by a high moat, strong margins, robust secular growth and the absence of antitrust scrutiny (though their peers try to agitate to have them included).
    • Recurring revenue is >60% of total, underpins most of their valuation and is resilient and poised to be a greater part of the mix. Particularly Azure, Office 365 and Dynamics 365. 


Sarah Kanwal

Equity Analyst, Director


Direct: 617.226.0022

Fax: 617.523.8118


Crestwood Advisors

One Liberty Square, Suite 500

Boston, MA 02109

www.crestwoodadvisors.com


Accenture Q1 Earnings

Current Price: $401     Price Target: $435 (increased from $355)

Position size: 5.25%    Performance TTM: +70%


Key Takeaways:

  • Strong results and issued very strong guidance. Revenue (+27%) beat and meaningfully increased full year revenue growth guidance to +19 to +22% (from +12-15% YoY). Saw continued op margin expansion (+20bps) despite higher attrition, investments in training and significantly reinvesting in the business.
  • Broad based strength in demand – They saw double-digit growth across all markets, all industry groups and all services. Record bookings of $16.8B, +30% YoY. Overall book-to-bill of 1.1.
  • Digital transformation is long-term secular growth driver to their business –
    1. They are a market leader uniquely positioned to benefit from secular growth driven by evolving technologies including cloud, analytics, security, blockchain, IoT and artificial intelligence. Accenture has an advantage w/ their unique positioning of trusted partner w/ leading edge technology expertise (they have >8K patents and their own network of R&D labs) combined with strategy and consulting practitioners that bring deep industry expertise. No competitor has their scale, breadth of services and cross-industry insights, which gives them an advantage in serving “compressed transformations.”
    2. Over 70% of their revenue is from digital, cloud and security. They say around 30%-ish of workloads have moved to the cloud
    3. “Our clients know that through our investments and focus on innovation, we will help future-proof them.”We are rapidly moving to a complete re-platforming of global business… it is hugely significant.”
  • Quote from the call on the metaverse: “while the metaverse has recently burst into the public eye, we’ve been an early innovator in applying the technology. In fact, we often innovate on cutting-edge technologies by deploying them at Accenture first. We are proud to have the largest enterprise metaverse through what we call the Nth Floor and are deploying over 60,000 virtual reality headsets and have created One Accenture Park, a virtual campus for onboarding and immersive learning including meeting rooms and collaborative experiences..”
  • Elevated utilization and attrition metrics driven by strong demand trends Utilization remains elevated (~92%) as they try to keep up w/ demand. Attrition went up from 17% to 19%. This is slightly ahead of pre-pandemic levels and seems driven by incredibly high demand for talent in the current environment (as opposed to cultural issues w/ attracting/retaining talent) which could negatively impact profitability. Related to this, their record level “billable headcount” additions (~54K) this quarter is re-assuring.
  • Accenture shines from an ESG perspective. They are a real leader in addressing how they create value for all of their stakeholders (employees, customers, vendors, shareholders) – it’s a constant theme on their calls, particularly w/ respect to their employees which is important as the “social” factor for them is very material b/c their industry is a “people business” w/ >600K employees across the globe.
  • Valuation:
    • The stock is reasonably valued trading at close to a 3% forward yield and they have an easily covered 1% dividend and no net debt.
    • Multiple underpinned by ACN being a best-in-class company with stable growth that’s buffered by geographic and end market diversity and long-standing client relationships (95 of their top 100 clients have been with them for >10 years).
    • They have >$6B in cash on their balance sheet. The only debt they have on their balance sheet are capitalized leases, which were added last fiscal year due to an accounting change. Substantially all of their lease obligations are for office real estate.


  • Investment Thesis:
    • Market leader uniquely positioned to benefit from secular growth driven by evolving technologies including cloud, analytics, security, blockchain, IoT and artificial intelligence.
    • Their differentiated strategy positions them well to continue gaining share. Having a consulting arm with deep industry expertise, combined with technology expertise, is a structural advantage as it enables them to provide end-to-end strategic technology solutions for their clients across industries.
    • Their competitive advantage is their brand, their scale, and their breadth of expertise. They build on this advantage by continuously innovating and investing for future relevance. Disciplined M&A and investment in training and R&D helps them attract and retain top talent and reinforces their market leadership.
    • Diversified industry and geographic end market exposure provides a level of defensiveness.
    • High ROIC, strong FCF generation and disciplined capital allocation – enduring model for shareholder value creation, with share buybacks, a growing dividend and M&A supported by strong free cash flow generation and a solid balance sheet.


Sarah Kanwal

Equity Analyst, Director


Direct: 617.226.0022

Fax: 617.523.8118


Crestwood Advisors

One Liberty Square, Suite 500

Boston, MA 02109

www.crestwoodadvisors.com


$ACN.US

[tag ACN]

[category equity research]


CSCO Q1 2022 Results

Current Price: $53                           Price Target: $62

Position size: 2.8%                          TTM Performance: +30%


Key Takeaways:

  • Broad based demand growth but seeing headwinds from supply chain delays and chip shortages – supply constraints will last at least through the first half of next year and are impacting their ability to convert historically high demand into revenue. This is expected to impact the timing of revenue…causing next Q revenue to be lower than expected, but full year revenue guidance maintained.
  • Taking price increases – a series of prices increases will offset impact to margins but at a lag. The increases won’t be felt for a couple quarters. Some ordering strength was likely driven by customers trying to get ahead of price increases.
  • Secular drivers ramping – they are benefiting from digital transformation w/ the ramping of associated key technology transitions (Wifi 6, 5G, 400 gig, edge) that are catalysts to companies modernizing their aging network infrastructure. They’ve been investing behind these big market transitions for a long-time, they’re finally coming to life and will be long-term growth drivers for their business.
  • CEO Chuck Robbins said…”The bad news is: we’ve had obviously challenges getting things shipped to our customers. The good news is:  our backlog is at an all-time high for our company; it’s never been higher.”


Additional Highlights:  

  • Revenue was $13 billion, up 8% YoY, in line with their guidance range.
  • Strongest product order growth in a decade – up 31% YoY on broad based strength across most segments, end markets and geographies.
  • Supply chain issues – “snarled logistics” (ocean, air & trucking) and delayed component availability (e.g. seeing key suppliers like Fabrinet significantly adding to capacity but it takes time)…but they are starting to see signs of stabilization. For instance, memory costs are beginning to decline which suggests the market is starting to come into balance.
  • They’re taking prices to offset higher costs – when all of this eases, it should be a tailwind to margins.
  • Additional quotes from the call…
    • On supply chain issues: “While our revenue growth was solid, it was impacted by the supply constraints which are affecting our technology peers and nearly every other industry. Our product orders were extremely strong and balanced across our markets, but we are constrained in what we can build and ship to our customers”
    • “We have been taking multiple steps to mitigate the supply shortages, and deliver products to our customers, including working closely with our key suppliers and contract manufacturers, paying significantly higher logistics costs to get the components where they are most needed, working on modifying our designs to utilize alternative suppliers where possible, and constantly optimizing our build and delivery plans.”
    • On inflation and price increases: “We are doing this at a breath and scale that is significantly greater than most in our industry. Of course, all these steps, while necessary to maximize our production and delivery to customers, add to our cost structure. When combined with cost increases we are seeing from many of our suppliers, these factors are putting pressure on our gross margins. While we’ve thoughtfully raised prices to offset this impact, the benefits are not immediate and will be recognized over the coming quarters.”

  • Growing mix of recurring revenue should expand their multiple –Software mix is close to 1/3 of revenue w/ >80% of software sold as subscription. That means over 1/4 of total sales is from software subscriptions sales. Additionally, ~22% of rev is services with much of that from maintenance/support which tend to be recurring. Between the two, annual recurring revenue is ~42% . They have a growing “as-a-service” portfolio driving the mix shift happening w/in their business which should be supportive of their multiple and their margins. They continue to offer more products this way including Cisco Plus their new network-as-a-service offering. Their focus on subscriptions, allows them to deliver innovation faster to customers, while providing more predictability and visibility to their business over the long-term.
  • Continued momentum w/ web-scale cloud providers –commentary continues to be very positive. This is an important area of growth for them. They had record performance with over 200% order growth – seeing early traction of their 400-gig solutions, a huge testament to the investments they’ve made. This is an end market where they lost share to Arista in the past, but their positioning is improving w/ new products launched last year. Their Silicon One platform which they’ve broadened from a routing focused solution to one which addresses the webscale switching market, offering the highest performance, programmable routing and switching silicon on the market.
    • “the performance of the Silicon One architecture is pretty incredible, and in a world where sustainability is a massive issue for everyone. When you look at the performance to power consumption ratio, it leads the world. And so, when you look at the speed and the number of ports and the performance that we’re able to deliver at the lower power consumption, it is super meaningful. And so, not only is a great technology, but it comes at a significantly lower power consumption and I think those are couple of the big reasons.”
  • Valuation: trading at a almost a 7% FCF yield on fiscal 2022, which ends in July. This is well below S&P average of ~4%, for a strong balance sheet, high FCF generative business (~30% FCF margins) w/ a growing mix of software and recurring revenue. Fundamentals continue to be supported by business transformation/digitization trends (which are accelerating) at a reasonable valuation while much else in tech has seen substantial multiple expansion. Additionally, their valuation is supported by a 2.8% dividend yield which they easily cover. They grew their dividend for the 10th consecutive year and are committed to returning 50% of FCF annually to shareholder through dividends and buybacks. They have ~$14B in net cash on their balance sheet, or >6% of their market cap.


Sarah Kanwal

Equity Analyst, Director


Direct: 617.226.0022

Fax: 617.523.8118


Crestwood Advisors

One Liberty Square, Suite 500

Boston, MA 02109

www.crestwoodadvisors.com


$CSCO.US

[category earnings ]

[tag CSCO]

TJX Q3 Results

Current Price:   $73                        Price Target: $83

Position Size:    3.7%                      TTM Performance: 30%


Key takeaways:

  • Very positive call; seeing robust demand – Better than expected SSS drove revenue and EPS beat. Sales up 20% and profits up 23% vs the same period pre-pandemic. “Open-only” SSS were +14%. These open-only comp store sales compare FY22 sales (this fiscal yr.) to FY20 sales (calendar 2019). Strong trends are continuing into the current quarter with QTD SSS trending up mid-teens.
  • They have an inventory advantage in the current retail environment – unlike other retailers, they have plenty of product that they are continuously flowing to their stores (immense buying, planning, logistics teams, strong vendor relationships and flexible/high inv. turn model all aid this) and positioned to take advantage of inventory opportunities (i.e. packaway) that may arise from the disruption in the supply chain.
  • Positive margin commentary – Freight and wage pressure is being more than offset by operating leverage on higher sales and higher merchandise margin (driven by multiple factors including taking price in select categories). When freight pressures abate, margins will expand.
  • Home category continues to be “off the charts” and launched HomeGoods e-commerce site in September
  • Seeing extremely plentiful inventory buying opportunities“we can’t emphasize this enough, availability of quality branded merchandise is excellent, and we’re confident that we have plenty of inventory in our stores and online for the holiday season.”


Additional Highlights:


Quotes from the call…

  • Gaining share:
    • “Our flexible model has been a tremendous advantage in this environment. We’ve been able to expand and contract categories and merchandise in our stores, so that customers have full racks and shelves to shop when they visit”…”most of the inventory we need for the holiday season has already been delivered to us or is scheduled to arrive in stores and online in time for the holidays.”
    • “one of the things that’s happened in COVID is TJX, I believe, when you look at all the branded vendors in the market, we are probably more important today than we’ve ever been. We’re probably more important to the market place than we were pre-COVID. When you look at the amount of volume that we’re doing.”
  • Inflation:
    • “we are convinced that our relentless focus on value is a tremendous advantage. In an inflationary environment we believe even more consumers will be seeking out value. We are confident that our value position will be a very attractive option for consumers looking to stretch their dollars without sacrificing on quality and brands.”
    • We believe our top line initiatives can lead to outsized sales which is our best opportunity to offset some of the persistent cost pressures we face.”
  • On inventory opportunity in current environment:
    • “as we come out of holiday we could see a tremendous amount of packaways based on the supply chain challenges the whole markets going to run into. And if they end up with some late deliveries that don’t make it in for Christmas, which is very possible… if they didn’t plan their cadence correctly, then I think that is going to spill off a great opportunity for us to have increased packaways for next year — for next fall that we would be buying this January-February and I’m anticipating that could be a huge benefit to us.”
  • On their business model & current environment: “we’re close out-driven…we, in-season, hand-to-mouth, by a bulk of what we do. We buy very opportunistically that way…[] Retail is pretty strong out there obviously… []…and for a lot of the public company brands that are wholesalers, it allows them — they want to keep chasing that business with their more regular price accounts –  it allows them to get bullish knowing that we’re always there on the backside for the excess inventory…..We always like it when everyone’s business is good in this environment. As we go to next year, I think you’re going to see a lot of wholesalers, now stepping out to be a little more bullish on their upfront orders for those retailers knowing that they have TJX later for the cleanup, so to speak. So, I think that whole piece, which is probably one of the biggest pieces of our business is looking forward to a tremendous opportunity as we move forward because of that dynamic.”
  • Sales are tracking ahead of pre-pandemic levels…
    • Overall sales were $12.5B, over $2 billion more than the same quarter pre-pandemic.
    • Open-only comp sales vs pre-pandemic (fiscal 2020 but calendar 2019)
      • Overall: +14%
      • Marmaxx U.S. +11% – Home category similar to HomeGoods segment; apparel up mid-single digits (footwear & apparel are ~50%)
      • HomeGoods U.S. +34%
      • Canada +8%
      • International +10%
  • Higher merchandise margins continue to mitigate covid costs, higher wages and higher freight– Despite 160 basis points of incremental freight expense, higher merch margin led to a 30bps pre-tax margin increase vs fiscal ’20. They paid an appreciation bonus to store associates which should recede but expect freight to likely persist for the remainder of the year. HomeGoods margin is disproportionately impacted by freight increases due to its product mix.
  • Long-term thesis intact – Relative to other brick-and-mortar focused retailers, TJX  continues to have a superior and very differentiated model. They acquire their inventory from an enormous (and growing) network of vendors, acting like a clearing mechanism for the retail industry…essentially opportunistically buying leftover/extra product that constantly flows from retailers, branded apparel companies etc. Growth of e-commerce has led to better inventory opportunities/ selection, not worse. They leverage their massive store footprint and centralized buying to merchandise their stores and e-commerce sites w/ current on-trend product. No one else does this at the scale they do. Their immense buying, planning and allocation, logistics teams are helping them navigate the current environment. They have very quick inventory turns and can be nimble and re-active w/ their inventory buys and are an important partner to their sources of inventory…and becoming even more important. It’s a powerful model that continues to take share and, while they have a growing e-commerce business too, their store model has been very resistant to e-commerce encroachment. Moreover, they have a thriving Home business, a growing e-commerce presence, an expanding international store footprint and a track record of steadily positive SSS. Prior to last year, in their 44 year history they only had 1 year of negative SSS (this is unheard of!). So, with steadily positive SSS, a slowly growing store footprint and an emerging e-commerce business, TJX steadily grows their topline w/ consistent margins that are about double that of department stores.
  • Valuation: Balance sheet continues to improve, they’ve returned to their capital allocation program w/ dividend and buybacks and the valuation is reasonable at ~3.5% FCF yield on next yr.


Sarah Kanwal

Equity Analyst, Director


Direct: 617.226.0022

Fax: 617.523.8118


Crestwood Advisors

One Liberty Square, Suite 500

Boston, MA 02109

www.crestwoodadvisors.com


$TJX.US

[tag TJX]

[category earnings]


Home Depot Q3 Earnings

Current Price: $393                     Target Price: $410

Position size: 2.3%                        Performance since inception: +45%


Key Takeaways:

  • Better than expected results as comparable store sales were +6.1% as elevated home improvement demand persists. They had positive comps every week despite unprecedented compares from last year.
  • Talk of “peak growth” not concerning  – despite slowing SSS, multiple secular tailwinds persist.
  • Pro sales growth now outpacing DIY as consumers resume large projects and return to pre-pandemic activities. 
  • Still not giving guidance: “we do not believe we can accurately predict how the external environment and cost pressures will evolve and how they will ultimately impact consumer spending.”


Additional Highlights:

  • Quotes…
    • On duration of supply chain constraints: I would say this goes well into, if not through 2022 and we’ll keep doing what we’re doing with the innovation we’ve talked about and leveraging our scale as well as our new assets. I mean, when you think of our inventory growth, part of that is stocking these new facilities. So, not only have we improved our in-store stocking levels and been able to meet the accelerating demand through the quarter, but we’re also stocking all those new facilities that I talked about. So, we’re clearly getting disproportionate flow and that’s where our merchants and supply chain teams will continue to push.” This speaks to their scale and supply chain advantage in getting product on their shelves.
    • Demand trends: “we continue to see customers taking on larger home improvement projects as evidenced by the continued strength with our Pro customer which once again outpace the DIY customer”…”customers continue to tell us that they have projects on their list; Pros tell us that their backlogs are significant.”
    • Housing market: “when you look at the constrained availability of new housing, that clearly is having a positive impact on home values. And when customers home values are in a positive side of the ledger, they feel good about investing in their homes. I think that is, for sure, an element that is helping the overall home improvement dynamic. That housing availability shortage isn’t going to get solved anytime soon at the rate that we’re building homes, even though it’s an accelerated rate from where it’s been. That backlog is going to be there for quite some time.”
    • Consumer spending trends: “as the year started everybody believed during 2021 that we would see a significant shift away from goods back to services as the economic environment opened up, as we got our arms around the pandemic. Clearly, we have not seen that. I’d say that from the standpoint that yes you’ve seen things like travel and restaurants open up, but the customers continue to spend in the home improvement space. And, to date, we have not seen that dramatic shift back that everybody predicted”…”we think that the underlying factors for the home improvement industry are strong.”
  • Solid current trends:
    • Sales were $37B or +9.8% YoY on 6.1% SSS.
    • SSS of 3.1% in August, 4.5% in September and 9.9% in October. Q4 SSS are running ahead of total Q3 SSS.
    • E-commerce (mid-teens % of sales) grew 8% YoY as they lapped almost 90% growth last year.
    • 55% of online orders being fulfilled through stores, supportive of their omnichannel advantage
    • Big-ticket comp transactions or those over $1,000 were up approximately 18%, indicative of strong consumer environment
  • Managing well in difficult retail environment – While the retail industry is broadly seeing industry-wide supply chain disruptions, inflation and a tight labor market., they’ve not had issues hiring associates, in-stock levels are solid and they can pass through pricing – and inflation is a tailwind to SSS which drives some operating leverage.
  • Secular tailwinds persist…more homes need to be built. This should be a LT secular driver for HD.
    • Undersupply of homes continues to support pricing and years of underbuilding has shifted the age of the existing US housing stock – both of which support home improvement spending.  
    • According to a recent study by the National Association of Realtors, due to years of underbuilding, the US is short 6.8 million homes.
    • Building would need to accelerate to a pace that is well above the current trend…. To more than 2 million housing units per year vs a ~1.6m annual rate for starts.
    • From the NAR report released in June…“Following decades of underbuilding and underinvestment, the state of America’s housing stock, which is among the most critical pieces of our national infrastructure, is dire, with a chronic shortage of affordable and available homes to house the nation’s population. The housing stock around the nation has been widely neglected, with a severe lack of new construction and prolonged underinvestment leading to an acute shortage of available housing, an ever-worsening affordability crisis and an existing housing stock that is aging and increasingly in need of repair.”
  • Talk of “peak growth” not concerning
    • Growth rate slowing doesn’t mean the business is shrinking or that the multiple will contract. While the rate of growth (after massive demand increase during Covid) will clearly slow, their business will continue to grow over time. Their long-term drivers are the durable housing trends, taking share in a fragmented home improvement market w/ DIY & Pro, grow their more nascent MRO business (particularly after HD Supply acquisition) and leverage their best of breed omni-channel model.
  • Best of breed omni-channel model drives productivity 
    • By adding specialized warehouse capacity and enhancing digital capabilities (online and in the store), HD is uniquely positioned to leverage their existing retail footprint (not really growing stores) and drive steadily high ROIC that is ~45% (which is incredible).
    • They dominate the category, are the low cost provider, have a relentless focus on productivity and can continue to flow an increasing amount of goods through their big box stores w/ omni-channel. This is a highly efficient model as 55% of online sales are picked up in-store which HD can fulfill from the store or nearby warehouses.
  • One Supply Chain rollout continues – investments support HD as the fastest, most efficient, low-cost provider. They continue to add new bulk distribution centers (used replenish stores with lumber and building materials), flatbed distribution centers (which are often tied to the bulk distribution centers), MDOs (market delivery operations are used to flow through big and bulky products, particularly appliances) and are now at 7 direct fulfillment centers for e-comm fulfilment – they’ll ultimately have ~20 direct fulfillment centers which will allow them to cover 90% of the country in same or next-day delivery.

·        Capital allocation: they’ve resumed share repurchases and remain committed to growing their dividend over time.

·        Valuation: Strong balance sheet, benefiting from strong housing trends but also has defensive qualities and a reasonable valuation, trading at just <4% forward FCF yield.


Sarah Kanwal

Equity Analyst, Director


Direct: 617.226.0022

Fax: 617.523.8118


Crestwood Advisors

One Liberty Square, Suite 500

Boston, MA 02109

www.crestwoodadvisors.com


$HD.US

[tag HD]

[category earnings]


Disney Q4 earnings

Current Price: $160     Price Target: $215

Position size: 2%          TTM Performance: +18%   


 Key Takeaways:

  • Lower than expected Disney+ subscribers, impacted by covid related content headwinds –  subs were slightly lower than expected (but in-line w/ lowered guidance). The pandemic has impacted the cadence of new content which drives subs, but production is ramping w/ a lot of new content slated for the 2H 2022. In general, Disney+ has been ramping far ahead of initial expectations but with no change to breakeven guidance for their DTC platform, as they increase investment on content.
  • Higher spending on Parks and content impacting near term profits
  • Capital return still paused


Additional highlights:

  • Long-term subscriber targets maintained, but quarterly new subs were lower than expected
    • They now have 179M subs (consensus was 187m) across Disney+, Hulu and EPSN+. That is second only to Netflix, which has a little over 200M….Disney’s achieved that in 2 years.
    • Disney+ now has 118M subs, Hulu is ~44M and ESPN has ~17M. 
    • In the past fiscal year they’ve grown the total number of subscriptions across their entire DTC portfolio by 48% and Disney+ subs by 60%.
    • “we remain focused on managing our DTC business for the long-term, not quarter-to-quarter, and we’re confident we are on the right trajectory to achieve the guidance that we provided at last year’s Investor’s Day reaching between 230 million and 260 million paid Disney+ subscribers globally by the end of fiscal year 2024 and with Disney+ achieving profitability that same year.”
  • Higher content spend and global rollout will continue to support sub growth
    • Doubling the amount of original content with marquee brands Disney, Marvel, Pixar, Star Wars and National Geographic coming to Disney+ in FY’22 with the majority arriving July through September.
    • On Thanksgiving Day, premiering the first of Peter Jackson’s highly anticipated, six episode Beatles documentary Get Back.
    • https://www.thebeatles.com/news/%E2%80%9C-beatles-get-back%E2%80%9D-disney-original-documentary-series-directed-peter-jackson-debut-exclusively
    • They continue to build out ESPN+ with exclusive sports content. “with every new sports rights deal, we have considered both linear and DTC in fact all seven of the major deals we made in the last year and a half included a streaming component.” This includes: “Man in the Arena: Tom Brady”, Monday Night Football With Peyton and Eli, a historic 10-year NFL rights agreement, which begins in 2023 and a 7 year rights deal w/ the NHL. ESPN+ is the sole home for more than 1,000 out of market NHL games.
    • “the single most effective way to grow our streaming platforms worldwide is with great content and we are singularly focused on making new high quality entertainment including local and regional content that we believe will resonate with audiences.”
    • Disney+ now in over 60 countries and more than 20 languages. Next year they’ll add 50 plus additional countries including in Central Eastern Europe, the Middle East and South Africa. Their goal is to more than double the number of countries to over 160 by fiscal year ’23.
  • Online sports betting: indicated on the call that they’re interested in pursuing this in a meaningful way and are looking at partnering w/ 3rd parties in this space. There has already been talk of an agreement w/ Draftkings….Disney already owns ~4.5% of DraftKings stock (from their 2019 Fox acquisition).
  • Metaverse: yes, even Disney is talking about this. This idea of the next stage of the internet, or the embodied internet is a growing topic…given Disney’s owned content and focus on experiences, they view themselves as well positioned for “storytelling without boundaries and our own Disney Metaverse.”
  • ARPU should steadily rise over time – overall ARPU this quarter was $4.12 (ex-Hotstar, it was $6.24). Their ARPU is weighed down by lower Disney+ fees outside the US, but they will gradually raise prices over time and they have ways (other than sub fees) to make money off of their content w/ advertising, parks and consumer products (especially w/ content like Pixar, marvel, star wars).
  • Flexibility is a key component of their distribution strategy. They have 3 approaches for distributing films. 1) Release in theaters with a simultaneous offering via Disney+ Premier Access, 2) release straight to Disney+, and 3) traditional exclusive theatrical releases. Hybrid releases mitigated the impact of theater closures, but theaters are re-opening and they intend to continue to use this model.  
  • Improving demand w/ parks and cruises
    • Park re-openings…everything is open. They are opportunistically raising prices. Parks are generally operating at or near current capacity limits w/ robust guest spending trends and strong reservations. Margins are still below pre-Covid, but given some changes in both the revenue and the cost side, once capacity constraints are lifted, they think they will exceed previous margin levels. For example, mobile food ordering, virtual queues, dynamic pricing. Per capita revenue is up 30% vs 2019. One-third of guests at WDW are buying the Genie+ upgrade at $15/guest/day – that is a very, very material increase in per caps and margins. Return of international guests at domestic resorts will be a tailwind.
    • Cruises: all 4 ships are sailing, seeing “tremendous demand” and they’re adding a new ship in 2022.
  • Valuation – at a similar multiple to NFLX on 2023 subscriber revenue, Disney’s DTC business accounts for over 50% of their valuation, with the rest of their business (~80% of revenue) accounting for the rest, including all linear TV (e.g. ABC & ESPN), movies, advertising, parks, cruises and consumer products.  


Sarah Kanwal

Equity Analyst, Director


Direct: 617.226.0022

Fax: 617.523.8118


Crestwood Advisors

One Liberty Square, Suite 500

Boston, MA 02109

www.crestwoodadvisors.com


$DIS.US

[category earnings ]

[tag DIS]