MSFT Earnings Update

Current Price:   $285                     Price Target: $340

Position Size:    7.9%                     TTM Performance: 40%


Key takeaways:

  • Broad beat with 21% YoY revenue growth and +42% op. income growth.
  • Azure continues to be key growth driver – Azure continues to take share in the public cloud with revenue growth of +51% YoY (+45% constant currency), similar to last quarter. Issued solid Azure guidance for next quarter.
  • Teams gaining traction – they now have 250M monthly active users.
  • CEO, Satya Nadella said
    • “We are innovating across the technology stack to help organizations drive new levels of tech intensity across their business.”
    • “Hybrid work represents the biggest change to the way we work in a generation and will require a new operating model spanning people, places and processes. We are the only cloud that supports everything an organization needs to successfully make the shift. Microsoft Teams is the new front-end.”


Additional Highlights:


  • Commercial cloud, which aggregates Azure, Office 365, the commercial portion of LinkedIn and Dynamics accelerated by 200bps sequentially to 31% YoY cc growth reaching nearly $80bn run rate (Azure is ~ $36-37B run rate, so approaching half). They saw significant growth in the number of $10 million plus Azure and Microsoft 365 contracts.
  • While Microsoft benefited from accelerated digital transformation from the pandemic, they are well positioned to capitalize on a number of long-term secular trends that will continue to drive mid-to-high teens earnings growth. Secular driver include public cloud and SaaS adoption, continued digital transformation, AI/ML, BI/analytics, and DevOps. As organizations become increasingly digital, MSFT’s products are evolving from being primarily productivity tools to being more strategic tools. This suggests an improving value proposition to customers, which is key to the durability of their LT growth and profitability.
  • Productivity and Business Processes ($14.7B, +25% YoY):
    • LinkedIn – revenue increased 46% (up 42% in constant currency) driven by Marketing Solutions growth of 97%
    • Office 365 Commercial (rev +20%)- driven by installed base expansion as well as higher ARPU.
    • Dynamics 365 (rev +33%) – strong momentum in Power Apps and Power Automate, reflecting growing demand for their solutions to build apps and automate workflows.
    • Teams continues to shine – they now have 250m monthly active users.
  • Intelligent Cloud ($17.4B, +30% YoY):
    • Server products and cloud services revenue increased 34% with Azure revenue growth of 51% (45% cc). Exceeded their expectations across consumption and per user Azure businesses as well as their on-premises server products business.
    • An increasing mix of large, long-term Azure contracts can drive quarterly volatility in the growth rates. Leader in hybrid cloud and have more datacenter regions than any other provider – and continuing to add data center regions, including new regions in China, Indonesia, Malaysia, as well as the US.
  • More Personal Computing ($14.1B +9% YoY):
    • Surface was weak as they face ongoing constraints in the supply chain
    • Gaming revenue increased 11% (7% in constant currency). Xbox hardware revenue grew a 172% (163% in constant currency), driven by demand for new consoles. Xbox and content and services revenue declined 4% against a high prior year comparable.
    • Search advertising revenue improved (+53% YoY) as companies pick up spending on digital advertising ahead of re-opening.
  • Valuation:
    • For FY ’21, they generated over $76B in operating cash flow, up 26% YoY and over $56B in free cash flow, up 24% YoY.
    • Recurring revenue is ~60% of total, underpins most of their valuation and is resilient and poised for additional growth. Particularly Azure, Office 365 and Dynamics 365. Stock is trading at ~3% forward FCF yield; a premium to the S&P, but supported by their high moat and solid secular growth drivers.


Sarah Kanwal

Equity Analyst, Director


Direct: 617.226.0022

Fax: 617.523.8118


Crestwood Advisors

One Liberty Square, Suite 500

Boston, MA 02109

www.crestwoodadvisors.com


Visa Q3 Earnings

Current price: $248        Target price: $278

Position size: 3.7%          TTM Performance: 25%


Key takeaways:

  • Beat estimates Net revenue rose 27%, far exceeding mgmt. expectations due to the strength in the US, improving cross-border volumes and lower-than-expected client incentives
  • Record quarter in terms of payment volumes with much more recover to come – especially in cross border which is improving but still well below 2019 levels particularly w/ travel related spending. Some of the improvement came from a spike in cross-border cryptocurrency purchases in April and May.
  • Seeing no reduction in spend due to the Delta COVID variant, even in countries with high case counts.
  • No specific guidance


Additional Highlights:

  • Quote from the call…
    • “we have seen immediate impacts when popular travel destinations open their borders. Greece opened borders in April and inbound card-present spend rose nearly 30 points by the end of June relative to 2019 levels. France opened on June 9 and inbound card-present volume rose nearly 20 points by the end of June relative to 2019.”
  • Strong Q3 trends:
    • Payments volume ahead of 2019 – was +21% vs 2019, which is up five points sequentially from 2Q and represents a 34% year-over-year growth rate
    • Debit remained strong and has accelerated since Q2
    • Credit spending is now also improving – global credit payments volume was 104% of 2019
    • Face-to-face payments volume trends are stable to improving, while e-commerce or card-not-present remains elevated
    • Cross border improving but still below 2019 – cross-border volume, excluding intra-Europe, was 82% of 2019, seven points better than 2Q and up 53% year-over-year. Cross border volumes related to travel (ex-intra Europe) are at 50% of 2019 levels.
    • Trends continuing to improve in July – through July 21 US Payment volume up 31% vs 2019, with debit up 36% and credit up 17%.
  • Tailwinds building: pending travel recovery, re-opening beneficiary, accelerated cash digitization and growing e-commerce penetration…
    • Credit improvement is driven by acceleration in travel, entertainment, and restaurant spending, as well as affluent cardholder spending
    • Cash digitization and eCommerce are driving debit growth
    • Mgmt. said travel is approaching 2019 levels in July, while entertainment surpassed 2019 levels in May.
    • Cross border spending drives International transaction revenues which are >25% of total net revenues. As international travel rebounds, Visa will see a recovery in this meaningful piece of revenue. The vast majority of the travel Visa captures on their credentials is consumer, and they are the global leader in travel co-branded cards.
  • Crypto opportunity:
    • “leaning into in a very, very big way, and I think we are extremely well positioned”
    • Enabling purchases, enabling conversion of a digital currency to a fiat on a Visa credential, helping financial institutions and fintechs have a crypto option for their customers and upgraded their infrastructure to support digital currency settlement
    • They have over 35 digital currency platforms/wallets that are working with them
    • Working with Central Banks as digital currency is being explored in many nations
  • Growth in “buy now, pay later”…
    • Nascent but growing
    • Visa is working with third party providers as well as offering their own proprietary platform that would allow issuers to offer their own buy now, pay later capability
    • “we’re doing a lot in this space. We’re committed to it… I can’t predict exactly where it’s going to land, but we are going, to the degree it takes off, we’re going to be there to be part of it.”
  • Growth areas…
    • Consumer payments – digitizing the $18 trillion spent in cash and check globally. Continuing to grow acceptance (including contactless penetration) and grow credentials with traditional issuers, fintechs and wallets. In the last two years, they’ve grown their credentials to 3.6B and physical merchant locations to over 70m, up 7% and 34%, respectively. Notably, “merchant locations” only count partners like PayPal and Square each as one. LT opportunity to grow the pie for digital payments w/ the 1.7 billion unbanked.
    • New Flows – $185 trillion in B2B, P2P, B2C and G2C. P2P, which represents $20 trillion of the opp., was Visa Direct’s first use case and continues to grow substantially. A key area of future growth is cross-border P2P, or remittance. Four of the top five global money transfer operators were onboarded in fiscal year 2020, TransferWise, Western Union, Remitly, and MoneyGram. In G2C, for example, Visa Direct supported the US government’s disbursements of economic impact payments to nearly 13 million Visa prepaid credentials so far this year.
    • Value-added services – includes consulting, technology platforms (e.g. Cybersource, issuer processing, and risk identity and authentication), data and insights, and card benefits, all which will improve with the recovery. Opportunity to increase penetration w/ existing clients. In fiscal year 2020, more than 60% of their clients used at least five value-added services from Visa and more than 30% used 10 or more.
  • While COVID has been a headwind for Visa, particularly in cross border volumes – the long-term thesis is intact. Visa is a high moat, duopoly company with extremely high FCF margins (approaching 50%), strong balance sheet and continued runway for secular growth driven by the shift from cash to card/digital payments and new payment flow opportunities. Getting more expensive, trading at <3% FCF yield.


Sarah Kanwal

Equity Analyst, Director


Direct: 617.226.0022

Fax: 617.523.8118


Crestwood Advisors

One Liberty Square, Suite 500

Boston, MA 02109

www.crestwoodadvisors.com


$V.US

[category earnings]

[tag V]


GOOG Q2 Earnings

Current Price: $2,727     Price Target: $3,100

Position Size: 4.6%         TTM Performance:+75%


Key Takeaways:

  • Broad beat – consolidated revenues were $61.9B, up 62% w/ meaningful op leverage – op margin hit 38% (of net rev), up from 36% in Q1 and 33.7% in Q4. Was high 20s pre-pandemic.
  • Digital ad spending continues to surge – saw broad-based strength in advertiser spend as they lapped of the first ever revenue decline in their ads business last year
  • Cloud strength continues – accelerated to 54% from 46% last quarter (mid 40s range last few quarters)
  • Capex spending resuming – continuing to pick up the pace of investment in office facilities and data centers. Most recently announced a second cloud region in India, their 26th cloud data center region globally.


Several e-commerce quotes on the call…

  • “Moving on to retail, where momentum remains strong. We’re continuing to build an open ecosystem that benefits both users and merchants. Last year, we removed financial barriers with free product listings and zero commission fees. This year, we’re removing integration barriers with Shopify, WooCommerce, GoDaddy and Square, merchants can now onboard and show their products across Google for free. And our Shopping Graph is using AI to connect these products to the people who want them with over 24 billion listings from millions of merchants across the web.”
  • “Let’s talk omnichannel. Last quarter, I said it was here to stay and it is. Retailers continue to build their digital presence to drive both online and offline sales, and we’re helping them to do it.”
  • “On YouTube, look, I mean, if you look at the engagement across the platform, we definitely see a lot of headroom for e-commerce. Over the past year, you’ve seen us really focus on accelerating a shift to in terms of onboarding merchants across Google. So we’ve definitely invested both in terms of bringing merchants on board, removing barriers there, providing better integrations by partnering with players, platform providers across the industry. And now we are investing in our consumer experience speed on Google search or on YouTube. And so you will see us roll out features over time.”
  • “we’re working hard to build and open retail ecosystem. And that really levels the playing field for all merchants, and we think there is a lot of opportunity ahead.”
  • “…interesting trend, people are more eager than ever to support their local small businesses. Searches for support local business are up like 20x last year in the US alone. And this is creating a lot of opportunity for SMBs overall.”

“Search & Other” revenue: $36B, up 68%

  • Retail was by far the largest contributor to the YoY growth of their Ads business.
  • Travel, financial services and media and entertainment were also strong contributors.

YouTube ad sales: $7B, up 84% YoY

  • Over 120 million people watch YouTube on TVs every month; that’s up from ~100 million last year
  • Potential for e-commerce to be a growth driver – they have number of shopping capabilities already underway, and working to make it easier for users to discover and buy directly on YouTube…“stay tuned for more updates later this year”
  • Strong value proposition to advertisers & positioned to capture the shift in advertising away from linear TV
    • YouTube helps advertisers reach audiences they can’t reach anywhere else (especially younger audiences)
    • According to Nielsen data, on average 70% of YouTube’s reach was delivered to an audience not reached by the advertiser’s TV media. In other words, YouTube’s reach is becoming increasingly incremental to TV.
    • Nielsen found that US advertisers who shifted just 20% of spend from TV to YouTube generated a 25% increase to the total campaign reach within their target audience while lowering the cost per reach point by almost 20%.
    • So not only driving improved reach, but also helping brands do it more efficiently


Network ad revenues: $7.6B, up 60%. This is revenue from ads placed on sites other than their own, like an ad placed on the NYT site.


Google cloud = Google Cloud Platform (“GCP”) + Google Workspace (i.e. collaboration tools):

  • Revenue grew 54% YoY to $4.6B w/ an operating loss of $591m
  • GCP’s revenue growth was again above Cloud overall, reflecting significant growth in both infrastructure and platform services.
  • Key differentiators helping their cloud strategy –
    • Security – they pioneered zero-trust architecture; “increase in cyber and ransomware attacks is a wakeup call for the industry”
    • Real-time insights – expertise in real-time data and analytics – key for their data cloud which is one of the fastest growing segments of the market.
    • Expertise in AI & machine learning
    • Industry-specific solutions

Other Bets

  • Revenues were $192 million, the operating loss was $1.4 billion
  • Waymo – launched services to the public in Phoenix last fall. Has now served tens of thousands of rides w/out a human driver in the vehicle.

ESG:

  • They aim to operate on 24-7 carbon free energy by 2030
  • Several of their data centers are already operating at ~90% carbon-free energy


Valuation – They generated $59B in FCF in the last 12 mos. and ended the quarter with $108B in net cash, that’s ~6% of their market cap. The stock is still reasonably valued, trading at a ~3.7% FCF yield on 2021. They have ~$43B remaining in their buyback authorization and have been stepping up their pace of buybacks.


Sarah Kanwal

Equity Analyst, Director


Direct: 617.226.0022

Fax: 617.523.8118


Crestwood Advisors

One Liberty Square, Suite 500

Boston, MA 02109

www.crestwoodadvisors.com


Apple Q3 Earnings

Current Price: $146                                                    Price Target: $157

Position Size: 7.5%                                                     TTM Performance: +57%


Key Takeaways:


  • Strong beat across all products & services – revenue up 36% and profits almost doubled
  • China continues to be strong – +58% YoY growth. Set a June quarter revenue record and significantly growing the installed base. In greater China, 85% of Apple Watch buyers were new to the product and 66% of Mac and iPad buyers were new.
  • No specific guidance again – Growth this Q will be lower than last quarter’s 36% b/c of Fx, greater supply constraints and lapping a more difficult Services compare. The constraints will primarily impact iPhone and iPad.


Additional highlights:


  • Seeing broad based growth – set new June quarter records in almost every product segment (iPad was highest in a decade, for everything else it was a record June Q) and in every geographic region with very strong double digit growth in each one of them.
    • iPhone – up +50% YoY. The iPhone 12 family continues to be in very high demand. Installed base is >1 billion devices.
    • Mac – the last four quarters for Mac have been its best four quarters ever. Revenues were up 16% YoY despite supply constraints.
    • iPad – up 12% in spite of significant supply constraints. Started shipping iPad Pro powered by the M1 chip.
    • Wearables – grew 36% YoY. Nearly 75% of Apple Watch buyers were new to the product. This quarter, they began shipping AirTags – their new stalking device. JK.
    • Strong Services growth driven by growing installed base
      • Revenue +33% YoY; set a new all-time revenue record.
      • Mix shift towards Services drove 80bps in GM expansion to 43.3%.
      • Now at 700m subs, up 150m from last yr. 4x the number of subs they had 4 yrs. ago.
      • Introduced Apple Podcast subscriptions.
      • Apple TV + was the recipient of 35 Emmy nominations this year, which speaks to the quality of their programming (Ted Lasso is excellent if you haven’t seen it!).
  • 5G upgrade cycle on the horizon – only in the early innings of 5G. If you look at their 5G penetration around the world, there is only a couple of countries that are in the double digits yet.
  • Growing installed base is key positive – this drives their virtuous cycle. More users of their devices lures developers to create better apps which lures more users. This is key to their LT growth. Apple continues to significantly expand their installed base. And they have multiple new products being launched and more in the pipeline (e.g. AR glasses, Apple car) that could be key drivers of LT growth….and, importantly, a growing services business tied to all these products. Part of what differentiates Apple is they design their own silicon for the processor chips that are the brains of their iPhones and iPads and now their Macs, which gives them better control over performance and feature integration in their devices. This has proven to give them an advantage with the way they design their products and an advantage with developers. So, now they have Macs, iPhones and iPads running the same underlying technology which should make it easier for Apple to unify its apps ecosystem, including allowing iPhone and iPad apps to run on Macs. This advantage and the relevance of their ecosystem gets more and more important as computing power in phones increases, 5G delivers better connectivity and, as a result, we have the ability to use their devices in enhanced ways (w/ increased revenue opportunities) ….like apps that take advantage of augmented reality and IoT related technologies.
  • Despite increase in price, Apple is still not expensive…
    • Trading at >4% FCF yield on 2021 (in line w/ S&P) and a 0.6% dividend yield w/ another 3% of their market cap ($72B) in net cash on their balance sheet.
    • Their market cap has been tracking their massive increase in FCF estimates. See chart below – the green line (left scale) is forward 12 month FCF estimate.
    • For reference, pre-pandemic in Jan 2020, Apple was trading at ~4.7% FCF yield and 1% dividend yield with ~7% of their market cap in net cash.
    • Huge amount of cash on their balance sheet w/ years of buybacks to support valuation
      • Capital returns may need to expand further to hit their net-cash-neutral target in a few years. 
      • With current net cash of ~$72B and expectations of >$450B of FCF over the next 5 years, shareholder returns could be ~$500B or  >20% of their current market cap.
      • They’ve returned >$530B since 2012. So, from 2012 to 2026, they may return >$1T.


$AAPL.US

[category earnings]

[tag AAPL]


Sarah Kanwal

Equity Analyst, Director


Direct: 617.226.0022

Fax: 617.523.8118


Crestwood Advisors

One Liberty Square, Suite 500

Boston, MA 02109
www.crestwoodadvisors.com


SHW Q2 Earnings

Current price: $287         Price target: $310

Position size: 3.6%          TTM Performance: 38%


Key Takeaways:

  • Slight miss on lower DIY demand which is normalizing after pandemic driven surge. Increased demand from Pros, commercial and industrial are offsetting. Consolidated net sales increased 17% w/ SSS of 19%.
  • Overall demand environment continues to be strong – strong housing market and improving industrial end markets bode well for demand.
  • Raised prices to offset rising raw material costs – saw GM pressure in the quarter (320bps; SG&A leverage partially offset), but committed to fully passing through higher raw materials which they now expect to be mid-teens for the year.
  • No change to outlook despite slight miss
  • CEO John Morikis said, “I’ve got great confidence that as we come out of this, you’re going to see that same coiled spring that we’ve exited other challenging times uncoil and we’re going to accelerate that… as our competitors continue to close stores and close territories and we continue to invest in a number of areas. We’re going to take advantage of this market and we actually, as difficult as these times are, these are the best times for our company.”


Additional Highlights:

  • Revenue and margin headwinds will subside…
    • Supply chain disruptions are temporary headwind to growth – saw an 3.5% drag on revenue growth from the “Uri” winter storm in Feb that impacted the complex Petrochemical supply chain. Impact split evenly across the Americas Group and the Consumer Brands Group.
    • Gross Margins will improve – similar to past cycles, price increases come at a lag to higher raw material costs which are 80-85% of COGS for paint. The result is a near term hit to gross margins, but they will maintain pricing and see gross margins expand as some of the temporary drivers to higher commodity costs recede.
  • This environment may improve their competitive positioning and client/partner relationships…
    • “We’re leveraging all of our assets, including our store platform, our fleet, our distribution centers and more, to let us come up with unique and creative customer solutions that others simply can’t”…” We are unique in the fact that we have our own fleet of vehicles, we have 860 tractors and 2,100 trailers that we use to expedite these raw materials into our plants and in many cases right now from our plans to customer projects, so it’s the entire supply chain… working to expedite and cut out as many days as possible.”
  • America’s Group ($3.1B), +23%:
    • Same store sales increased 19.3% (lapping a -7%)
    • Sales in all end markets, except DIY, were up double-digits led by residential repaint, commercial and property maintenance that more than offset the decrease in DIY. As expected, sales to DIY customers were down double-digits, driven by difficult comparisons.
    • Contractors are reporting solid backlogs. Fourth consecutive quarter spray equipment sales increased by double digits. This continues to be a very healthy sign of recovery as contractors typically invest in this type of equipment in anticipation of solid demand.
  • Consumer Brands Group ($732m), -25%:
    • Lower DIY demand was a big drag (but is their smallest segment) resulting in lower sales volumes to their retail customers – this was partially offset by selling price increases. Also saw a 4% drag from a divestiture.
  • The Performance Coatings Group ($1.6B), +41%:
    • All divisions in this industrial focused segment delivered strong double-digit growth, led by industrial wood and general industrial
    • Positive trends in new residential construction are driving increased demand for kitchen cabinetry, flooring, and furniture.
  • Guidance:While we are very encouraged with our strong start to the year in a seasonally smaller quarter and continuing strength in the demand environment, our full year adjusted earnings guidance remains unchanged given the near-term uncertainty of raw material availability and cost inflation. Despite the uncertainties, our businesses are extremely well positioned, and we remain confident in our long-term ability to grow faster than the market.”
  • Balance sheet remains strong – leverage ratio is ~2.5x.
  • Strong history of returning capital to shareholders continues – In 2020, they increased their dividend 19%, marking the 42nd consecutive year they increased their dividend. They’ve also bought back 6.4m shares YTD.
  • Reasonable valuation – trading at ~3.5% forward FCF yield.


Sarah Kanwal

Equity Analyst, Director


Direct: 617.226.0022

Fax: 617.523.8118


Crestwood Advisors

One Liberty Square, Suite 500

Boston, MA 02109
www.crestwoodadvisors.com


$SHW.US

[category earnings]

[tag SHW]


CCI Q2 2021 Results

Current price: $192         Target price: $201

Position size: 2.3%           TTM Performance: 14%


Key takeaways:

  • Seeing record level of tower activity as existing wireless carriers increase their 5G spend in what should be a massive, decade-long investment and DISH is starting to build a new nationwide 5G network from scratch.
  • Stock is down (after hitting an all-time high recently) on lowered full yr. small cell guidance. Long-term small cell growth dynamics intact.
  • Solid AFFO/share growth – they now anticipate 12% growth in AFFO/share for the full year 2021, meaningfully above their long-term annual target of 7% to 8%. They expect to grow the dividend in line w/ AFFO growth.
  • 5G investment cycle is (finally) ramping…CEO Jay Brown said, “Following a period of building excitement and anticipation, we have seen a significant increase in activity as our customers have started to upgrade their networks to 5G at scale.”


Additional highlights:

  • Quote from the call: “We are seeing the highest level of tower activity in our history as our customers are focusing on utilizing towers in the first phase of deploying their 5G networks nationwide. This initial focus on towers has led to delays in some of our small cell deployments that impacts the timing of when we expect to complete the nearly 30,000 small cells currently in our backlog.”
  • Carrier spend focused on deploying mid-band spectrum led to reduced full year outlook for small cell deployments (to 5,000 vs. 10,000 prior) but LT dynamics intact – in the near-term, carrier focus is on C-Band (mid-band) deployment which is stalling small cell deployment growth.
      • Mid-band (C-band) and high-band (mmWave) spectrum are both are relevant for 5G and will drive lease up activity for CCI.
      • C-Band is the first stage of 5G deployment and is often referred to as the “goldilocks” band as it is an ideal balance between bandwidth and propagation (i.e. its ability to carry more data and travel far distances). It can be deployed via towers and small cell.
      • Carriers just spent a ton (~$90B) at the recent C-band spectrum auctions and now they’re focused on deploying it.
      • High-band (mmWave) spectrum is the next stage and is relevant for what’s often called the “real 5G” which would deliver on the huge gains in performance that 5G promises (step function increase in latency and bandwidth). It has significantly more capacity, but over a fraction of the geographic coverage area (lower propagation) which is why it needs to be deployed using small cells connected to fiber, making it ideal for dense urban areas. This densification is a driver of additional leasing. Growth in small cells should drive improving returns as they expect decreasing capital intensity for growth within their small cell and fiber business. With small cells there are “anchor nodes” and “colocation nodes” – the first “anchor” nodes are a lower ROI and additional nodes on existing infrastructure have higher incremental margins. So as lease-up activity continues, their ROI improves.
  • Balance sheet strength – They continue to methodically reduced the risk profile of their balance sheet. In Q1, they lowered weighted average borrowing costs and extended the average maturity of their debt. Since they achieved their initial investment grade credit rating ~ 5 yrs ago, they have increased average debt maturity from 5 yrs to 10yrs, reduced average borrowing costs to 3.1% from 3.8%, increased mix of fixed-rate debt to > 90% from < 70% and reduced reliance on secured debt to ~15% from ~50%. No meaningful near term debt maturities and ~$4B of undrawn capacity on their revolving credit facility.
  • Sustainability/ESG considerations…
    • “Our business is inherently sustainable” – shared infrastructure solutions limit the proliferation of infrastructure and minimize the use of natural resources
    • Their solutions also help address societal challenges like the digital divide in under-served communities by advancing access to education and technology.
    • Enhance focus on ESG may drive increased revenue opportunities from things like smart cities and “broadband for all” and lower operating costs in areas like tower lighting and electric vehicles
  • Reasonably valued – trading at ~3.7% 2021 AFFO yield. With LT AFFO/share growth of 7-8% and ~3% dividend yield, they should compound total returns low double-digits over a long period of time as demand for their shared infrastructure offering is tied to robust mobile data growth (~30% annually).


Sarah Kanwal

Equity Analyst, Director


Direct: 617.226.0022

Fax: 617.523.8118


Crestwood Advisors

One Liberty Square, Suite 500

Boston, MA 02109

www.crestwoodadvisors.com


$CCI.US

[category earnings]

[tag CCI]


Accenture Q3 Earnings

Current Price: $291     Price Target: $310

Position size: 4.2%       Performance since inception (3/11): +76%


Key Takeaways:

  1. They beat estimates and raised full year guidance. Revenue (+21%) ahead of high end of guidance range and highest street estimate. Upped full year revenue growth guidance to +10% to +11%, from previous guidance of +6.5% to +8.5%,
  2. Broad based strength in demand – digital transformation is long-term secular growth driver to their business.
  3. They continue to take significant market share signifying solid business fundamentals. Bookings were up 39% YoY in Q3.
  4. CEO Julie Sweet said“The dynamics in the market we are seeing are not only a recovery from the lower spending pattern at the onset of the pandemic, but a more sustained growth in demand, as companies race to modernize and accelerate their digital initiatives with compressed transformation.”


Additional highlights:

  • Revenue was +21% constant currency YoY. Included 5pts from Fx. Adjusted EPS of $2.40 (+26% YoY) vs. consensus $1.90, aided by 40bps of op margin expansion. They no longer have the margin expansion tailwind from lower travel as they anniversary the benefit of the compare in this quarter.
  • Strong demand trends are impacting their utilization and attrition metrics. Utilization is elevated (~93%) as they try to keep up w/ demand. Attrition went up from 12% to 17%. Up but similar to pre-pandemic levels. Demand for talent is high.
  • Bookings growth demonstrating momentum in the business –  Overall book-to-bill of 1.2. Consulting book-to-bill of 1.1 and outsourcing book-to-bill of 1.2. YTD bookings up 25% off a base of record sales through Q3 of last yr. (higher than all of ’19 or ’20 in the first 9 mos.). In the quarter, they also had a record 20 clients w/ bookings >$100 million.
  • Now seeing broad based growth across geographies and end markets
    • 11 out of 13 industries growing double-digits
    • N. America revenues +18% driven by double-digit growth in public service, software platforms, consumer goods, retail and travel services.
    • Europe revenues +14% driven by double-digit growth in UK, Italy and Germany.
    • Growth markets +15% led by double-digit growth in Japan and Brazil
  • Digital transformation imperative is long-term secular growth driver to their business. Before Covid there was already exponential technology change taking place with every business becoming a digital business. Mgmt. thought it would take a decade, now they think it is more like five years. “We are rapidly moving to a complete re-platforming of global business… it is hugely significant.” Accenture has been positioning themselves to be a leader in digital capabilities since 2014, which is why they are the leader, continue taking share and are well positioned in the future. Accenture’s unique positioning of trusted partner w/ leading edge technology expertise (they have their own network of R&D labs) combined with strategy and consulting practitioners that bring deep industry expertise are key to this. No competitor has their scale, breadth of services and cross-industry insights, which gives them an advantage in serving “compressed transformations.” “Our clients know that through our investments and focus on innovation, we will help future-proof them.”
  • Accenture shines from an ESG perspective. They are a real leader in addressing how they create value for all of their stakeholders (employees, customers, vendors, shareholders) – it’s a constant theme on their calls, particularly w/ respect to their employees which is important as the “social” factor for them is very material b/c their industry is a “people business” w/ >500K employees across the globe. For instance, they’ve been heavily investing in upskilling their employees and their workforce is now ~46% women; on track for their 2025 goal of a 50-50 gender balance. They also recently started their “360 degree value initiative” – aimed at helping their clients achieve responsible business goals – they say their clients are increasingly focused on sustainability, inclusion and diversity (rise of ESG is a catalyst to this) and that they are in a unique position to help companies w/ this.
  • Capital allocation: they continue to expect to return at least $5.8 billion in cash to shareholders through dividends and share repurchases w/ an expected $8B to $8.5B in 2021 FCF (vs consensus $7.4B). They now expect to invest about $4B (up from $2B) in acquisitions this fiscal year.
  • Valuation:
    • The stock is undervalued trading at a ~4.4% forward yield at the midpoint of 2021 guidance (they’re already in Q4). FCF estimates for 2021 and 2022 will be going up. They have an easily covered 1.2% dividend and no net debt.
    • Multiple underpinned by ACN being a best-in-class company with stable growth that’s buffered by geographic and end market diversity and long-standing client relationships (95 of their top 100 clients have been with them for >10 years).
    • They have $10B in cash on their balance sheet. The only debt they have on their balance sheet are capitalized leases, which were added last fiscal year due to an accounting change. Substantially all of their lease obligations are for office real estate.


Sarah Kanwal

Equity Analyst, Director


Direct: 617.226.0022

Fax: 617.523.8118


Crestwood Advisors

One Liberty Square, Suite 500

Boston, MA 02109

www.crestwoodadvisors.com


$ACN.US

[tag ACN]

[category equity research]


ADBE 2Q Results

Current Price:   $563                  Price Target: $610

Position Size:    2.7%                  TTM Performance: +82% since inception (3/18)


Key Takeaways:

  • Q2 results well ahead of consensus; seeing very strong momentum in their business. Q2 revenue was $3.84B, +23% YoY.
  • Long runway for growthFY21 guidance of ~$15B implies only ~10% penetration on TAM expectations of $147B. That includes ~$85B for Digital Experience and ~$62B for Digital Media (~$41B for creative, ~$21B for document). 
  • Quote from the call, “on track for another record year with a strong first half already in the books. Few companies of our scale can
  • boast 20% plus revenue growth, world-class operating margins and a recurring-revenue model built for long-term growth and profitability.”
  • Digital Media segment ($2.79B, +25% YoY; ~71% of revenue): “unleashing creativity & accelerating document productivity”
      • Comprised of Creative cloud (~60% of total revenue, +24% YoY) and Document Cloud (11% of total revenue, +30% YoY). Q2 total segment growth guided to +21%. Segment Annualized Recurring Revenue (“ARR”) grew to $11.21B.
      • Creative Cloud is benefiting from “exploding” content creation and consumption across phones, tables and desktops. Seeing strong retention and renewal across all Creative products and customer segments.
      • Growth drivers in creative cloud – continuing to drive innovation and extending products to new surfaces with Illustrator on iPad and Fresco on iPhone. And increasing focus on new and emerging content creation categories including 3D, Virtual Reality and Augmented Reality.
      • Document Cloud – seeing increasing unit demand for Acrobat subscriptions across all geos; success in enterprise licensing, with broad seat expansion across enterprise accounts; continued strength with Adobe Sign, which grew ARR greater than 40% YoY.
  • Digital Experience segment (revenue was $938m, +21% YoY; ~29% of revenue): “powering digital businesses”
      • Digital Experience subscription revenue was $817, +25% YoY. Q2 guided to +18%. Segment revenue includes: subscription revenue, professional services revenue, and “other”, which includes perpetual, OEM and support revenue.
      • Beneficiary of growing e-commerce penetration. Adobe offers a digital commerce platform (Magento) that competes w/ Shopify and BigCommerce which benefits from growing e-commerce spending. Recent strategic partnership with FedEx (Shoprunner) allows SMBs to offer expedited shipping capabilities as part of their commerce platform.
  • 2021 Guidance re-affirmed: Expect revenue ~$15.45B +20% YoY basically in-line w/ consensus.
  • Adobe is a rare company w/ >90% recurring revenue, double digit top line growth and ~40% FCF margins. Additionally, the headwinds from Covid (like lower global ad spending and weak SMB demand) are abating, while the accelerated secular tailwinds around digital transformation will be a long-term benefit.


Sarah Kanwal

Equity Analyst, Director


Direct: 617.226.0022

Fax: 617.523.8118


Crestwood Advisors

One Liberty Square, Suite 500

Boston, MA 02109

www.crestwoodadvisors.com


$ADBE.US

[tag ADBE]

[category earnings]


CSCO Q3 2021 Results

Current Price: $52                           Price Target: $58 

Position size: 2.8%                          TTM Performance: 15%


Key Takeaways:

  • Top line and EPS beat with better-than-expected revenue guidance. EPS guidance for next quarter was a slight miss driven by cost pressures from semi supply issues.
  • Robust demand is key positive despite short-term headwind from chip shortages which are weighing on revenue and margins. If not for these semi supply chain issues, revenue and EPS guidance would have been higher.
  • Secular drivers ramping – they are seeing early momentum in the ramping of key technology transitions (Wifi 6, 5G, 400 gig, edge) that are catalysts to companies modernizing their aging network infrastructure. They’ve been investing behind these big market transitions for a long-time, they’re finally starting to come to life and will be long-term growth drivers for their business.
  • Mix shift to software and recurring revenue continues as an increasing number of their products are to be offered this way. They now have one of the largest software businesses in the industry with an annual run rate well over $14B, about 81% of that is SaaS.
  • CEO Chuck Robbins said“we are experiencing the strongest demand in nearly a decade” and “the next phase of the recovery and the future of work will be heavily reliant on our technology.”


Additional Highlights:  

  • Sales of $12.8B (+7% YoY) and EPS of $0.83 beat Street expectations ($12.57B and $0.82, respectively).
  • Quotes from the call…
    • “These results reflect a return to a strong spending environment and an economic recovery that has gained momentum driven by vaccine rollouts and the easing of restrictions. As the economy has improved, customers have increased their investment across our portfolio to prepare for the upturn and return to office.”
    • “Customers are turning to us to help them create the trusted workplace of the future.”
  • Supply chain issues & inflation – component availability is holding back revenue, they absorbed some cost increases to meet demand and started to make some limited price increases. They think this will last through the end of the calendar year – if it’s longer, they will look to make further price increases to offset. They don’t think the demand they’re seeing from customers is being impacted by over-ordering.
  • Improving demand in hardest hit industries – “we’ve actually seen double-digit growth in hospitality and healthcare and retail and we’ve even seen the cruise lines making significant purchases as they prepare to go back out.”

  • Growing mix of recurring revenue should expand their multiple –Software mix is close to 1/3 of revenue w/ 81% of software sold as subscription. That means over 1/4 of total sales is from software subscriptions sales (or ~$14B). Additionally, ~27% of rev is services with much of that from maintenance/support which tend to be recurring. So overall recurring revenue could be ~45% or more (they don’t break it out specifically). They have a growing “as-a-service” portfolio driving the mix shift happening w/in their business which should be supportive of their multiple and their margins. The majority of our total revenue growth in the quarter came from recurring revenue streams.
  • Momentum w/ web-scale cloud providers – the positive commentary from last few quarters continued. Webscale was again ~25% of Service Provider orders, w/ order growth up 25%. This is an end market where they lost share to Arista in the past, but their positioning is improving w/ new products launched last year. That being said, this is still early stages – mgmt. indicated it may take a year or two for this to be a meaningful top line contributor. Could see performance vary quarter to quarter, due to the timing of large deals, but they are “incredibly confident” around their prospects in this area. Recently extended their webscale product offering – broadened their Silicon One platform from a routing focused solution to one which addresses the webscale switching market, offering the highest performance, programmable routing and switching silicon on the market.
  • During Q3, they closed three acquisitions (Acacia Communications, IMImobile, Dashbase) consistent with their strategy of complementing R&D with targeted M&A to strengthen their market position growth areas.
  • Valuation: trading at >7% FCF yield on fiscal 2022, which ends in July. This is well below S&P average of ~4%, for a strong balance sheet, high FCF generative business (~30% FCF margins) w/ a growing mix of software and recurring revenue. Fundamentals continue to be supported by business transformation/digitization trends (which are accelerating) at a reasonable valuation while much else in tech has seen substantial multiple expansion. Additionally, their valuation is supported by a 2.8% dividend yield which they easily cover. They have ~$12B in net cash on their balance sheet, or >5% of their market cap.


Sarah Kanwal

Equity Analyst, Director


Direct: 617.226.0022

Fax: 617.523.8118


Crestwood Advisors

One Liberty Square, Suite 500

Boston, MA 02109

www.crestwoodadvisors.com


$CSCO.US

[category earnings ]

[tag CSCO]

Home Depot Q1 Earnings

Current Price: $312                     Target Price: $340

Position size: >2%                        Performance since inception: +57% (4/16/20)


Key Takeaways:


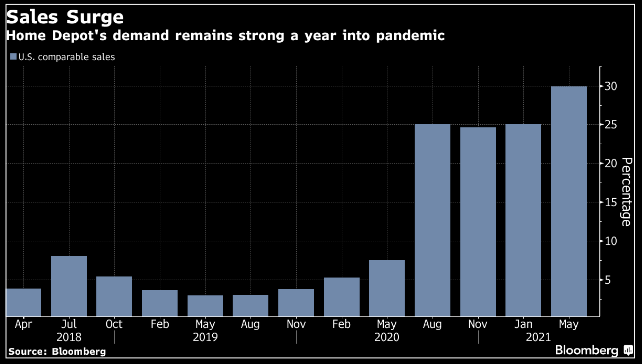
  • Crushed SSS expectations w/ an incredible 31% comparable store sales increase. No doubt there are some stimulus checks being spent at HD. They continue to take share in home improvement.
  • Talk of “peak growth” not concerning  – they face tough SSS comparisons ahead, but multiple secular tailwinds persist.
  • DIY strength continues and Pro growth is accelerating after pent-up demand from social distancing caused a delay in inside projectsThey had double-digit growth with both Pro and DIY customers – “Pros continue to tell us that project demand is strong, and their backlogs are growing.”
  • Omni-channel strategy continues to shine. E-Commerce sales are mid-teens % of sales and up +27% YoY, with 55% of online sales picked up in store.
  • Still not giving guidance
  • Mgmt. quote from call…”we’re at post-World War II housing availability, so you know, two months of supply versus historical average of six, that situation won’t be resolved in near-term. It’s going to take time for that to be resolved, so I think that supports continued growth in home values which, we know, as home values grow, people feel good about investing in their home overall. So that alone is, I think, a very positive outlook for home improvement as you move forward.”


Additional Highlights:

  • Talk of “peak growth” not concerning
    • Growth rate slowing doesn’t mean the business is shrinking or that the multiple will contract. While the rate of growth (after this extraordinary year!) will clearly slow, their business will continue to grow over time. They will be lapping difficult comparisons this coming year, which could lead to some negative SSS results in the near-term. However, this commentary is really just about short-term cadence of growth and not about their long-term opportunity to continue to consolidate a fragmented market in home improvement w/ DIY & Pro, grow their more nascent MRO business (particularly after HD Supply acquisition) and leverage their best of breed omni-channel model.
  • Secular tailwinds persist – rising household formation, record low inventory, higher input costs (materials & labor), stimulus = higher home prices. And higher home prices plus an aging housing stock drive remodeling spend.
    • The bottom line is we need to build more homes. With the backdrop of rising household formation, demand for second homes and an aging home stock, Sam Khater, chief economist at Freddie Mac said, “We should have almost four million more housing units if we had kept up with demand the last few years. This is what you get when you under-build for 10 years.” US housing starts are at a 1.6-1.7m annual rate. Permits are running ahead of starts.
    • Inventory of existing homes for sale is also at a low…two-month supply vs long-term avg of ~6 months (foreclosure moratorium is helping keep inventory low; it’s set to expire in June but could be extended again).
  • Higher inflation = higher SSS = higher operating leverage: SSS had a +375bps impact from inflation driven primarily by lumber and copper. This had a negative impact on gross margins; they are passing through pricing, the negative impact was driven by mix (i.e. lumber is a relatively lower margin item). The net effect for them is growing operating profit dollars. In other words, they benefit. The negative impact of inflation would be if the higher prices started to impact overall demand, but there are no signs of that happening and long-term secular demand drivers are strong. Op margins increased by 380bps in the quarter; natural leverage on higher volumes and inflation added to that.
    • What’s happening with lumber? Perfect storm of supply chain issues and higher demand…
      • Demand rising as new construction and remodeling is booming aided by monetary and fiscal stimulus. Storm repairs have also been a big driver.
      • Sawmill cutting capacity is the supply bottleneck & that might not improve soon – timber gets cut, transported to saw mills which produce lumber. Timber is plentiful, even oversupplied in some areas, but sawmill capacity is tight. This time last year, 40% of sawmills in N America were shut. They didn’t fully re-open until December. Sawmill capacity is still ~15% below where it was in 2006, that was the peak and was the last time this many homes were being built. There isn’t much new sawmill capacity planned, the lead time is fairly long and shortages in the necessary equipment and the labor to operate it are both a hurdle. Tight supplies and high prices could last into 2022 as storm related demand abates but general housing strength continues.
      • Transportation is also feeding into higher prices.
    • Wages/labor shortages – they got out ahead of wage increases, so not seeing a big impact and, overall, not having an issue finding labor. During fiscal 2020, they  invested ~$2 billion on enhanced compensation and benefits for associates – they made about half of those increases permanent.
  • Best of breed omni-channel model drives productivity 
    • By adding specialized warehouse capacity (plan to increase fulfillment sq footage by 70% this yr.) and enhancing digital capabilities (online and in the store), HD is uniquely positioned to leverage their existing retail footprint (not really growing stores) and drive steadily high ROIC that is ~45% (which is incredible).
    • They dominate the category, are the low cost provider, have a relentless focus on productivity and can continue to flow an increasing amount of goods through their big box stores w/ omni-channel. This is a highly efficient model as 55% of online sales are picked up in-store which HD can fulfill from the store or nearby warehouses.
    • Their express car and van delivery service that covers over 70% of the U.S. population.

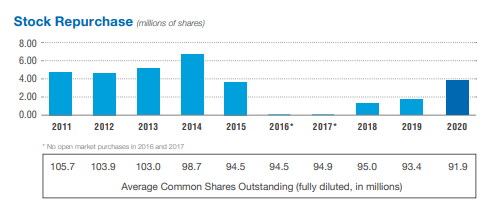
·        Capital allocation: they’ve resumed share repurchases and remain committed to growing their dividend over time – they increased it 10% last quarter.

·        Valuation: Strong balance sheet, benefiting from strong housing trends but also has defensive qualities and a reasonable valuation, trading at ~4.4% forward FCF yield.


Sarah Kanwal

Equity Analyst, Director


Direct: 617.226.0022

Fax: 617.523.8118


Crestwood Advisors

One Liberty Square, Suite 500

Boston, MA 02109

www.crestwoodadvisors.com


$HD.US

[tag HD]

[category earnings]