Accenture Q1 Earnings

Current Price: $268     Price Target: $295 (raised from $267)

Position size: 4.4%       Performance since inception (3/11): +61%


Key Takeaways:

  1. They beat estimates and issued strong guidance. Revenue was above their guided range and consensus. Full year guidance also better than expected.
  2. Broad based improvement in demand – digital transformation is long-term secular growth driver to their business.
  3. Strong bookings and they continue to take significant market share, signifying solid business fundamentals. Bookings were up 25%.
  4. CEO Julie Sweet said“What is becoming even more clear is that we are in an era of compressed transformation in which the winners by industry will be those who were earliest to re-platform their businesses in the cloud and have a digital core and new ways of working that allows them to continuously improve their operations.”


Additional highlights:

  • Headwinds in hard hit industries are moderating – digital transformation imperative is long-term secular growth driver to their business. Before Covid there was already exponential technology change taking place with every business becoming a digital business. Mgmt. thought it would take a decade, now they think it is more like five years. “We are rapidly moving to a complete re-platforming of global business… it is hugely significant.” Accenture has been positioning themselves to be a leader in digital capabilities since 2014, which is why they are the leader, continue taking share and are well positioned in the future. Accenture’s unique positioning of trusted partner w/ leading edge technology expertise combined with deep industry expertise is key to this. “Our clients need our deep technical and engineering skills and our unmatched set of relationships with the world leading technology ecosystem companies which are critical partners to us and to our clients.”
  • Saw broad-based improvement across industries and geographic markets– headwinds in some industries persist but are moderating:
    • In Q1 they “saw a broad based increase in demand that was faster than we anticipated 90 days ago.”
    • Similar to last quarter, ~50% of revenues came from 7 industries that were less impacted from the pandemic that, in aggregate, continue to grow high-single-digits with continued double-digit growth in software platforms, Life Sciences & Public Service.
    • >20% of revenue from clients in highly impacted industries – continue to be pressured but at a more moderate level– this includes travel, retail, energy, aerospace & defense and industrials. While performance varies by group, collectively declined low-single-digits. This is a big improvement from last quarter when this group declined mid-teens.
    • This underscores the benefit of diversified industry end markets.
  • Revenue was $11.8B above consensus estimates at $11.4B. Up +4% YoY, but included 2pt reduction from reimbursable travel costs which are a pass through. Adjusted EPS of $2.17 (+8% YoY), +6% vs. consensus $2.04. Updated guidance for 2Q revenue of $11.55-$11.95B (up 1%-4% YoY)
  • New initiatives…
    • Created Accenture Cloud First to help clients accelerate their move to the cloud – planned $3 billion 3 year investment in capabilities to help clients in re-platforming of global business in the cloud. Recognized as the leading systems integrator for each of AWS, Azure and Google Cloud platform as well as the leading multi cloud managed services provider.
    • 360 degree value initiative – aimed at helping their clients achieve “responsible” business goals – clients are increasingly focused on sustainability, inclusion and diversity (rise of ESG is a catalyst to this). They say they are in a unique position to help companies “re-imagine and rebuild differently for the benefit of all.”
  • Consulting revenues were $6.3B, down 1%, which includes a 3pt headwind from lower travel reimbursement.
  • Outsourcing revenues were $5.4B, up 9% YoY
  • Continued mix shift to “the new” – now 70% of revenue. Digital, cloud and security grew low single digits.
  • Geographic breakdown: strongest markets were Japan and Australia (high-single-digit growth). Europe was down 1% (Italy strong, UK  improving), North America was up 4%.
  • Strong bookings of $13 billion, up 25% YoY balanced contribution from consulting (51%) and outsourcing (49%) with an overall book-to-bill of 1.1. Consulting book-to-bill of 1 and outsourcing book-to-bill of 1.3.
  • Capital allocation: continuing all elements of their capital allocation program – they continues to return cash to shareholders through cash dividends and share repurchases. Invested approximately 500 million in acquisitions so far this yr. and expect to invest at least $1.7 billion in acquisitions, this fiscal year.
  • They are now 45% women; on track for their 2025 goal of a 50-50 gender balance
  • Guidance:
    • For FY 21, they expect revenue to be in the range of 4% to 6% (up from previous guidance of 2% to 5% growth). This includes a 1pt hit from lower travel.
    • Expect diluted EPS in the range of $8.02 to $8.25 or +8% to +11%. Street at $8.06.
    • FY21 FCF to be in the range of $6B to $6.5B (previous guidance was $5.7B to $6.2B)
  • Valuation:
    • The stock is undervalued trading at a ~3.7% forward yield. They have an easily covered 1.3% dividend and no net debt.
    • Multiple underpinned by ACN being a best-in-class company with stable growth that’s buffered by geographic and end market diversity and long-standing client relationships (95 of their top 100 clients have been with them for >10 years).
    • They have $8.7B in cash on their balance sheet. The only debt they have on their balance sheet are capitalized leases, which were added last fiscal year due to an accounting change. Substantially all of their lease obligations are for office real estate.


Sarah Kanwal

Equity Analyst, Director


Direct: 617.226.0022

Fax: 617.523.8118


Crestwood Advisors

One Liberty Square, Suite 500

Boston, MA 02109

www.crestwoodadvisors.com


$ACN.US

[tag ACN]

[category equity research]


ADBE 4Q Results

Current Price:   $475                  Price Target: $520 

Position Size:    2.7%                  TTM Performance: +61% since inception (3/18)


Key Takeaways:

·        Adobe reported Q4 results and guidance ahead of consensus

·       Increased their addressable market estimates showing long runway for growth with <10% penetration.

·        CEO Shantanu Narayen said…”everywhere we look, whether it’s entertainment, education or the enterprise, content is fueling the digital economy.”


Additional Highlights:

·         ADBE reported 4Q total revenue growth of 14%. EPS was $2.81 vs. consensus $2.64.  

·        Some quotes form the call: 
   o “even regulated industries that have traditionally been slower to embrace digital have certainly picked up the pace this year. We have industries like healthcare that are transforming whether it’s through personalized medicine, telehealth, and new ways to engage patients.”
   o “Digital is breaking longstanding barriers to access to education which is something great because it’s making it more accessible.” 
·        Their annual holiday report (powered by Adobe Analytics) predicts that online holiday spending will reach a $189 billion, which represents 33% year-over-year growth.
·        They updated TAM expectations to $147B in ’23, a 25% increase from last year’s $118B in ’22. FY21 guidance of $15B implies only ~10% penetration. That includes ~$85B for Digital Experience and ~$62B for Digital Media (~$41B for creative, ~$21B for document). 

·         Digital Media segment ($2.5B, +20% YoY; ~71% of revenue):

o   Comprised of Creative cloud (84% of segment revenue, +19% YoY) and Document Cloud (16% of segment revenue, +22% YoY).

o   Segment Annualized Recurring Revenue (“ARR”) grew to $10.2B exiting the quarter. With Creative ARR of ~$8.7 billion, and Document Cloud ARR of $1.5 billion.

o   Creative Cloud is benefiting from “exploding” content creation and consumption across phones, tables and desktops. 

o   Increasing focus on new and emerging content creation categories including 3D, Virtual Reality and Augmented Reality.

o   “In the workplace of the future, creativity is how people will thrive, and frankly keep their jobs as AI takes over more and more of these productivity focused roles.”

o   Document Cloud, w/ PDF and “Adobe Sign,” is key in the remote work environment as the imperative to translate paper processes to digital accelerates across the globe. 

·         Digital Experience segment (revenue was $819m, +10% YoY; ~29% of revenue):

o   Digital Experience subscription revenue was +14% YoY. Segment revenue includes: subscription revenue, professional services revenue, and “other”, which includes perpetual, OEM and support revenue.

o   Upsell opportunity w/ existing customer base – 93% of top 100 customers have three or more Experience Cloud solutions w/ an average ARR of $8 million, 3X what it was in 2015.

o   Should improve in FY2021 w/ an SMB recovery

o   Closed acquisition of Workfront – a leading work management solution for marketers. Paid $1.5B (~7–8x sales), reasonable  vs. the SaaS-industry at close to 17x.

·        2021 Guidance: Total revenue ~$15.2B +19% YoY slightly ahead of consensus +$14.8b). EPS guide of $11.20 in line w/ street.

·        Adobe is a rare company w/ >90% recurring revenue, double digit top line growth and ~40% FCF margins. Additionally, the headwinds from Covid (like lower global ad spending and weak SMB demand) should abate, while the accelerated secular tailwinds around digital transformation will persist.


Sarah Kanwal

Equity Analyst, Director


Direct: 617.226.0022

Fax: 617.523.8118


Crestwood Advisors

One Liberty Square, Suite 500

Boston, MA 02109

www.crestwoodadvisors.com


$ADBE.US

[tag ADBE]

[category earnings]


DIS up on Investor Day

Disney is up after holding an investor mtg yesterday after the close. The meeting was focused on their streaming services and they released updated long-term targets that were well ahead of expectations. Some key takeaways… 
  • As of Dec 2, Disney+ now has 87m subs (up from 74m at the end of the quarter they just reported) after only 1 year. Their original guidance when Disney+ was announced was for 60-90m subs by 2024. 
  • They now expect to achieve 230-260m Disney+ subs by 2024. This is well ahead of investor expectations that were closer to 165m. Netflix currently has <200m subs.
  • They plan to increase prices in the US and Europe by $1. 
  • They’re increasing content production plans. Now expect over 100 original titles per year – including 10 Star Wars series, 10 Marvel series, 15 Pixar series and 15 Pixar feature films. This will result in higher content costs.
  • Maintained their outlook for Disney+ to achieve profitability in F2024 given price increase and higher content costs.
  • Released details on Star outside of the US. 
  • They plan to continue releasing franchise films (e.g. Marvel) into theaters. 
  • They won’t move ESPN away from linear distribution as quickly as their other content.

Sarah Kanwal

Equity Analyst, Director


Direct: 617.226.0022

Fax: 617.523.8118


Crestwood Advisors

One Liberty Square, Suite 500

Boston, MA 02109

www.crestwoodadvisors.com


$DIS.US

[tag DIS]

[category equity research]

TJX Q3 Results

 
Current Price:   $62                        Price Target: $70

Position Size:    3.8%                      TTM Performance: 5%


Key takeaways:

·        Better than expected SSS drove revenue and EPS beat. They didn’t issue guidance for Q4. 

·         Home category continues to be the bright spot & they are adding e-commerce. They already have sites for TJ Maxx and Marshall’s, but now adding HomeGoods.com next year.

·         No guidance – but did see some weakening SSS trends in first two weeks of quarter. 

·         Seeing extremely plentiful inventory buying opportunities which bodes well for the future.

·         Re-instating and increasing dividend by 13%.


Additional Highlights:


·       All divisions saw sales above plan – home, beauty, and activewear businesses outperformed at Marmaxx, TJX Canada, and TJX International.

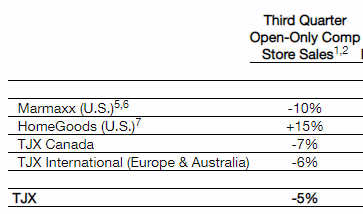
·      They were planning overall “open-only” SSS to be down -10% to -20%…street was at high end of this at -11%. They well surpassed this with overall open-only SSS down -5%.  HomeGoods was strongest at +15% and Marmaxx was weakest at -10%. Due to the temporary closing of stores from Covid, the historical definition of SSS is not applicable so they are temporarily reporting “open-only” SSS.  

·        Trends weakened slightly in the first two weeks of the quarter to down -7%. Overall open-only comp store sales were sluggish in August and improved significantly for the remainder of the quarter, with September being the strongest month, but then started to weaken in the last week of Oct. 

·        Slight margin contraction – Pre-tax margin down 70bps – very strong merchandise margin increase was more than offset by significant operating costs related to Covid and expense deleverage on the YoY sales decline.

·        Store closures with virus resurgence in Europe – 470 stores are temporarily closed due to local government mandates – the vast majority of these stores are in Europe.

·        Lighter inventory not due to availability – Inventories continue to be light due to a combination of factors, including lower planned store inventory levels, stronger than expected Q3 sales, and merchandise delivery delays due to continued bottlenecks in the supply chain, but merchandise flow to stores has improved since last quarter. 

·        Seeing extremely plentiful inventory buying opportunities which should benefit them in future quarters. Seeing new vendors across all categories reach out to do business w/ them. “Overall product availability in the marketplace remains excellent and the Company continues to shift its buying towards the categories that have had the strongest demand since reopening.

·       Adjusting inventories to align w/ current category demand trend – They are seeing softer demand for certain product categories given the number of people continuing to spend more time at home…“while we are emphasizing the high demand categories of Home, Beauty and Activewear, there is a limit to how much of our mix we would shift in the short-term to medium-term.” Ability to pivot has always been one of TJXs advantages. Centralized merchandising combined with high turns and constantly flowing goods to stores allows them to be nimble with inventory and respond to current trends. This has been a key part of their ability to drive LT positive SSS trends for decades. 

·       Their competition is suffering. Store closure leads to market share and real estate opportunities – better locations and lower rents. “Our relationships with vendors will grow even stronger as other retailers close stores.”

·       Long-term thesis intact – Relative to other brick-and-mortar focused retailers, TJX  continues to have a superior and very differentiated model. They acquire their inventory from an enormous (and growing) network of vendors, acting like a clearing mechanism for the retail industry…essentially opportunistically buying leftover/extra product that constantly flows from retailers, branded apparel companies etc. Growth of e-commerce has led to better inventory opportunities/ selection, not worse. They leverage their massive store footprint and centralized buying to merchandise their stores w/ current on-trend product. No one else does this at the scale they do. They have very quick inventory turns and can be nimble and re-active w/ their inventory buys and are an important partner to their sources of inventory. It’s a powerful model that continues to take share and, while they have a growing e-commerce business too, their store model has been very resistant to e-commerce encroachment. Moreover, they have a thriving Home business and a growing international store footprint and a track record of steadily positive SSS. Prior to this year, in their 43 year history they only had 1 year of negative SSS (this is unheard of!). So, with steadily positive SSS and a slowly growing store footprint, TJX steadily grows their topline w/ consistent margins that are about double that of department stores.

·         Resumed and increased dividend. Generated $4.1 billion of operating cash flow and ended the quarter with $10.6 billion of cash. Announced a cash tender offer for up to $750 million aggregate for certain bonds issued in April – looking to lower borrowing costs by reducing the outstanding amount of higher interest rate longer-dated bonds and simultaneously issuing lower interest rate 7 to 10 yr. bonds to fund the tender offer.

·         Valuation: Balance sheet remains strong. The stock has recovered from troughs and is up slightly YTD. Valuation reasonable at almost a 4% FCF yield on 2019.


Sarah Kanwal

Equity Analyst, Director


Direct: 617.226.0022

Fax: 617.523.8118


Crestwood Advisors

One Liberty Square, Suite 500

Boston, MA 02109

www.crestwoodadvisors.com


$TJX.US

[tag TJX]

[category earnings]


Home Depot to Buy Former Unit HD Supply in $9.1 Billion Deal

Home Depot announced they are acquiring HD Supply, a leading national distributor of maintenance, repair and operations products in the multifamily and hospitality end markets. The company was previously a subsidiary of HD. This would expand their exposure to Pro customers, which is now ~45% of sales and a key area of growth for them. Sales trends among pros continue to improve and may accelerate in 2021.  


Home Depot to Buy Former Unit HD Supply in $9.1 Billion Deal (1)
2020-11-16 14:16:44.281 GMT

By Richard Clough
(Bloomberg) — Home Depot Inc. agreed to buy building
products distributor HD Supply Holdings Inc., reuniting the
home-improvement retailer with its former subsidiary more than a
decade after they split apart.
Home Depot will buy all outstanding shares for about $56
apiece, according to a statement Monday, representing a premium
of about 25% over HD Supply’s closing price on Friday. With 162
million shares outstanding, the offer is valued at almost $9.1
billion. Including net cash, the deal has an enterprise value of
about $8 billion, the companies said.
The acquisition brings back together two companies that
used to be under the same roof and will give Home Depot more
exposure to the professional contractor side of the business.
Like do-it-yourself repairs, that segment has boomed during the
pandemic as Americans want to improve the homes they’re spending
more time in.
Shares of HD Supply jumped as much as 29% before regular
trading in New York, and Home Depot increased less than 1%. HD
Supply was up 11% through Friday’s close, while Home Depot rose
27% over that span.
One of the largest industrial distributors in North
America, HD Supply provides everything from bleach, to doors and
ceramic tile to about 500,000 customers from 270 branches and 44
distribution centers, according to its annual report.
HD Supply is “a good business with solid margins,” Chuck
Grom, an analyst with Gordon Haskett, said in a note. The
company has faced underinvestment in recent years, giving the
buyer the opportunity to improve the business, he said. The tie-
up could add as much as 33 cents a share to Home Depot’s
earnings, Grom added.
The deal adds to the momentum for Home Depot, which along
with rival Lowes Cos. was deemed an essential retailer early in
the pandemic and remained open even as many stores shut down for
months. The HD Supply transaction, to be funded by cash on hand
and debt, is expected to be completed in Home Depot’s fiscal
fourth quarter, which ends Jan. 31.

Professional Sales

Professional customers currently account for about 45% of
Home Depot’s sales, and HD Supply could help it cement its
leadership position, said Drew Reading, an analyst with
Bloomberg Intelligence. “Though HD Supply has exposure to slower
growth commercial end-markets, sales trends among pros continue
to improve and may accelerate in 2021.”
Home Depot sold the construction-supply unit to a group of
buyout firms — Carlyle Group LP, Bain Capital LLC and Clayton,
Dubilier & Rice LLC — in 2007. That deal was initially valued
at $10.3 billion including debt, but in the midst of the housing
crash, it was scaled back to $8.5 billion. The chain then went
public in 2013.
Monday’s announcement comes about a week after Bloomberg
News reported that Lowe’s had recently approached HD Supply and
that the companies were in preliminary talks, citing people
familiar with the matter at the time. The report also said it
was unclear whether there were discussions with other suitors.
Lowe’s subsequently said it isn’t in talks and doesn’t plan to
pursue a transaction.

–With assistance from Gerald Porter Jr. and Matt Townsend.

To contact the reporter on this story:
Richard Clough in New York at rclough9@bloomberg.net
To contact the editors responsible for this story:
Anne Riley Moffat at ariley17@bloomberg.net
Richard Clough

To view this story in Bloomberg click here:
https://blinks.bloomberg.com/news/stories/QJW5R6DWX2PZ

$HD.US

[category earnings ]

[tag HD]

Disney Q4 Results

Current Price: $138         Price Target: $165

Position size: 1.5%          TTM Performance: -4%             


Key Takeaways:

  • Beat on revenue and EPS.
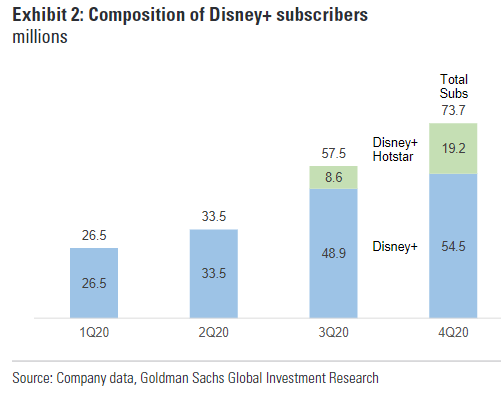
  • Strong Disney+ performance continues – Disney+ continues to ramp better than expected w/ 73.7m subs above expectations of 65m.
  • Accelerating transition to DTC first company – key driver of LT value for the company. Investor Day in early Dec will be devoted to this transition.
  • Dividend still suspended, but plan for it to resume – This comes despite the investor letter from Third Point suggesting they permanently suspend it and channel that cash towards content. Leverage is still up, aiming to return to leverage levels consistent with single A credit rating.


Additional Highlights:

  • Revenue was $14.7B vs $14.2B expected. Despite revenue down 23% YoY, driven largely by an 61% YoY drop in Parks segment revenue, Disney managed to post positive op income and FCF for the quarter. Adj. op income was $393m vs expectations of about -$1B loss.
  • Financial results continued to reflect significant impacts from COVID-19 which adversely impacted segment op income by $3.1B. Parks, Experiences and Products segment was again the most severely affected with an estimated adverse impact of $2.4B in Q4.
  • Segment re-alignment – Previously announced new segment reporting starts next quarter. This will essentially put all of their content creation together in a segment called “Media and Entertainment” and separate it from distribution. Currently, Studio, streaming and cable were in separate segments. The change separates optimal distribution decisions from the type of content made. This underscores a growing focus on streaming vs studio reliance and seems to suggest more movies going directly to streaming to drive subscriber growth. 
  • Overall, a very encouraging and upbeat call with an upcoming investor day in the coming months that mgmt. seemed very positive about. They will update Disney+ profitability guidance given it’s tracking way ahead of original targets. Additionally, the long-term speculation has been for a DTC model for ESPN – so this could be a potential topic.
  • Media:
    • Media Networks revenues for the quarter increased 11% to $7.2 billion, and segment operating income increased 5% to $1.8 billion. Op income was up in Q3 due to higher results at both Broadcasting, partially offset by lower results at cable networks.
    • At Broadcasting, the increase in op income was primarily due to affiliate revenue growth and lower programming, production and marketing costs. The decrease in programming and production costs was largely driven by COVID-19 related shutdowns, the shift of college football games to fiscal 2021 and a delay in airing new season premieres. Lower results at cable networks were driven by decreases at ESPN, partially offset by increases at FX Networks and the domestic Disney channels.
    • ESPN results were lower as affiliate and advertising revenue growth were more than offset by higher programming and production costs.
  • Parks, Experiences and Products:
    • Segment revenues decreased 61% to $2.6B, and segment op income decreased $2.4B YoY to a loss of $1B.
    • “We’re very pleased with the dynamics we’re seeing at parks across the globe.” WDW was at 25% capacity…now at 35% capacity. 
    • Virus resurgence continues to drive closures – Paris re-closed recently. California still closed. Shanghai open for the full quarter. Hong Kong open for part of the quarter.
    • All resorts operating at significantly reduced capacity. Walt Disney World, Shanghai Disney Resort and Hong Kong Disneyland all achieved a net positive contribution in  Q4, which means they generated revenue that exceeded the variable costs associated with reopening.
    • Positive demand signs – Walt Disney World already booked at 77% capacity for Q1. Thanksgiving week almost booked to capacity. In other words, there are some heavy fixed costs, but it pays to have them open despite really limited capacity.
  • DTC:
    • Revenues were +42% with an operating loss of $580m- an improvement of approximately $170m compared to the prior year. This improvement was driven by higher results at Hulu and ESPN+ partially offset by costs associated with the ongoing rollout of Disney+ and a decrease at our international channels. The improvement at Hulu was due to both subscriber and advertising revenue growth, partially offset by higher programming/production costs. The improvement at ESPN+ was due to subscriber growth and increased pay-per-view income from UFC events.
    • Between Disney+, ESPN+, Hulu they now have >120m paying subs. ESPN+ subs were ahead of expectations at 10.3m vs consensus 9.1m. Hulu came in slightly below at 36.6m vs consensus 37.5m. Disney+ was 73.7m vs consensus 65m.
    • Disney+ ahead of 5 yr. target after only 1yr. – 60m subs at Disney+ was originally targeted for 2024, so they hit their 5 year target in about 8.5 months. And said they’re ahead of expectations in every geo, with big launches still ahead. India plus Indonesia are ~25% of subs. ARPU is $4.52, or $5.30 ex-India. This is basically unchanged from last quarter. They will give updated subscriber targets at their Investor Day in December. 
    • Global rollout driving sub growth – Now in more than 20 countries worldwide. They launched Disney+ in the Nordics, Belgium, Luxembourg and Portugal in September, and in Latin America this November. Rolled out Disney+ Hotstar on September 5 in Indonesia, one of the world’s most populous countries. Disney+ will launch in Brazil, Mexico, Chile, and Argentina on November 17. By year-end, Disney+ will be available in 9 of the top 10 economies in the world.
  • Studio:
    • Studio Entertainment revenues for the quarter decreased 52% to $1.6 billion and segment operating income decreased 61% to $419 million. The decrease in operating income was due to lower theatrical and home entertainment results.  Worldwide theatrical results continued to be adversely impacted by COVID-19 as theaters were closed in many key markets, both domestically and internationally, and no significant worldwide theatrical releases in the quarter.
    • Production was heavily impacted by Covid except w/ animation which was uninterrupted. They’re finally re-starting production for live action films and television.
    • Over time number of films and quality of content. New content adds subscribers. Increased pace in investment on content should be a focus at Investor Day.


Sarah Kanwal

Equity Analyst, Director


Direct: 617.226.0022

Fax: 617.523.8118


Crestwood Advisors

One Liberty Square, Suite 500

Boston, MA 02109

www.crestwoodadvisors.com


$DIS.US

[category earnings ]

[tag DIS]


Themes & Focus List Stocks: Artificial Intelligence

Going forward we thought it might be helpful to share some insights on how certain themes are present in our portfolio. This week I’m sharing an example of how the theme of Artificial Intelligence is present in our portfolio…
Black Knight’s AIVA Product: AIVA (AI Virtual Assistant) is BKI’s AI technology that can help clients automate what is still a very paper intensive origination process. Mortgage originations are expensive and getting more expensive partly because they are so labor intensive. AIVA is powered by machine learning and performs manual, repetitive tasks at scale. This helps clients reduce operating costs for this time-consuming process. AIVA mimics cognitive thinking to read, comprehend and draw conclusions. “She” is able to remember patterns within data the same way humans recall what they have learned on the job. Loan applications contain hundreds of data points from various document types, including PDFs, screenshots, TIFFs of things like W2’s and paystubs.  The documents need to be verified, classified and entered into an origination system. Mortgage professionals are tasked with doing this under tight deadlines. AIVA can read, analyze and extract the data. It then creates queues of documents for a processor to scan and make corrections. In doing this, each new set of origination documents serves as training data, making AIVA “smarter” and more efficientBKI says it reduces a 95 minute process to a 5 minute process. By performing error-prone, manual tasks, AIVA enables employees to focus on projects with greater strategic value, such as addressing exceptions and solving problems, which results in improved transaction turn times as well as reduced risk. As AIVA helps accelerate and streamline processes, lenders benefit from reduced expenses, which is key as loan origination costs hit new highs, pressuring net profits for lenders.

Sarah Kanwal

Equity Analyst, Director


Direct: 617.226.0022

Fax: 617.523.8118


Crestwood Advisors

One Liberty Square, Suite 500

Boston, MA 02109

www.crestwoodadvisors.com

$BKI.US

[category themes]

[tag BKI]

CSCO Q1 2021 Results

Current Price: $41                           Price Target: $58 

Position size: 2.8%                          TTM Performance: -9%


Key Takeaways:

·         Top line and EPS beat with better-than-expected guidance.

·         Upbeat guidance suggests macro environment showing signs of improvement. Aging network infrastructure needs to be upgraded. Growing use of new technologies and increased data demand places increased importance on this.

·         Mix shift to software and recurring revenue should continue as an increasing number of their products are to be offered this way.

·         Cost cutting to help preserve earnings power –  $1B in annual cost reductions to be implemented over next few quarters.

·         CEO Chuck Robbins said“Cisco is off to a solid start in fiscal 2021 and we are encouraged by the signs of improvement in our business as we continue to navigate the pandemic and other macro uncertainties.”


Additional Highlights:  

·       Overall, business trends are weak but improving, they are lapping easy compares this coming year amidst some aggressive cost-cutting initiatives, transition to software/subscription continues, valuation is inexpensive, and they have a high dividend yield (3.5%) that’s easily covered. 

·        Q1 sales -9% YoY and EPS -10%. Q2 revenue guided to 0% to -2%. Street was expecting -3.5%.

·       New CFO announced – Scott Heron (was Autodesk CFO) , he will replace Kelly Kramer whose retirement was announced last quarter. He has a background in software and helped to lead Autodesk’s successful business model transformation from perpetual licenses to subscription software.

·       Improved demand commentary relative to last quarter…

·       By product – Soft demand w/ campus/DC switching, routing, servers, and WLAN still offsetting positive Webex, security, Cat9K, WiFi-6  trends, but order patterns are improving.

·       By end market – Positively, order patterns in public sector were solid while headwinds w/ commercial/enterprise are set to subside. Saw a pretty significant improvement in commercial orders -they were minus 23% last quarter in the midst of a “SMB meltdown,” that improved to -8% this quarter.

·       As I mentioned last quarter, Gartner expects global IT spending to decline -7% in 2020. Within this there are pockets of strength, like public cloud spending as companies shift IT budgets to areas of immediate need. For much of Cisco’s products the needs are less immediate, but the LT drivers still exist. Management talked about this dynamic on the call. “We had customers who are super-focused on getting their employees working from home productively and getting their security set up. I think everyone raced to do that and then I think they took a pause, which is what we felt in our last quarter in orders. And then I think they re-prioritized what they were going to be spending money on and I think we started seeing some of that come back and it’s sort of exactly what I expected, but we needed to see it and we’ll see if it continues. But we’re all dealing with the same macro environment.”

·        Positive commentary points to continued software/services mix shift and strength in new products –This includes strong demand for their Catalyst 9000, security, WebEx and other SaaS-based solutions. Software mix is close to 1/3 of revenue, w/ 78% of software sold as subscription. That means almost 1/4 of total sales is from software subscriptions sales (or close to $12B). Additionally, 27% of rev is services with much of that from maintenance/support which tend to be recurring. So overall recurring revenue could be 40% or more (they don’t break it out specifically). So while top line growth has been weak, the mix shift happening w/in their business should be supportive of their multiple and their margins. They intend to grow this mix over time.

·        Momentum w/ web-scale cloud providers – the positive commentary from last couple quarters continued. This is an end market where they lost share to Arista in the past, but their positioning is improving w/ new products announced last Dec. That being said, this is still early stages – mgmt. indicated it may take a year or two for this to be a meaningful top line contributor.

·        Valuation: trading at almost an 8% FCF yield on fiscal 2021, which ends in July. This is well below S&P average of <4%, for a strong balance sheet, high FCF generative business w/ a growing mix of software and recurring revenue. Despite macro headwinds, fundamentals continue to be supported by business transformation/digitization trends at a reasonable valuation while much else in tech has seen substantial multiple expansion. Additionally, their valuation is supported by a 3.5% dividend yield which they easily cover. They have ~$15B in net cash on their balance sheet, or almost 9% of their market cap.


Sarah Kanwal

Equity Analyst, Director


Direct: 617.226.0022

Fax: 617.523.8118


Crestwood Advisors

One Liberty Square, Suite 500

Boston, MA 02109

www.crestwoodadvisors.com


$CSCO.US

[category earnings ]

[tag CSCO]

Black Knight 3Q20 Earnings

Current Price: $90           Price Target: $96 (raised from $85)

Position Size: 2.6%          TTM Performance: 53%


Key Takeaways:


·       Better than expected revenue and EPS. Guidance raised above street. Exceeded expectations on higher origination volumes and continued improvement in data and analytics sales.

·       Lower foreclosures is a headwind: as they indicated last quarter, they are seeing lower foreclosure-related volumes in their Specialty Servicing software business due to the foreclosure moratorium.

·       Data & Analytics accelerated (+27% YoY): Seeing continued improvement with cross-selling Data & Analytics (~15% of revenue), which could be a solid future growth driver for them.


Additional Highlights:

·        Q4 Revenues were $312m, +4.5% and adj. EPS was +7%.

·        Housing data points: low rates, improved affordability and low inventory continue to put upward pressure on home prices, with the median home price rising by 14.2% in September. This is up from an 11.5% increase in August, the highest annual home price growth rate in more than 15 years. This is benefiting origination volumes. Estimated origination volumes based on underlying locks suggest Q3 refinance and total originations could be up 25% or more from Q2, while purchase lending could be up by 35% or more. This would push 2020 purchase lending to its highest level since 2005 and both refinance lending and total origination volumes to their highest levels ever, with total lending on pace to easily eclipse the $4 trillion threshold for the first time on record.
·      Foreclosure moratorium: For homeowners with mortgages backed by government-sponsored enterprises Fannie Mae or Freddie Mac, the Federal Housing Finance Agency, the moratorium is set to expire at the end of the year. GSEs and other government loans cover about 70% of all mortgages. The other 30% of homeowners w/ private mortgages are not protected under federal law – some banks are following federal guidelines, but only legally obligated to stop foreclosures in a handful states.

·       Their stake in D&B is now worth $1.4B w/ the recent IPO. They invested just under $500m in their D&B stake ~1 year ago giving them a pre-tax unrealized gain of ~$900m.

·       Closed acquisitions of Optimal Blue (enhance their origination and Data & Analytics businesses) and DocVerify (supports e-notarization and remote online notarization).  Optimal Blue is, 80% recurring revenue, accretive to their overall organic growth rate and aided their guidance improvement.

·       Data analytics segment (~15% of revenue) revenues were up 27%, an acceleration from 21% last quarter. Driven by growth in their property data and portfolio analytics businesses.

o   EBITDA margin +940bps YoY.

o   Trending ahead of LT targets in recent quarters on strong cross-sales related to new client deals, as well as renewals. They continue to see promising momentum in this business.

o   Current situation is highlighting their unique data sets and analytics. They are the only company with real-time visibility into the majority of active mortgage loans in the US. This is helping w/ loan origination despite social distancing. They’ve seen significant interest in and adoption of their expedite e-close and e-sign solutions as well as their loss mitigation solution since the beginning of the pandemic.

·        Software Solutions segment (~85% of revenue) down +1%.

o   Within this segment servicing (~70% of revenue) was down -4% driven by lower foreclosure related volumes due to the foreclosure moratorium as part of the CARES Act. The year-over-year performance improved from2Q as a result of the Bank of America conversion and the anniversary of headwinds from a client de-conversion.

o   They continue to dominate first lien loans with leading share and are growing share in second lien loans. Market share for first mortgages is >60%.

o   Year-to-date, signed five new MSP clients, representing over 750,000 loans.

o   Originations (~16% of total revs) made up of new loans and refi’s – revenues increased 20% in Q2 – Volumes were stronger than expected. Lower rates help this business. Growth driven by new clients, a tuck-in acquisition, as well as higher refinanced volumes in their Exchange and e-Lending businesses.

o   Segment EBITDA margin down 110bps YoY.

·         Raised full year 2020 outlook:

o   Revenues of $1,229 million to $1,235 million (raised from $1,170 million to $1,184 million). 

o   Adj. EPS of $2.03 to $2.07 (previously $1.94 to $1.99), street at $1.93

o   Adj. EBITDA of $603 million to $608 million (previously $572 million to $583 million)

Valuation:

·         Trading at <3% FCF yield on 2021 –valuation is getting more expensive but supported by growth potential, strong ROIC with a recurring, predictable revenue model (>90% recurring revenue) and high FCF margins, which is aided by high incremental margins and capex which should taper as they grow.

·         $2.3B in net debt – that puts their leverage ratio at 3.6x. Increased from <2x with recent acquisitions.

·         Capital allocation priorities include debt pay down, opportunistic share repurchases and acquisitions.

Thesis:

  • Black Knight is an industry leader with leading market share of the mortgage servicing industry. 
  • Stable business with >90% recurring revenues, long-term contracts and high switching costs.
  • BKI has high returns on capital and high cash flow margins.


.UA

[tag BKI}

[category earnings]

Sarah Kanwal

Equity Analyst, Director


Direct: 617.226.0022

Fax: 617.523.8118


Crestwood Advisors

One Liberty Square, Suite 500

Boston, MA 02109

www.crestwoodadvisors.com


$BKI.US

[category earnings]

[tag BKI]


BKNG 3Q Results

Current Price: $1,783      Target price: $2,400

Position Size: 1.8%          TTM Performance: -12%


Key Takeaways:

·       Beat on revenue, missed on EPS.

·       Demand improved throughout Q3, but weakened meaningfully beginning in October w/ Covid resurgence in Europe. Strongest trends were w/ domestic driving travel and alternative accommodations (e.g. home rentals). Alternative accommodations were 1/3 of booked room nights.

·       Cost cutting continues which should aid margins when demand environment improves.

·       Weak environment strengthens their position w/ suppliers as they are a key source of demand. Demand mix shift away from business towards leisure benefits BKNG’s leisure focus.


Additional Highlights:


·       CEO said Q3 benefited greatly from some lifting of government lock-downs and the release of pent-up demand created by the almost complete cessation of travel during parts of Q2.  However, COVID-19 case counts are now rising steeply in many parts of the world with corresponding increases in lock-downs and re-imposed travel restrictions that will continue to impact travel in the near-term.
·      Revenues for Q3 were $2.6B (-48% YoY) vs $2.5B consensus. While they missed on EPS, there were some adjustments including an unrealized gain on marketable securities and an impairment charge for OpenTable and Kayak goodwill. 
·       Q3 bookings were $13.4B (-47% YoY vs. -91% in Q2), slightly below consensus. 
·        Improving trends in Q3 – Room nights declined -43% YoY and ADRs declined -8% YoY ex-FX. This is an improvement from Q2 when room nights booked were down 87% YoY. They saw a surge in demand when travel restrictions and stay-at-home orders eased. 
·        Weakening results in Q4 w/ resurgence in outbreaks – The YoY decline in reported room nights was relatively consistent each month of Q3, as the steady improvement in global trends that they saw from April through July, flattened out in August and September. In October reported room nights declined by about 58% compared to October 2019. And over the last 7 days through yesterday, declined by about 70%. Worsening result is driven by increased virus infections and certain governments re-imposing public health-related restrictions. 
·       Weak guidance“Given the trends we are currently seeing, we believe that year-over-year room night declines will be greater in Q4 than what we observed in October. If this turns out to be the case, it will be very challenging for us to reach profitability in Q4.”

·       Strength in domestic travelbooking trends were primarily driven by domestic travel with international trends seeing much more limited improvement. Domestic business benefiting from prohibitions/restrictions on international travel, which forces consumers who want a holiday to travel domestically. Note that “domestic” is just intra-country, so travel between countries w/in Europe is international.

·       Connected trip is a long-term growth driver – The long-term vision for them continues to be the “connected trip.” The idea is to be a platform for not just hotel, but a portal for all aspects of travel including flights, activities, restaurants etc. A key part of this is building up the “supply” (e.g. tour operators). The current environment could be a catalyst for supply as weaker travel trends spur suppliers to look to Booking as a necessary source of demand. They continue to invest behind this despite the current environment including their payment platform which enables payment to companies like tour operators through their platform. They recently announced the launch of flights on Booking.com in the US.

·        Cost cutting and improved marketing efficiency likely to lead to profitability recovering before top line does. Big headcount reductions with more to come. Also cutting marketing expense which is the biggest part of their cost structure – typically ~30% of rev. This is an important lever for cutting costs. As direct traffic grows as a % of bookings (over 50% now and increasing), this is an area where margins can structurally improve over time.

·       Regulatory Risk – New regulatory framework that the European Commission is working on (Digital Services Act)  will focus on “gatekeepers.” The focus is on big tech platforms – BKNG could potentially be included in this. The implications are not yet clear. BKNG feels designating them as a gatekeeper would be a mistake as they do not have the dominant market share of other “gatekeepers” like Google. BKNG puts their market share of bookable room nights in Europe at 11%. 

·       Stock is cheap and expectations are reasonable. Trading at almost a 5% yield on 2021. Consensus is for revenue not to recover to 2019 baseline until 2023. Consistent w/ mgmt. commentary that it will be years and not quarters before the travel market returns to pre-COVID volumes.


Sarah Kanwal

Equity Analyst, Director


Direct: 617.226.0022

Fax: 617.523.8118


Crestwood Advisors

One Liberty Square, Suite 500

Boston, MA 02109

www.crestwoodadvisors.com


$BKNG.US

[category earnings ]

[tag BKNG]