Research Blog – INTERNAL USE ONLY

FIQSX – Q1 2021 Commentary

FIQSX Commentary – Q1 2021

Thesis

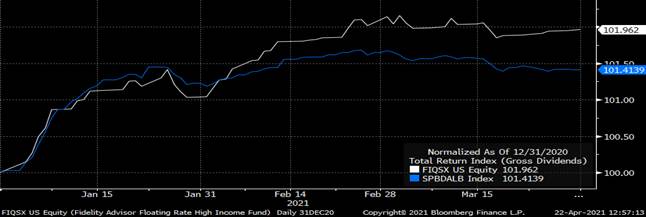
FIQSX (currently yielding 3.07%) is a large floating rate fund that has a strong historical returns and a tenured management team. By investing purely in senior bank loans, FIQSX further increases our potential upside gain, reduces our duration-risk, and decreases our interest rate risk. We like that the fund utilizes a bottom-up investment process through proprietary framework analysis, avoids high-yield corporate bonds, and allocates to relatively higher-rated securities within the floating rate security space.


[more]


Overview

In the first quarter of 2021, FIQSX outperformed the benchmark (S&P/LSTA Leveraged Loan Index) by 22bps primarily due to a 2% stake in stocks of loan issuers that occurred because of company restructuring and negotiations. Security selection in oil & gas also contributed to performance. Overall exposure to bank loans, a small allocation to high yield credit, and selection in radio & television detracted from returns.


Q1 2021 Summary

  • FIQSX returned 2.09%, while the Leveraged Loan Index returned 1.87%
  • Quarter-end effective duration for FIQSX was 0.16 and 0.11 for the Leveraged Loan Index
  • Largest contributors
    • Chesapeake Energy – out-of-benchmark position in oil & gas
    • Denbury – out-of-benchmark position in oil & gas
  • Largest detractors
    • Sinclair Broadcast Group – overweight in TV broadcaster
    • Not owning loans from movie theater operator AMC Entertainment


Optimistic Outlook

  • We hold this fund due to its relatively high yield and shorter duration, especially as we believe that rates will increase in the coming years
  • Positive outlook as vaccinations continue to roll out, yet BB and B rated loans are moving closer to par
  • The team will continue to search for opportunities in the loan space, even as BB and B-rated securities have approached par
    • Continue to consolidate positions and reduce the number of holdings
    • Remain overweight to BBB & above and BB, and underweight in B and CCC rated securities


[Category Mutual Fund Commentary]


Micah Weinstein

Research Analyst


Direct: 617.226.0032

Fax: 617.523.8118


Crestwood Advisors

One Liberty Square

Suite 500

Boston, MA 02109

www.crestwoodadvisors.com


EIBLX – Q1 2021 Commentary

EIBLX Commentary – Q1 2021

Thesis

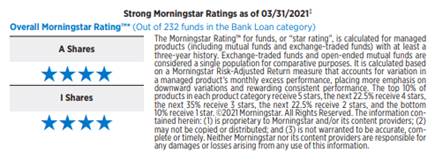
EIBLX (currently yielding 2.89%) is a large floating rate fund that has a strong historical returns and a tenured management team. By investing purely in senior bank loans, EIBLX further increases our potential upside gain, reduces our duration-risk, and decreases our interest rate risk. We like that the fund utilizes a bottom-up investment process through proprietary framework analysis, avoids high-yield corporate bonds, and allocates to relatively higher-rated securities within the floating rate security space.


[more]


Overview

In the first quarter of 2021, EIBLX underperformed the benchmark (S&P/LSTA Leveraged Loan Index) by 38bps primarily due to the fund’s overweight positions in a facilities management company and energy-related holding. Additionally, performance lagged the comparable index due to the fund’s slightly higher-quality, specifically an underweight to the CCC-rated tier and second-lien loans. Overweight allocations to financial intermediaries and cable & satellite television segments detracted from returns, yet the fund’s underweight to utilities contributed to performance. A recent allocation to CLOs and the fund’s positions in media, home furnishings borrowers, and specialty drug maker also helped offset some of the lagging exposures.


Q1 2021 Summary

  • EIBLX returned 1.40%, while the Leveraged Loan Index returned 1.78%
  • Quarter-end effective duration for EIBLX was 0.26 and 0.11 for the Leveraged Loan Index
  • Three largest contributors
    • Underweight to ION Media Networks Inc, Serta Simmons Bedding LLC, Mallinckrodt International
  • Three largest detractors
    • Underweight to IAP Worldwide Services Inc, Ameriforge Group Inc, David’s Bridal Inc


Optimistic Outlook

  • We hold this fund due to its relatively high yield and shorter duration, especially as we believe that rates will increase in the coming years
  • Massive stimulus, an accommodative set of monetary policies, and continued rollout of vaccines provide a positive backdrop for the asset class
  • Default rates continue to decline giving a favorable outlook, yet loan valuations look to be fairly and fully priced


[Category Mutual Fund Commentary]


Micah Weinstein

Research Analyst


Direct: 617.226.0032

Fax: 617.523.8118


Crestwood Advisors

One Liberty Square

Suite 500

Boston, MA 02109
www.crestwoodadvisors.com


WATFX – Q1 2021 Commentary

WATFX Commentary – Q1 2021

Thesis

WATFX (currently yielding 1.80%) is an actively managed fund that finds overlooked areas of the market that can go against consensus views and add value. Through internal macro, credit, and fundamental research WATFX identifies undervalued securities and takes on more credit exposure to generate alpha over time. Through a diversified approach to interest rate duration, yield curve, sector allocation, and security selection, the fund dampens exposure to volatility.


[more]


Overview

In the first quarter of 2021, WATFX underperformed the benchmark (Barclays U.S. AGG) by 58bps largely due to the fund’s duration and yield-curve positioning. US Treasury yields increased during the quarter which detracted from overall performance as the fund holds longer duration bonds compared to its benchmark. Corporate credit spreads tightened, and high-yield credit outperformed during the quarter. USD-denominated EM debt tightened while EM local rates increased – the USD strengthened compared to developed and emerging market currencies.


Q1 2021 Summary

  • WATFX returned -3.95%, while the U.S. AGG returned -3.37%
  • Quarter-end effective duration for WATFX was 7.17 and 6.40 for the U.S. AGG
  • Continued to trim TIPS exposure as breakeven inflation rates exceeded pre-pandemic levels
  • Increased allocated to agency MBS, NARMBS, and CMBS based on attractive valuations


Outlook

  • We continue to hold this fund and believe in our thesis due to the fund’s diverse approach and strong top down-bottom up fundamental value investing over the long-term
  • Positioned to benefit as global recovery continues, but remain diversified due to suspected long-term challenges during the recovery
  • Expect spread products to outperform sovereign products as the world economy reopens, yet remain cautious around the length it may take for all markets to fully recover
  • The fund expects central banks to continue to be accommodative for the foreseeable future
  • The fund is excited to seek out opportunities as spreads widen and the Fed continues to support corporate credit markets


[Category Mutual Fund Commentary]


Micah Weinstein

Research Analyst


Direct: 617.226.0032

Fax: 617.523.8118


Crestwood Advisors

One Liberty Square

Suite 500

Boston, MA 02109

www.crestwoodadvisors.com


TCPNX – Q1 2021 Commentary

TCPNX Commentary – Q1 2021

Thesis

TCPNX (currently yielding 1.39%) is a smaller fund that does not have as many assets under management compared to our other core mangers, enabling them to make more nimble and tactical decisions. By making small allocations to undervalued “riskier” asset classes (high-yield and non-dollar denominated debt), TCPNX diversifies our fixed income portfolio and generates superior returns to the benchmark (Barclays U.S. AGG). We like that the fund utilizes a bottom-up investment process through proprietary framework analysis, fundamental security review, and portfolio risk management.


[more]


Overview

In the first quarter of 2021, TCPNX outperformed the benchmark (Barclays U.S. AGG) by 45bps primarily due to the fund’s lower duration, curve neutral strategy, and general tightening in spread products. An overweight to spread sectors contributed to returns, specifically the allocation to Agency Multi-Family and Agency Single-Family MBS securities. U.S. Agencies also benefitted the portfolio, yet a preference for steadier issuers within credit detracted from overall returns. Lower rated and longer credit produced relatively larger returns which was a headwind for the fund this quarter.


Q1 2021 Summary

  • TCPNX returned -2.92%, while the U.S. AGG returned -3.37%
  • Quarter-end effective duration for TCPNX was 5.62 and 6.40 for the U.S. AGG
  • Three largest contributors
    • Airline EETC, SBA DCPC, Royal Caribbean
  • The top detractors
    • Long Credit, Treasury STRIPS, Verizon


Optimistic Outlook

  • We continue to hold this fund and believe in our thesis due to the fund’s consistent and defensive approach that we expect to generate alpha through times of low volatility
  • Rising rates will continue to benefit the portfolio
    • Convexity advantage, premium resistance within the portfolio will weaken, tightening spreads
  • Continue to maintain a duration neutral portfolio, with a focus on investment grade credit and Agency Single Family MBS debt as they are well priced


[Category Mutual Fund Commentary]


Micah Weinstein

Research Analyst


Direct: 617.226.0032

Fax: 617.523.8118


Crestwood Advisors

One Liberty Square

Suite 500

Boston, MA 02109

www.crestwoodadvisors.com


MWTIX – Q1 2021 Commentary

MWTIX Commentary – Q1 2021

Thesis

MWTIX (currently yielding 1.16%) is an actively managed fund that provides a sector-based strategy while still maintaining fundamental research driven through issue selection. When compared to the benchmark (Barclays U.S. AGG), the holdings have similar duration and exposure, yet selection is focused around areas where other managers are not looking. Through sector rotation and active weighting, we expect MWTIX to generate alpha over time.


[more]


Overview

In the first quarter of 2021, MWTIX outperformed the benchmark (Barclays U.S. AGG) by 46bps, largely due to the fund’s positioning to have a shorter duration than the index. Issue selection among corporate credit also contributed to performance, yet the underweight to the sector was a drag on performance. Overweights to healthcare and communications, as well as an allocation to high yield corporates also helped boost returns. A Municipal debt overweight contributed due to yield premiums, while securitized products were mixed: agency MBS detracted while non-agency MBS and FFELP student loan ABS contributed to returns.


Q1 2021 Summary

  • MWTIX returned -2.91%, while the U.S. AGG returned -3.37%
  • Quarter-end effective duration for MWTIX was 6.35 and 6.40 for the U.S. AGG
  • Strategy has returned to a more defensive and liquid one due to historically tight spreads and continued risks


Outlook

  • We continue to hold this fund and believe in our thesis due to the fund’s defensive approach and minimal exposure to more vulnerable issuers and industries
  • Opportunities
    • Securitized – current coupon agency MBS TBAs, legacy non-agency MBS, AA and A-rated CMBS
    • EM debt
    • CLOs
  • MWTIX has positioned itself to take advantage of relatively attractive prices during times of high volatility to generate strong returns


[Category Mutual Fund Commentary]


Micah Weinstein

Research Analyst


Direct: 617.226.0032

Fax: 617.523.8118


Crestwood Advisors

One Liberty Square

Suite 500

Boston, MA 02109

www.crestwoodadvisors.com


DBLTX Commentary – Q1 2021

DBLTX Commentary – Q1 2021

Thesis

DBLTX (currently yielding 3.15%) utilizes a top down-bottom up process that focuses on MBS and Agency bonds. When compared to the benchmark (Barclays U.S. AGG), the holdings have lower duration and exposure to corporate bonds, reducing their sensitivity to interest rate movements and credit spreads. We expect attractive risk-adjusted return characteristics over the long term from DBLTX, especially during periods when corporate bonds’ spread increase and the yield curve steepens.


[more]


Overview

In the first quarter of 2021, DBLTX outperformed the benchmark (Barclays U.S. AGG) by 186bps, largely due to shorter duration positioning the fund maintained compared to the index. Securitized credit sectors such as non-Agency MBS and non-Agency CMBS were the largest contributors to overall performance. Agency MBS was the only sector that detracted from returns.


Q1 2021 Summary

  • DBLTX returned -1.51%, while the U.S. AGG returned -3.37%
  • Quarter-end effective duration for DBLTX was 4.92 and 6.40 for the U.S. AGG
  • The top two performers were non-Agency MBS and non-Agency CMBS
    • Spread tightening and interest income that offset the negative effects of rising interest rates


Outlook

  • We continue to hold this fund due to the approach and strong diversification factor within our core bond holdings – yet we are looking further into the holding as the year-to-date volatility and underperformance has made us reassess the approach
  • DBLTX is a good position to hold due to its low duration which outperforms during periods of rising rates – Treasury yields were at all time lows in 2020, but have recently been steepening which is good news for DBLTX
  • Historically, DBLTX has displayed stronger returns and lower volatility than the index
  • DBLTX has had consistent strategy, allocation focus, and sector distribution


[Category Mutual Fund Commentary]


Micah Weinstein

Research Analyst


Direct: 617.226.0032

Fax: 617.523.8118


Crestwood Advisors

One Liberty Square

Suite 500

Boston, MA 02109

www.crestwoodadvisors.com


CVS 1Q2021 earnings summary

Key Takeaways:

Current Price: $81                            Price Target: $90

Position Size: 2.01%                        1-year Performance: +30%

CVS reported 1Q21 earnings this morning that beat consensus expectations thanks to better Health Care Benefits and PBM segments performance. Revenue grew 3.5%, similar to Q4, and adjusted operating margin dropped 240bps in Retail/LTC (lower traffic) while Healthcare Benefits operating margin expanded 70bps (better cost management). Guidance was raised on the top and bottom line, but the management team remained conservative in their raise, as they see areas of uncertainties still such as vaccine costs, vaccine hesitancy allowing a return to business as usual. Urban areas are also slower to return to normal than expected. On the positive side, CVS has won some large PBM contracts from Rx Alliance (Walgreens/Prime). CVS has a relationship with Teladoc for its virtual offering, a key competitive offering. This opportunity to shift members to site of care with lower costs should be a positive over time for costs and membership retention. The combination of in person community sites (Health Hub and MinuteClinic) and telehealth will be a great competitive advantage over time. On the capital allocation front, CVS paid down $3B in debt in the quarter. Net debt/EBITDA is on track to achieve 3X target in 2022. We continue to think CVS’s approach to healthcare as a diversified company provides opportunities to interacts with its customers in various parts of the system and gain market shares. This is a multi-year process though and patience is key to see meaningful results.

Segments update:

·         Health Care Benefits: +6.7% revenue growth, thanks to increased membership in government products

·         Total medical members flat y/y

·         Medical Benefit Ratio of 83.2%

·         Pharmacy Services: +3.2% revenue growth, driven by Specialty Pharmacy growth of 7.2% (new business wins and inflation)

·         Retail/LTC: +2.3% revenue growth. Same-store-sales +0.4% impacted by tough y/y comps (pantry loading last year). Pharmacy SSS grew 4.1% due to market share gains, vaccinations, while a weak cold/cough season was a negative

·         250 additional Health Hubs added (total 800) – 1,000 targeted by the end of the year

·         90% second dose of Covid-19 vaccine compliance at CVS Health locations, and 1/3 of vaccination patients in retail pharmacies from under-represented populations

FY 2021 guidance:

·         Revenue growth raised to 4%-5.75% from 3%-4.5% – due to good momentum YTD. Possibility of a booster for Covid vaccine not in the company’s outlook for 2021.

·         Cost savings $900M to $1.1B reiterated

·         Adjusted EPS raised to $7.56-$7.68 from $7.39-$7.55

·         Unchanged capex guidance $2.7B-$3B – higher than prior years as the company plans to invest more in technology and digital enhancements

·         CFO $12B-$12.5B – unchanged guidance

·         Continued Covid testing, but covid impact should be immaterial to EPS

·         Flat dividend and no buyback


Thesis on CVS

·         Market leader: largest pharmacy benefit manager (PBM) in the US. This gives CVS scale advantage and negotiating power with pharma companies to obtain better drug pricing discounts. Also the largest US pharmacy retailer, giving it more touch points with consumers/patients. Finally, market share leader in long-term care pharmacy sector thanks to its Omnicare acquisition.

·         Aetna acquisition makes it vertically integrated.

·         Stable and predictable top line and margin profile. CVS benefits from an ageing population in increasing needs of prescription drugs.

·         shareholder friendly, offering a 7% shareholder yield (5% share repurchase + 2.6% dividend yield)


$CVS.US

Category: earnings

tag: CVS


Julie S. Praline

Director, Equity Analyst


Direct: 617.226.0025

Fax: 617.523.8118


Crestwood Advisors

One Liberty Square

Suite 500

Boston, MA 02109


www.crestwoodadvisors.com


Colgate 1Q 2021 earnings summary

Key Takeaways:


Current price: $80.9              Price target: $94  

Position size: 1.43%              1 year performance: +18% 


Colgate released its 1Q2021 earnings last Friday. Overall the quarter was good, but developed markets saw a faster slow down than expected, largely offset by emerging markets.

  • Colgate saw a greater deceleration in its developed markets than expected (although its improved recently)
  • In emerging markets, growth continues thanks to innovation in premium products (leading to price increases)
  • Expect uneven recovery across geographies due to vaccine roll-out, stimulus and oil prices (higher oil prices benefits emerging markets -> higher GDP)


  • Organic sales +5%, beating street expectation of +3.6%. Pricing was +4.6% and volume/mix 0.5%
    • EM sales +11.5% showing continued high growth levels in those markets. Pricing helped by 6%, while volume was +5.5%
    • Developed markets flat, as pantry-loading last year makes for tough comps this year,  a US warehouse transition issue (resolved), and the February winter storms
    • Hill’s pet nutrition +7%, good momentum thanks to increased pet ownership
  • Gross margin higher than peers, a proof of its pricing power. Should help the company offset raw material increases in quarter ahead. Operating margin down 30bps
    • Input costs saw significant increases in 1Q (310bps headwind), and are expected to remain elevated in 2021
    • Increased advertising
    • Benefit from pricing, productivity, mix shift
  • Promotion intensity gradually returning post-pandemic
  • Digital advertising largely embraced by large companies, and with its higher financial ability to spend on advertising vs smaller players, should be able to regain market shares lost to small players in past years. Algorithms on online search platform tends to presents large known brands on top of search rankings, reinstating barriers to entry that were non-existent initially online, which permitted small unknown brands to gain share.


  • 2021 guidance reiterated:
    • Organic sales to be 3-5% (in line with its long term target)
    • Gross margin expansion, and increased advertising spending
    • EPS growth mid-single to high-single digits growth – but slightly lower within guidance vs. last quarter due to FX moves, increase in raw material costs and greater cautiousness about its developed markets (recent slowdown)
    • Capital allocation plans: dividend,  debt paydown and share repurchase increased. They see some strategic gaps they want to fill in their portfolio with M&A


  • CEO quote: “we kind of experienced a perfect storm in the US in the first quarter. Obviously, the category expectations that we had declined more than we anticipated faster and deeper, quite frankly. On top of that, we obviously saw a significant increase in raw materials more than expected. Third, and this was the biggest piece versus our expectations with logistics. Two issues there. Obviously, the capacity and cost of logistics broadly across the US have gone up quite significantly. And that was exacerbated by a specific event that we had in a warehouse that we were opening up and had some transition issues associated with that,”


The Thesis on Colgate

  • High exposure to fast growing emerging markets (36% of Operating Profit from Latin America; 50%+ from EM)
  • Defensive Product set (soap and toothpaste). Product line less vulnerable to trade downs due to low private label exposure in the categories
  • Strong balance sheet (net debt/ebitda 1.4x) and highest ROIC in the sector
  • 2.64% dividend yield


$CL.US [tag CL] [category earnings]


Julie S. Praline

Director, Equity Analyst


Direct: 617.226.0025

Fax: 617.523.8118


Crestwood Advisors

One Liberty Square

Suite 500

Boston, MA 02109


www.crestwoodadvisors.com


MSFT Q3 Results

Current Price:   $252                     Price Target: Raising to $290 (from $255)

Position Size:    7.7%                     TTM Performance: 49%


Key takeaways:

  • Broad beat with 19% YoY revenue growth and +31% op. income growth. All segments grew mid-teens % or higher and saw margin expansion. Despite beat, stock traded off a bit last week after hitting an all-time high ahead of earnings.  
  • Azure continues to be key growth driver – Azure continues to take share in the public cloud with revenue ahead of expectations at +46% YoY in constant currency. A slight deceleration from +48% last quarter.
  • Teams strength – users doubled to 145M monthly active users.
  • CEO, Satya Nadella said, “Over a year into the pandemic, digital adoption curves aren’t slowing down. In fact, they’re accelerating and it’s just the beginning. Digital technology will be the foundation for resilience and growth over the next decade. We are innovating and building the cloud stack to accelerate the digital capability of every organization on the planet.”


Additional Highlights:


  • Commercial cloud ($17.7B, +33% YoY) and gaming (+50%) had standout performance. “Commercial cloud” aggregates the cloud businesses w/in the first two segments below: Office 365, Azure, the commercial portion of LinkedIn, Dynamics 365.
  • Improvement in advertising market continues to benefit Search and LinkedIn
  • As organizations become increasingly digital, MSFT’s products are evolving from being primarily productivity tools to being more strategic tools. This suggests an improving value proposition to customers, which is key to the durability of their LT growth and profitability. Some examples…
    • Growing their industry specific cloud presence. Introduced new industry clouds for financial services, manufacturing, and non-profits, building on existing clouds for healthcare and retail. Their pending acquisition of Nuance will increase their solutions in healthcare delivery.
    • They offer the most popular tools to help developers rapidly go from idea to code and code to cloud (Visual Studio and GitHub). They help developers infuse AI into the solutions they build…”Open AI” models are trained and hosted exclusively on Azure.
    • Power Platform (low code/no code solution) – enables non-developers in an organization to build applications, automate processes, create Virtual Agents and analyze data.
    • Teams is evolving collaboration w/in companies and w/ clients. Teams advantage is its broad integrated user experience. The fact that it’s sold bundled w/ MSFT’s other productivity offerings and its interoperability are key to its positioning. For example, Dynamics 365 can connect to Teams so that you can incorporate customer information and analytics. Teams is about actually getting work done where meetings and video is just one part – as such, its utility should increase w/ mixed office and WFH environment in the future. “Teams is rapidly becoming the de facto unified communications platform of choice for every organization.”
    • Microsoft Mesh powers shared experiences in a mixed reality platform powered by Azure. Accenture is using Mesh to build immersive virtual office experiences. https://www.youtube.com/watch?v=Jd2GK0qDtRgAs
    • Azure Digital Twins – an Internet of Things (IoT) platform that creates a digital representation of real-world things, places, processes etc. to gain insights, improve products, optimize operations/costs, and create new customer experiences. Bentley Systems is building a digital twin of the city of Dublin to reimagine urban planning. PepsiCo is simulating its manufacturing processes.
    • Dynamics 365 Intelligent Order Management helps companies support omnichannel fulfillment.
    • With Azure Cognitive Services, organizations can build applications that see, hear, speak, search, understand, and accelerate decision-making.
    • As games evolve, they are building new tools to help anyone build and sell creations on their platforms.
    • Satya Nadella: “we are innovating across the entire tech stack, as we differentiate and lead in areas that will be critical to the success of every customer going forward.”


SEGMENTS…


Productivity and Business Processes ($13.6B, +15% YoY):

  • LinkedIn – growth accelerated, revenues +25%, aided by strong growth in LinkedIn advertising business which is ~1/3 of LinkedIn’s total rev.
  • Office 365 Commercial (rev +22%)- driven by installed base expansion as well as higher ARPU.
  • Dynamics 365 (rev +45%) – helping organizations in every industry digitize their end-to-end business operations from sales and customer service to supply chain management.  
  • Teams continues to shine – they now have 145m daily active users.

Intelligent Cloud ($15.1B, +23% YoY):

  • Server products and cloud services revenue increased 23% with Azure revenue growth of 50% (46% cc). An increasing mix of large, long-term Azure contracts can drive quarterly volatility in the growth rates. Leader in hybrid cloud and have more datacenter regions than any other provider – and continuing to add data center regions, including new regions in China, Indonesia, Malaysia, as well as the US.

More Personal Computing ($13B +19% YoY):

  • Gaming grew 50% – with hardware up +232% and Xbox content and services revenue up +34%.  Xbox LIVE has > 100 million monthly active users and Game Pass now has ~18 million subs. Hardware growth driven by demand for new consoles.
  • Surface +12%, saw big acceleration in growth from last quarter
  • Search advertising revenue improved (+17% YoY ex-TAC) as companies pick up spending on digital advertising ahead of re-opening.

Valuation:

  • Free cash flow for the quarter was $17.1B, up 24%. Returned $10B to shareholders in repurchases ($5.8B) and dividends ($4.2B).
  • Recurring revenue is ~60% of total, underpins most of their valuation and is resilient and poised for additional growth. Particularly Azure, Office 365 and Dynamics 365. Stock is trading at ~3% forward FCF yield.


Sarah Kanwal

Equity Analyst, Director


Direct: 617.226.0022

Fax: 617.523.8118


Crestwood Advisors

One Liberty Square, Suite 500

Boston, MA 02109

www.crestwoodadvisors.com


$MSFT.US

[category earnings ]

[tag MSFT]


Visa Q2 Earnings

Current price: $234        Target price: $260

Position size: 3.7%          TTM Performance: 30%


Key takeaways:

  • Beat estimates earnings and revenue beat
  • Cross-border still a headwind but improving –driven by travel restrictions but Europe opening travel this summer w/ vaccines should be key to improvement.
  • Payment volumes continue to improve and their net revenue and profits are at 2019 levels even as a rebound in travel (especially cross-border travel), still remains ahead of them.
  • No guidance
  • CEO Al Kelly said, “we believe we are starting to see the beginning of the end and the recovery is well underway in a number of key markets around the world… Cross-border travel is the slowest sector to return, but there are some green shoots that offer real indication of people looking to see the world.”


Additional Highlights:

  • Revenues were down 2% YoY driven by cross-border headwinds (down 11% YoY or -21% YoY excluding intra-Europe), but mostly offset by growth in payments volume and processed transactions. Payments volume for the quarter increased 11% fueled by continued strength in debit as well as improving credit spending.
  • Quotes from the call…
    • “The pandemic has accelerated the digitization of cash, and we see the impact in debit and tap-to-pay. When we look at cash usage in the last 12 months just on the Visa brand, such as with ATM withdrawals, we see that global debit cash volumes have decreased by 7%, while debit payment growth has grown – payments volume has grown 16%, both on a constant dollar basis. This 20-point gap is more than double the historic gap in growth rates and relatively consistent globally, demonstrating cash digitization in both mature and emerging regions.”
    • “There is significant pent-up demand for travel, in particular personal travel” and “The decline in travel is temporary, and we’re starting to see some early signs of recovery.” The vast majority of the travel Visa captures on their credentials is consumer, and they are the global leader in travel co-branded cards.
  • Tailwinds building – pending travel recovery, re-opening beneficiary, accelerated cash digitization and growing e-commerce penetration…
    • The most notable sign of a domestic recovery was card-present spend growing 4% which is up 3% over 2019, an 8 point acceleration from Q1 led by retail and restaurant spending.
    • Credit has improved without debit slowing, pointing to accelerated cash displacement. The credit improvement was helped by increases in retail, travel, restaurant and entertainment spending mostly starting in early March as restrictions were relaxed in many states.
    • Spend categories trends are starting to shift – for categories that were hardest hit by this pandemic including travel, entertainment, fuel and restaurants, spending remains depressed but is improving with re-opening.
    • Cross border spending drives International transaction revenues which are >25% of total net revenues. As such, the steep drop is offsetting growth in service revs and data processing revs. As travel restrictions lift with the vaccine rollout, Visa will see a recovery in this meaningful piece of revenue. While cross-border spending did improve for the quarter (3 points better than Q1), it remains depressed (75% of 2019 levels), led by travel spending (down 55% YoY, still at 39% of 2019 levels), as the majority of borders remain closed.
  • Crypto opportunity:
    • “leaning into in a very, very big way, and I think we are extremely well positioned”
    • Enabling purchases, enabling conversion of a digital currency to a fiat on a Visa credential, helping financial institutions and fintechs have a crypto option for their customers and upgraded their infrastructure to support digital currency settlement
    • They have over 35 digital currency platforms/wallets that are working with them
    • Working with Central Banks as digital currency is being explored in many nations
  • Growth in “buy now, pay later”…
    • Nascent but growing
    • Visa is working with third party providers as well as offering their own proprietary platform that would allow issuers to offer their own buy now, pay later capability
    • Potential for value-added services, data analytics to augment a provider’s underwriting or risk products to help some of the third-party providers.
    • “we’re doing a lot in this space. We’re committed to it… I can’t predict exactly where it’s going to land, but we are going, to the degree it takes off, we’re going to be there to be part of it.”
  • Growth areas…
    • Consumer payments – digitizing the $18 trillion spent in cash and check globally. Continuing to grow acceptance (including contactless penetration) and grow credentials with traditional issuers, fintechs and wallets. In the last two years, they’ve grown their credentials to 3.6B and physical merchant locations to over 70m, up 7% and 34%, respectively. Notably, “merchant locations” only count partners like PayPal and Square each as one. LT opportunity to grow the pie for digital payments w/ the 1.7 billion unbanked.
    • New Flows – $185 trillion in B2B, P2P, B2C and G2C. P2P, which represents $20 trillion of the opp., was Visa Direct’s first use case and continues to grow substantially. Visa Direct transactions grew almost 60% in 2Q. A key area of future growth is cross-border P2P, or remittance. Four of the top five global money transfer operators were onboarded in fiscal year 2020, TransferWise, Western Union, Remitly, and MoneyGram. In G2C, for example, Visa Direct supported the US government’s disbursements of economic impact payments to nearly 13 million Visa prepaid credentials so far this year.
    • Value-added services – includes consulting, technology platforms (e.g. Cybersource, issuer processing, and risk identity and authentication), data and insights, and card benefits, all which will improve with the recovery. Opportunity to increase penetration w/ existing clients. In fiscal year 2020, more than 60% of their clients used at least five value-added services from Visa and more than 30%used 10 or more.
  • While COVID has been a headwind for Visa, particularly in cross border volumes – the long-term thesis is intact. Visa is a high moat, duopoly company with extremely high FCF margins (approaching 50%), strong balance sheet and continued runway for secular growth driven by the shift from cash to card/digital payments and new payment flow opportunities. Getting more expensive, trading at <3% FCF yield.


Sarah Kanwal

Equity Analyst, Director


Direct: 617.226.0022

Fax: 617.523.8118


Crestwood Advisors

One Liberty Square, Suite 500

Boston, MA 02109

www.crestwoodadvisors.com


$V.US

[category earnings]

[tag V]