Research Blog – INTERNAL USE ONLY

CCI Q1 Results


Current price: $191      Target price: $210

Position size: 2%           TTM Performance: 12%


Key takeaways:

  1. Reported a broad beat across key metrics.
  2. Seeing solid, durable tailwinds on increased spending from the major carriers on 5G spectrum deployment and Dish as a 4th carrier. Dish (as mandated by the FCC due to the TMUS/Sprint merger) is investing in establishing a national 5G network which is a tailwind to CCI.
  3. Seeing record tower growth now; small cell growth will be longer term driver – they are seeing an inflection point in small cell demand that supports long-term revenue growth. In the near-term carriers remain focused on macro-tower spending w/ small cell/fiber occurring at later stages of their 5G rollout. So this business should be a more meaningful growth driver in the future.
  4. Revenue stability & Reasonably valued – 90% of sales is site rental revenues based on long-term contracts (5 to 15 years) w/ limited ability to cancel and fixed escalation clauses (some linked to CPI). The rest of their revenue is Services, which is tied to site development and tenant equipment installation. The stock is reasonably valued trading at ~4% 2022 AFFO yield. With LT AFFO/share growth of 7-8% and >3% dividend yield (which they expect to grow w/ FFO), they should compound total returns low double-digits over a long period of time as demand for their shared infrastructure offering is tied to robust mobile data growth (~30% annually).
  5. Balance sheet strength w/ limited near term exposure to rising rates – They have methodically reduced the risk profile of their balance sheet. Since they achieved their initial investment grade credit rating over 5 yrs. ago, they have increased average debt maturity from 5 yrs. to >9yrs, reduced average borrowing costs to 3% from 3.8% and increased the mix of fixed-rate debt to > 90% from < 70% w/ no meaningful near term debt maturities. So limited near term exposure to rising rates.


 Additional highlights:

  • Relative to peers (SBAC and AMT), CCI has industry leading organic growth and their domestic footprint has shielded them from the FX headwinds and emerging market challenges currently impacting the other two.
  • Seeing record tower growth now; small cell growth will be longer term driver
    • Customers upgrading existing tower sites as a part of their first phase of 5G build-out.
      • Mid-band (C-band) and high-band (mmWave) spectrum are both are relevant for 5G and will drive lease up activity for CCI.
      • Carrier spend is currently focused on deploying mid-band spectrum as this is the first stage of 5G deployment and is often referred to as the “goldilocks” band as it is an ideal balance between bandwidth and propagation (i.e. its ability to carry more data and travel far distances). It can be deployed via towers and small cell, but towers remain the most cost-effective way for carriers to deploy spectrum at scale and establish broad network coverage.
      • Carriers just spent a ton (~$90B) at the recent C-band spectrum auctions… and now they’re focused on deploying it.
      • This near-term carrier focus is on C-Band deployment is stalling small cell deployment growth. C-band spectrum sits next to the spectrum used by air traffic control and is the tied to the FAA concerns in the news. On the call related to this they said, “There has not been any change in their behavior with our customers and we don’t expect there to be any impact to our 2022 outlook.”
    • Small cells are the next stage…
      • High-band (mmWave) spectrum is the next stage and is relevant for what’s often called the “real 5G” which would deliver on the huge gains in performance that 5G promises (step function increase in latency and bandwidth). It has significantly more capacity, but over a fraction of the geographic coverage area (lower propagation) which is why it needs to be deployed using small cells connected to fiber, making it ideal for dense urban areas. This densification is a driver of additional leasing as it’s a critical tool for carriers to accommodate continued growth in mobile data demand b/c it enables carriers to get the most out of spectrum assets by reusing it over shorter and shorter distances.
      • Growth in small cells should drive improving returns as they expect decreasing capital intensity for growth within their small cell and fiber business. With small cells there are “anchor nodes” and “colocation nodes” – the first “anchor” nodes are a lower ROI and additional nodes on existing infrastructure have higher incremental margins. So as lease-up activity continues, their ROI improves.
      • Small cell business is indeed picking up – this is key to the long-term thesis:  the CEO said they are “seeing an inflection in our small cells business” as customers are ” planning for the next phase of the 5G build out” for what they “expect will be a decade-long investment cycle as our customers develop next-generation wireless networks.” The small cell commitments they’ve secured in the last 12 months equate to 70% of the total small cells they’ve booked in their history prior to 2021.
  • Sustainability/ESG considerations…
    • Continue to aim for their goal of carbon neutrality by 2025 for Scope 1 and 2 emissions.
    • With labor shortages and rising prices, they have continued to make an effort to provide value and opportunity for their carriers: “…we’re happy to provide the capital at a much lower cost than what the markets can provide them capital because of the opportunity that we have to see returns from multiple operators across that same asset.”
    • Their solutions also help address societal challenges like the digital divide in under-served communities by advancing access to education and technology. “To date, we have invested nearly $10 billion in towers, small cells and fiber assets located in low income areas.”
    • Enhanced focus on ESG may drive increased revenue opportunities from things like smart cities and “broadband for all” and lower operating costs in areas like tower lighting and electric vehicles.


Disney and FL Legislation…

Giving an update on Disney and a measure passed today by the Florida legislature that would have a negative impact on the company. The legislation, which now goes to Gov. Desantis for his signature, would dissolve six special districts in the state as of June 1, 2023. One of those is  Reedy Creek Improvement District where Disney World is based. It was created in 1967 to allow Disney to essentially function as its own municipality.


Implications?


  • Florida Association of Special Districts leader David Ramba said “For Disney, the main effect is more red tape. Disney would no longer be able to grant itself permission to renovate buildings or to build a new road. Instead, park officials would have to go to the county governments for every request.” Which Ramba indicated was more of an annoyance than a threat to the parks. He also indicated that despite the legislation passing, legislators could simply reverse themselves during the next regular session in January, after election season ended.
  • The dissolution of the district could inhibit Disney’s ability to borrow in the $4 trillion state and local debt market, impacting the company’s access to cheaper tax-exempt financing through that special district, and could potentially cost Disney more to finance projects w/in that district.
  • Reedy Creek would likely be absorbed by the local government which would become responsible for things like sewer and road maintenance. In exchange, the counties would collect the tax revenue that Disney currently pays itself. Local governments would also absorb all of the district’s liabilities, including about $1 billion of municipal bonds currently outstanding, according to Bloomberg. Reedy Creek historically operates at a loss of approximately $5 to $10 million per year which Disney subsidizes.
  • There is some uncertainty as to how this proceeds, some, including Disney executives, seem to have the view that the Legislature can’t dissolve the district without the approval of voters.


Below are some snippets from an article in the LA Times that gives a good summary of the situation…


Why does Disney have these special powers?


“When brothers Walt and Roy Disney were looking to create another theme park on the East Coast, they took with them lessons from operating Disneyland in Anaheim, where it opened in 1955. Dealing with local regulations and government building inspections was a hassle. Disney wanted a way to achieve its sprawling ambitions without being so encumbered by municipal bureaucracy. The original idea for Epcot, in fact, was that it would essentially function as its own city.


And so the company worked with lawmakers to establish the Reedy Creek Improvement District. Walt Disney died in 1966, the year before the Reedy Creek law passed and a few years before Walt Disney World Resort opened in 1971.


The district, spanning roughly 40 square miles in both Orange and Osceola counties, provides everything from fire protection and emergency medical services to water systems, flood control and electric power generation. Its boundaries include four theme parks, two water parks, a sports complex, 175 miles of roadway, the cities of Bay Lake and Lake Buena Vista, utility centers, more than 40,000 hotel rooms and hundreds of restaurants and retail stores, according to its website. A five-member board of supervisors, elected by landowners, governs the district.


Its creation allowed Disney to transform acres of uninhabited pasture and wetland into a massive driver of tourism.


The powers granted were broad, making it much easier to move forward on building something like, say, the 183-feet tall Cinderella Castle, experts said. The district’s charter left open the possibility of Disney building its own airport or nuclear power plant if it wanted to. This was done to anticipate whatever needs might come up.


“They knew they were going to have one shot at these powers, because Florida needed Disney more than Disney needed Florida,” said Richard Foglesong, author of “Married to the Mouse: Walt Disney World and Orlando.” “They could get these powers at the opening, but they weren’t confident that they could add to their powers down the road. And so it was understandable that attorneys, I have no doubt, said, ‘Let’s get all we can now.'”


How would Reedy Creek be dissolved?


“Though the Florida Legislature is moving rapidly, the end of Reedy Creek wouldn’t happen immediately. Its dismantling would take effect June 1, 2023, along with that of a few other districts, giving Disney and the state about a year to resolve their issues. It also leaves the door open for special districts affected by the legislation to be reestablished.


Some lawmakers who oppose the move against Disney question whether the Legislature has the power to eliminate the company’s powers. Florida House Rep. Carlos Smith, who opposes the bill targeting Reedy Creek, tweeted an image of a section of a Florida statute indicating that dissolving an active special district would require the votes of landowners in Bay Lake and Lake Buena Vista. Disney holds the vast bulk of the voting power.”


How would this affect Floridians and Disney?


“Some lawmakers say the decision, if it takes effect, could create a significant financial hit for the counties affected by the Reedy Creek district. Disney finances the services the district provides, which would normally be paid for by local municipalities. Disney effectively charges itself property taxes to finance these services. For law enforcement, Disney pays the Orange County Sheriff’s Office.


If the district is dismantled, those responsibilities could fall to local municipalities and taxpayers, experts said. So could the district’s debt-load. The district’s long-term bonded debt totaled more than $977 million as of September, according to Reedy Creek’s annual financial report. State Sen. Stewart tweeted that removing the district “could transfer $2 Billion debt from Disney to taxpayers” and could have “an enormous impact on Orange & Osceola residents.”


“The fallout for Disney is also uncertain. While Disney pays for its own services in the district, it does get some benefits. It can issue municipal bonds, which get a lower interest rate than corporate debt. Disney is also exempt from certain fees and may save money by contracting local sheriff’s deputies, according to Foglesong. But the main benefit over the decades has been the flexibility the designation affords Disney.”


“They’d rather have it their way, where they can do things for themselves, rather than have to depend upon government,” Foglesong said.


Disney will probably fight back. It can’t pick up Walt Disney World and move it to a friendlier state, the way it can threaten to take the production of Marvel movies out of Georgia.”


Sarah Kanwal

Equity Analyst, Director


Direct: 617.226.0022

Fax: 617.523.8118


Crestwood Advisors

One Liberty Square, Suite 500

Boston, MA 02109

www.crestwoodadvisors.com


JNJ 1Q22 earnings summary

Key takeaways:


Current Price: $183      Price Target: $200 

Position size: 2.44%     1-Year Performance: +9%


  • Overall sales +7.7% ex-FX, +2.7% in the US and +12.6% International (driven by Europe)
  • Operating margins came below expectations
  • Adjusted EPS +6.2%
    • JNJ continues to outperform in its pharma segment, although this has been muted in part by lower consumer segment performance
    • Pharma segment performing well with sales +9.3%, but came below expectations due to covid vaccine sales and Xarelto performance
      • Oncology (Darzalex gained market share), infectious diseases (covid vaccine), neuroscience and immunology (Stelara growth for Crohn’s) all positive growth, but cardiovascular negative growth (Xarelto pricing)
    • Consumer segment: +0.8% organic growth
      • Growth in over-the-counter medicine (Tylenol & Motrin) and women’s health (restocking & price increases) but weakness in skin health/beauty (supply chain issues), oral care, wound care and baby care
      • Inflation has the biggest impact on this segment
    • Medical Devices: +8.5% organic sales growth is showing good signs of improvements, with the omicron variant having a lesser impact than expected
      • Growth in all sub-segments thanks to covid impact recovery
      • Strength in this segment is a positive for our other medical devices names (SYK up on good news)
      • Impact from China lockdowns will continue in April and May
      • Recovery is helped by procedures being done more often in outpatient settings rather than hospitals, a move that the pandemic accelerated
      • Diagnostics volume is now in line with pre-covid levels at the end of March
      • Focus on adding to this segment through M&A is possible


  • 2022 initial guidance:
    • Revenue $97.3B-$98.3B or up 6.5% to 7.5% is maintained from January guidance but now excludes covid vaccines sales
      • Guidance for vaccines is no longer provided due to supply chain (surplus) & demand uncertainty
      • Pharma: above market growth continues, consistent throughout the year
      • Medical devices: continued recovery expected, with prior launches to help
      • Consumer health: supply chain constraints continue in 1H22, improvement in 2H
    • 50bps operating margin expansion (no change to guidance)
    • EPS $10.60-$10.80 represents 8.2% to 10.2% growth y/y


Thesis on JNJ:

  • High quality company with consistent 20% ROE, attractive FCF yield,
  • Investments in the pipeline and moderating patent expirations create a profile for accelerated revenue and earnings growth
  • Growth opportunity: Medical Devices and Consumer offer sustainable growth and potential for expansion internationally
  • Strong balance sheet that offers opportunities for M&A.


[category Equity Earnings]

[tag JNJ]

$JNJ.US


Julie S. Praline

Director, Equity Analyst


Direct: 617.226.0025

Fax: 617.523.8118


Crestwood Advisors

One Liberty Square

Suite 500

Boston, MA 02109


www.crestwoodadvisors.com


Constellation Brands (STZ) earnings summary Q4 FY22

Key takeaways:


Current Price: $242                Price Target: $255 (NEW)  

Position Size: 2.48%              1-Year Performance: +4.3%


  • Total company sales +7.7% with both segments doing better than consensus
    • Beer sales increased by 14% (pricing +3.5%)
      • Beer shipment volume growth of 9.9% was above consensus and on top of last year high volume of +15.9%
      • The company is building this coming summer inventory level at the distributor level
    • Wine & spirits grew +5% organically, driven by high end portfolio (pricing +7.5%), but overall sales -6.9% due to divestitures. The company is adding ready-to-drink cocktails to the portfolio.
    • Hard seltzer: still an opportunity although the market changed faster than they anticipated. They see growth going forward (change of tone from last quarter there…). They are reworking the packaging.
    • Consumer consumption on-premise (outside the home) is strengthening but somewhat uneven, while at-home remains resilient
    • The company’s focus remains on higher-end price points both in beer and wine & spirits


  • Beer operating margin improved thanks to higher pricing and lower advertising expenses, expanding 240bps for the beer segment – in an environment that has most companies seeing shrinking margins due to high costs.
    • One-time charge regarding hard seltzer inventory obsolescence ($0.25 EPS impact a 2-3% impact for the year) impacted gross margins 350bps
  • Wine & spirits operating margin expanded by 280bps thanks to pricing & mix


  • With share repurchase back on the table this quarter, STZ is focusing back on capital allocation in a way that make investors happy (rather than the Monster/STZ potential merger that wasn’t well received due to little synergies between the two). There has been talks about the share class change as well for the Sands family to swap their class B shares (carrying 10 votes each) into a class A share for a 35% premium, a move to alleviate the dual-share class governance risks. The move would cut the family control from 59.5% to 19.7%. Here’s the proposal from the family: “intended to enhance the attractiveness of the common stock to investors and to enhance the strategic flexibility of the Co.  for the long term and was not made in connection with or with the intention of facilitating any specific corporate transaction.”. The proposal would dilute the share count but allow a better governance rating and open the door to potential M&A discussions.


  • Guidance for fiscal year FY23:
    • Share repurchase of $500m in Q1 – with refocus on returning cash to shareholders
    • Beer net sales +7-9%
    • Beer margins to grow 2-4%, although we think this is conservative due to high inflation
    • Wine & Spirits sales -1% to -3% and operating margin +4% to +6%
    • EPS guidance of $11.20-$11.50 (+3.3% growth), but doesn’t account for all share repurchase that will/can be made during the rest of the year (only $500M in Q1).


  • Valuation: trading slightly below peers and doesn’t look expensive vs. historical trend. Updated DCF gives us $255 after updating for the new fiscal year, and better top line in FY23 than previously thought.


Investment Thesis:

  • STZ helps position our portfolio to be more defensive at this stage of the economic cycle
  • Management team focused on high quality brands and innovation
  • STZ continues to have HSD top line growth and high margins that should incrementally improve going forward
  • STZ comes out of a heavy capex investment cycle to support its growth: FCF margins are set to inflect thanks to lower capex
  • Growth optionality from cannabis investment


[tag STZ] [category earnings]

$STZ.US


Julie S. Praline

Director, Equity Analyst


Direct: 617.226.0025

Fax: 617.523.8118


Crestwood Advisors

One Liberty Square

Suite 500

Boston, MA 02109


www.crestwoodadvisors.com


ADBE 1Q Results

Current Price:   $431                  Price Target: $650

Position Size:    2.9%                  TTM Performance: -2%


Key Takeaways:

  • Q1 results were a slight beat, 2Q guidance disappointed slightly, but full year 2022 guidance maintained. They lapped an extra week in Q1 2021 which was a headwind to headline growth numbers. Demand commentary continues to be very positive.
  • Russia/Ukraine impact – They halted new sales in Russia and Belarus and eliminated annual recurring revenue from these regions and from Ukraine – collectively it’s less than $100m in annual recurring revenue impact.
  • Announced select price increases – they won’t meaningfully impact results until the second half of 2022. Price increases were already contemplated in previous 2022 guidance. They’ve had no meaningful price increase since 2018.
  • No change in thesis – fundamentals continue to be strong. The recent sell off in the stock is all multiple contraction.


Additional highlights:

  • Conference call quotes…
        • CEO said…”I feel more positive about our business moving forward than I ever have.”
        • “The acceleration to all things digital has made content and creativity more important than ever before. Everyone needs to express themselves digitally, from the individual on social media to the student creating a more compelling school project to the creative professional making the next marketing campaign”…”we’re building applications for every surface and every audience across web, mobile and desktop.”
        • “We’re seeing tremendous interest for Substance 3D and our new 3D Modeler beta, as brands bring together the physical and digital worlds and begin their journeys to become “metaverse ready.” Substance is already being adopted by global brands like Coca-Cola, NASCAR and Nvidia for marketing and e-commerce.”
  • Long runway for growth
      • Less than 10% penetration on 2024 TAM expectations of >$200B (updated in Dec). That includes ~$110B for Digital Experience and ~$95B for Digital Media (~$63B for creative ($25B creative professionals; $31B communicators; $7B consumers) and ~$32B for document cloud ($10B knowledge workers; $8B communicators; $14B document services/APIs)). 
      • Benefiting from secular growth driven by digital transformation, device proliferation, rising content creation and evolving content mediums including voice, augmented reality and virtual reality.
      • Adobe is a rare company w/ >90% recurring revenue, double digit top line growth and ~40% FCF margins. Accelerated secular tailwinds around digital transformation, along w/ continued share buybacks, will be a long-term benefit and driver of them continuing to compound FCF/share double digits.


    • Digital Media segment (+17% YoY adjusted for extra week in ’21; ~71% of revenue): “unleashing creativity & accelerating document productivity”
      • Comprised of Creative cloud (~60% of total revenue, +16% YoY) and Document Cloud (11% of total revenue, +17% YoY). Q2 total segment growth guided to +14%. Segment Annualized Recurring Revenue (“ARR”) grew to $12.57B w/ Creative ARR of $10.54 billion and Document Cloud ARR of $2.03 billion.
      • Creative Cloud is benefiting from “exploding” content creation and consumption across phones, tables and desktops. Seeing strong retention and renewal across all Creative products and customer segments.
      • Growth drivers in creative cloud – increasing focus on new and emerging content creation categories including video, 3D, Virtual Reality, Augmented Reality and immersive content for emerging metaverse platforms.
      • Document Cloud – “powering the paper-to-digital revolution” “we’ll continue to gain significance as hybrid work becomes the standard.” Using the power of AI with Adobe Sensei, Document Cloud is automating workflows across web, desktop and mobile. Going forward, Document Cloud will increasingly make up a larger mix of net new Digital Media ARR.
    • Digital Experience segment (+20% YoY adjusted for extra week in ’21; ~29% of revenue): “powering digital businesses”
      • Digital Experience subscription revenue was $932, +22% YoY. Q2 guided to +18%. Segment revenue includes: subscription revenue, professional services revenue, and “other”, which includes perpetual, OEM and support revenue.
      • Beneficiary of growing e-commerce penetration – Adobe offers a digital commerce platform (Magento) that competes w/ Shopify and BigCommerce which benefits from growing e-commerce spending. Named a 2021 “Leader” in the Gartner Magic Quadrant for Digital Commerce


FCF estimates for FY 2022…increased last year and have remained steady


Sarah Kanwal

Equity Analyst, Director


Direct: 617.226.0022

Fax: 617.523.8118


Crestwood Advisors

One Liberty Square, Suite 500

Boston, MA 02109

www.crestwoodadvisors.com


$ADBE.US

[tag ADBE]

[category earnings]


Berkshire Hathaway Q4 results

On 2/25, Berkshire Hathaway released their 2021 Q4 results and Warren Buffett’s letter to shareholders.   Annual letter from Buffett is attached.

Key takeaways from the quarter are as follows:


  • Berkshire reported $7.28b operating earnings versus $5.02b from prior year, up 20.4%
  • Buffett repurchased $6.8b of shares in Q4 and $27.1b for 2021 representing 3.7% of shares  
  • Cash and shares of Apple represent 40% of value of firm. 


Current Price: $330                         Price Target: $370 (raised from $330)

Position Size: 3.6%                          TTM Performance: 26.9%


Highlights from quarter – solid cyclical rebound

  • Railroads – YoY revenue rose 11.6% and earnings rose 13.3%
  • Berkshire energy – YoY revenue up 9.6% and earnings up 15.7%
  • Manufacturing, service and retail – Profits rose 22.9% YoY
  • Insurance revenues rose 4.29% and profits fell -2.3% YoY though BRK’s insurance profits are very lumpy.


Greg Abel, Buffett’s appointed successor, published a note on Berkshire’s ESG endeavors in the appendices of the annual report. 

  • They target cutting BHE’s greenhouse emissions from a baseline of 80 metric tons to 40 in 2030.
  • Berkshire Hathaway Energy will retire 16 coal units between 2022-2030 and all coal units by 2049 achieving net zero emissions by 2050!
  • For Burlington Northern Santa Fe, they target a 30% reduction in greenhouse gases by 2030.


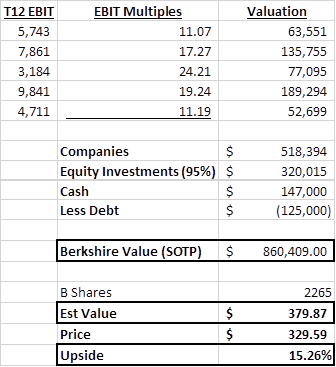
Valuation:  Berkshire is selling at a 15% discount to intrinsic value using sum of the parts.  Their cash of $145b and Apple representing $150b comprises 40% of the company’s valuation. 


Berkshire’s top 5 holdings:


Berkshire remains a core holding, is currently undervalued, defensively positioned and cyclically sensitive to the economic recovery.


Please let me know if you have any questions.


Thanks,

John


($brk/b.us)


John R. Ingram CFA

Chief Investment Officer

Partner


Direct: 617.226.0021

Fax: 617.523.8118


Crestwood Advisors

One Liberty Square

Suite 500

Boston, MA 02109

www.crestwoodadvisors.com


LISIX Q4 2021 Commentary

Lazard International Strategic Equity Fund Commentary – Q4 2021

Thesis

LISIX is a bottom-up, growth-based fund that completes the core satellite strategy within global equity. The fund is unique in that it focuses on individual stocks rather than markets and looks for reasonably priced companies with strong growth potential. We like LISIX because of the managers’ expertise in various market caps, geographies, and sectors which helps keep the fund diversified while providing strong upside and downside capture over time.


[More]


Overview

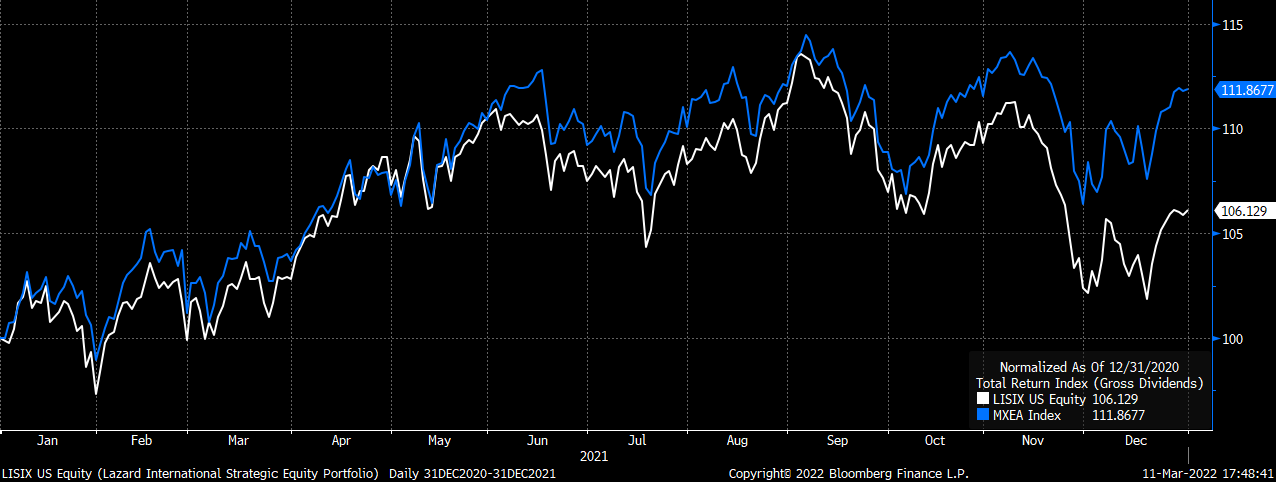
In the fourth quarter of 2021, LISIX underperformed the benchmark (MSCI EFEA Index) by 349bps. Even with the volatility, the MSCI EAFE index closed near a high. As for the fund, exposure to names that were vulnerable to concerns around the normalization of economic activity caused performance to lag. Strong selection in Industrials, Consumer Discretionary, and Health Care contributed to returns, though.


Q4 2021 Summary

  • LISIX returned (0.80%), while the MSCI EAFE Index returned 2.69%
  • Contributors
    • Kobe Bussan, Linde, Accenture, Suncor
  • Detractors
    • CAE, Ryanair, Suzuki, Medronic, Lojas Renner


2021 Performance Comparison

Chart, histogramDescription automatically generated


[Category Mutual Fund Commentary]


Micah Weinstein

Research Analyst


Direct: 617.226.0032

Fax: 617.523.8118


Crestwood Advisors

One Liberty Square

Suite 500

Boston, MA 02109

www.crestwoodadvisors.com


HILIX Q4 2021 Commentary

Hartford International Value Fund Commentary – Q4 2021

Thesis

Serving as a satellite holding, HILIX is a value style fund that takes advantage names that have underperformed recently and are cheaply priced. The team generates alpha by finding companies with strong fundamentals that are overlooked during times of low consensus expectations. We like that HILIX takes advantage of extremes and gains exposure to less efficient market caps by having more holdings and moderate active bets.


[More]


Overview

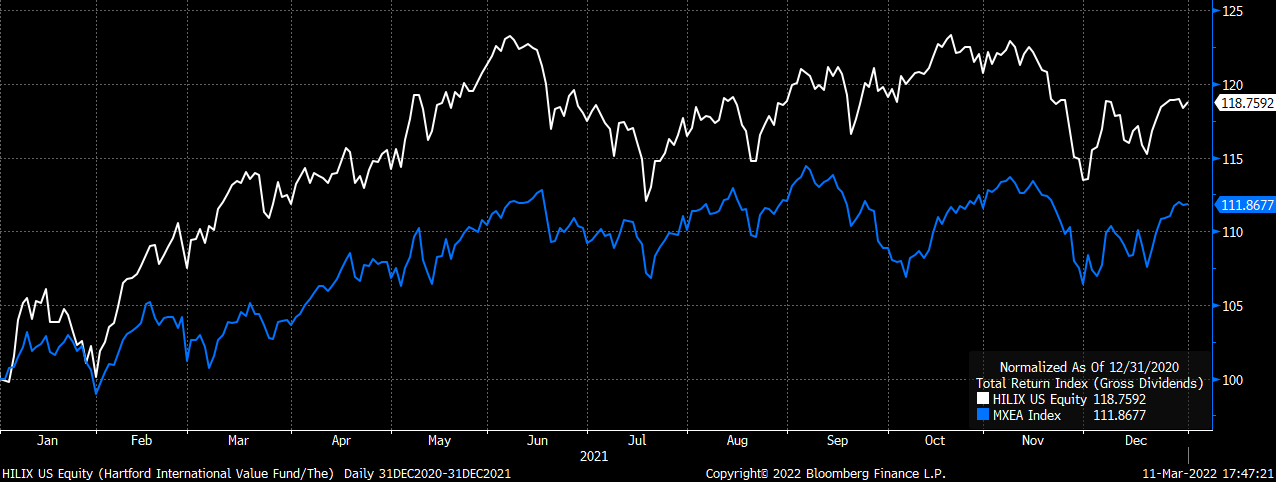
In the fourth quarter of 2021, HILIX underperformed the benchmark (MSCI EFEA Index) by 300bps. The quarter saw a spike in volatility due to the Omicron variant, increasing energy prices, supply chain disruptions, inflation, and other macro-economic factors. The fund’s underperformance was mainly driven by poor selection within Industrials, Health Care, and Consumer Discretionary, but was partially offset by Communication Services and Materials. Sector allocation also detracted from returns, specifically within Utilities and Communication Services, but slightly offset by Real Estate. Regionally, selection within the UK, and Developed European Union & Middle East ex UK weighed on returns, but was also slightly offset by selection in Japan.


Q4 2021 Summary

  • HILIX returned (0.31%), while the MSCI EAFE Index returned 2.69%
  • Top issuer contributors
    • GREE, Inc., SoftBank Group Corp., Westpac Banking Corp., UniCredit S.p.A., WPP Plc
  • Top issuer detractors
    • Pax Global Technology Limited, HSBC Holdings Plc, GlaxoSmithKline plc, Japan Airlines Co., Ltd., Fresenius SE & Co. KGaA


2021 Performance Comparison

ChartDescription automatically generated


[Category Mutual Fund Commentary]


Micah Weinstein

Research Analyst


Direct: 617.226.0032

Fax: 617.523.8118


Crestwood Advisors

One Liberty Square

Suite 500

Boston, MA 02109

www.crestwoodadvisors.com


HLMEX Q4 2021 Commentary

Harding Loevner Emerging Market Fund Commentary – Q4 2021

Thesis

HLMEX utilizes fundamental research to find companies with strong quality and growth metrics that can be compared across the global landscape. By focusing on investments with competitive advantages, long-term growth potential, quality management, and corporate strength, HLMEX offers diversity to our EM allocation while generating alpha over the long run. We continue to hold the fund because of the team’s conviction in high quality companies and managed risk through diversification and evaluation.


[More]


Overview

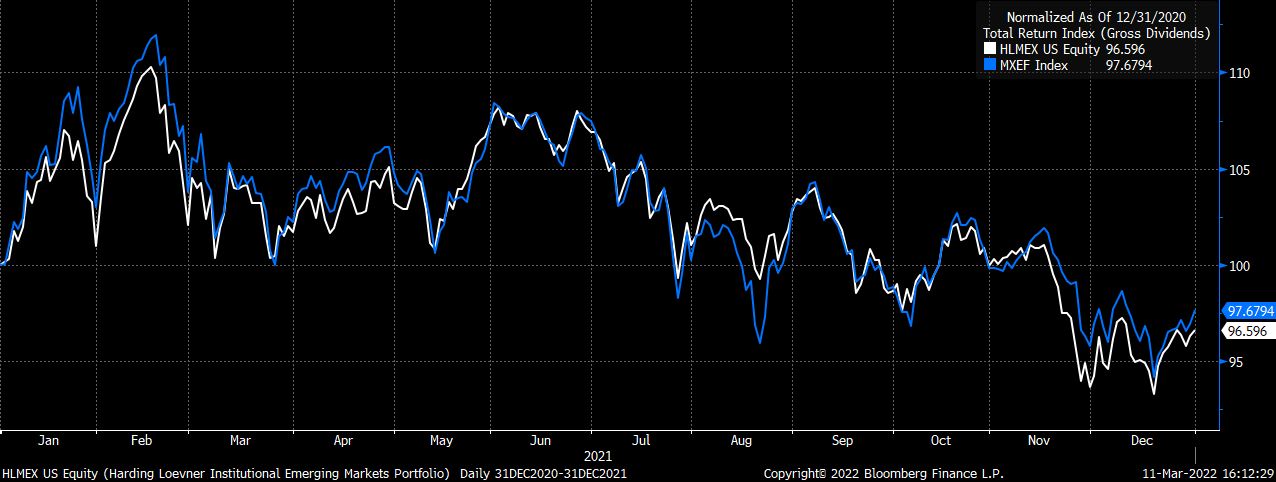
In the fourth quarter of 2021, HLMEX underperformed the benchmark (MSCI Emerging Markets Index) by 93bps. EM markets fell in the second half of the year as global inflation fears grew and a slowing to China’s growth occupied the space. Specific to the fund, poor stock selection in Financials and Communication Services detracted from returns. Strong selection in Consumer Discretionary and Utilities, and positive allocation helped performance, it was not enough to fully offset or overcome the negative returns from Financials and Communication Services.


Q4 2021 Summary

  • HLMEX returned (2.17%), while the MSCI Emerging Markets Index returned (1.24%)
  • Contributors
    • Sector: Overweight to IT, underweight to Health Care and Consumer Discretionary
    • Stocks: ENN Energy (China), Sunny Optical (China), EPAM (Eastern Europe)
  • Detractors
    • Sector: No exposure to Materials, Communication Services, Financials
    • Stocks: Sberbank (Russia), XP (Brazil)
  • Fund’s expense ratio dropped from 1.17% to 1.10% in Q3 2021


2021 Performance Comparison

ChartDescription automatically generated

[Category Mutual Fund Commentary]


Micah Weinstein

Research Analyst


Direct: 617.226.0032

Fax: 617.523.8118


Crestwood Advisors

One Liberty Square

Suite 500

Boston, MA 02109

www.crestwoodadvisors.com


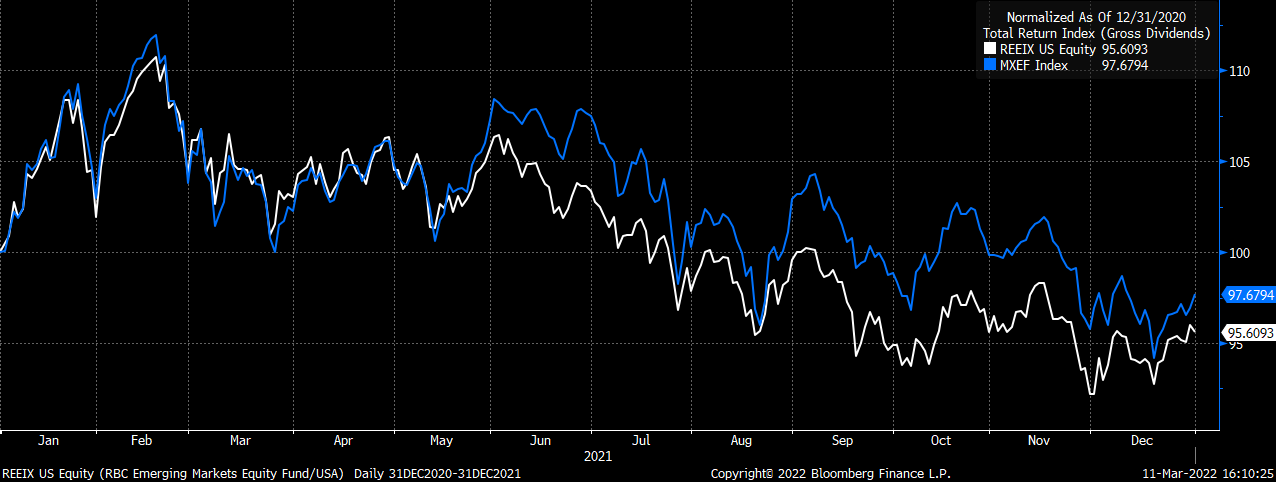
REEIX Q4 2021 Commentary

RBC Emerging Market Equity Fund Commentary – Q4 2021

Thesis

REEIX is driven through both top-down and bottom-up fundamental research that provides diversification within our full EM allocation. The fund looks for high quality companies across all market caps that have strong ESG scores. We like REEIX because of the consistent and repeatable process that allows the team to take advantage of companies with sustainable growth across all the Emerging Market (EM) landscape.


[More]


Overview

In the fourth quarter of 2021, REEIX outperformed the benchmark (MSCI Emerging Markets Index) by 211bps. While the EM market reported losses largely due to poor performance in the Chinese stock market, the fund’s underweight to the region was a large contributor to the outperformance. Strong sector allocations also had a positive impact on performance, especially within Financials, Consumer Discretionary, and Communication Services. Security selection within Financials and a flight away from quality detracted from returns. Poor selection in India and South Africa also hurt performance.


Q4 2021 Summary

  • REEIX returned 0.80%, while the MSCI Emerging Markets Index returned (1.31%)
  • Contributors
    • Tata Consultancy services, MediaTek, Sunny Optical, NARI Technology, absence of Pinduoduo
  • Detractors
    • Ping An Insurance, NCSoft, B3 SA, AIA Group, Infosys


2021 Performance Comparison

ChartDescription automatically generated


[Category Mutual Fund Commentary]


Micah Weinstein

Research Analyst


Direct: 617.226.0032

Fax: 617.523.8118


Crestwood Advisors

One Liberty Square

Suite 500

Boston, MA 02109

www.crestwoodadvisors.com