Research Blog – INTERNAL USE ONLY

FW: WATFX – Q3 2020 Commentary

WATFX Commentary – Q3 2020

Thesis

WATFX is an actively managed fund that finds overlooked areas of the market that can go against consensus views and add value. Through internal macro, credit, and fundamental research WATFX identifies undervalued securities and takes on more credit exposure to generate alpha over time. Through a diversified approach to interest rate duration, yield curve, sector allocation, and security selection, the fund dampens exposure to volatility.


[more]


Overview

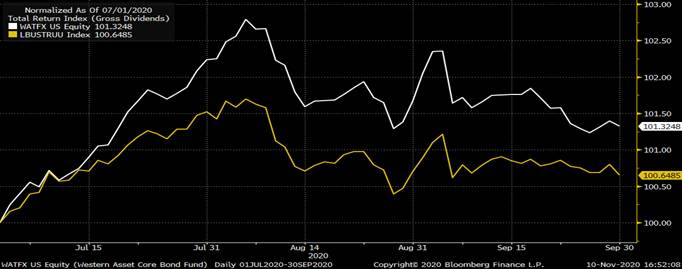
In the third quarter of 2020, WATFX outperformed the benchmark (Barclays U.S. AGG) by 87bps. Duration positioning adjustments helped generate positive returns for the fund. Exposure to structured products, non-agency RMBS and ABS gave the fund positive relative performance. TIPS and EM exposure were also a positive for returns, but investment grade corporate bond exposure, such as in the banking industry, detracted from overall performance.


Q3 2020 Summary

  • WATFX returned 1.49%, while the U.S. AGG returned 0.62%
  • Quarter-end effective duration for WATFX was 7.0 and 6.1 for the U.S. AGG
  • A steepening yield curve created a headwind for returns
  • Cut TIPS exposure as breakeven inflation rates rose


Outlook

  • We continue to hold this fund and believe in our thesis due to the fund’s diverse approach and strong top down-bottom up fundamental value investing over the long-term
  • WATFX is expecting a longer “U-shaped” global economic recovery
    • Expecting central banks to continue to roll out stimulus
  • The fund is excited to seek out opportunities as spreads widen and the Fed continues to support corporate credit markets


[Category Mutual Fund Commentary]


Micah Weinstein

Research Analyst


Direct: 617.226.0032

Fax: 617.523.8118


Crestwood Advisors

One Liberty Square

Suite 500

Boston, MA 02109

www.crestwoodadvisors.com


FW: MWTIX – Q3 2020 Commentary

MWTIX Commentary – Q3 2020

Thesis

MWTIX is an actively managed fund that provides a sector-based strategy while still maintaining fundamental research driven through issue selection. When compared to the benchmark (Barclays U.S. AGG), the holdings have similar duration and exposure, yet selection is focused around areas where other managers are not looking. Through sector rotation and active weighting, we expect MWTIX to generate alpha over time.


[more]


Overview

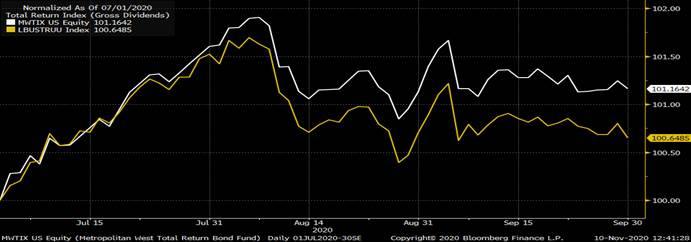
In the third quarter of 2020, MWTIX outperformed the benchmark (Barclays U.S. AGG) by 64bps, largely due to strong selection within corporate credit and residential MBS. The fund’s overweight to energy and finance companies helped contribute to higher relative performance, as well as a higher average yield. Exposure to non-agency MBS, ABS, and TIPS also added to relative performance. The fund’s duration – which is shorter than the index – had little impact on the returns as Treasury rates had mild changes during the quarter.


Q3 2020 Summary

  • MWTIX returned 1.26%, while the U.S. AGG returned 0.62%
  • Quarter-end effective duration for MWTIX was 5.58 and 6.1 for the U.S. AGG
  • The fund has focused on allocating to higher quality products and securities
    • Defense sectors make up the allocation in corporate credit and high yield
    • Agency MBS have been swapped for TBAs
    • A focus from ABS to AAA-rated CLOs and government guaranteed student loan collateral


Outlook

  • We continue to hold this fund and believe in our thesis due to the fund’s defensive approach and minimal exposure to more vulnerable issuers and industries
  • Pandemic data suggests that is will take a considerable amount of time for the economy to get back to its pre-COVID levels
    • Behavioral changes and persistent labor market disparities will act as a headwind to a consumer-driven rebound
    • Volatility will continue, especially with a delayed and potentially lower stimulus
  • MWTIX has positioned itself to take advantage of relatively attractive prices during times of high volatility to generate strong returns


[Category Mutual Fund Commentary]


Micah Weinstein

Research Analyst


Direct: 617.226.0032

Fax: 617.523.8118


Crestwood Advisors

One Liberty Square

Suite 500

Boston, MA 02109

www.crestwoodadvisors.com


FW: DBLTX – Q3 2020 Commentary

DBLTX Commentary – Q3 2020

Thesis

DBLTX utilizes a top down-bottom up process that focuses on MBS and Agency bonds. When compared to the benchmark (Barclays U.S. AGG), the holdings have lower duration and exposure to corporate bonds, reducing their sensitivity to interest rate movements and credit spreads. We expect attractive risk-adjusted return characteristics over the long term from DBLTX, especially during periods when corporate bonds’ spread increase and the yield curve steepens.


[more]


Overview

In the third quarter of 2020, DBLTX outperformed the benchmark (Barclays U.S. AGG) by 40bps, largely due to asset allocation within the securitized credit sectors. Non-Agency RMBS was the largest contributor to returns, while non-agency CMBS also helped performance as rent collections stabilized. CLOs and asset-backed securities also contributed positively to returns, yet Agency MBS slightly detracted from the fund’s overall performance.


Q3 2020 Summary

  • DBLTX returned 1.02%, while the U.S. AGG returned 0.62%
  • Quarter-end effective duration for DBLTX was 3.33 and 6.1 for the U.S. AGG
  • The top two performers were non-Agency RMBS and non-Agency CMBS
    • Agency MBS securities produced negative returns due to high levels of prepayment rates which caused spreads to widen


Outlook

  • We continue to hold this fund due to the approach and strong diversification factor within our core bond holdings – yet we are looking further into the holding as the year-to-date volatility and underperformance has made us reassess the approach
  • DBLTX is a good position to hold due to its low duration which outperforms during periods of rising rates – Treasury yields are at an all-time low and we expect the yield curve to steepen at some point in the future
  • Historically, DBLTX has displayed stronger returns and lower volatility than the index
  • DBLTX has had consistent strategy, allocation focus, and sector distribution


[Category Mutual Fund Commentary]


Micah Weinstein

Research Analyst


Direct: 617.226.0032

Fax: 617.523.8118


Crestwood Advisors

One Liberty Square

Suite 500

Boston, MA 02109

www.crestwoodadvisors.com


Black Knight 3Q20 Earnings

Current Price: $90           Price Target: $96 (raised from $85)

Position Size: 2.6%          TTM Performance: 53%


Key Takeaways:


·       Better than expected revenue and EPS. Guidance raised above street. Exceeded expectations on higher origination volumes and continued improvement in data and analytics sales.

·       Lower foreclosures is a headwind: as they indicated last quarter, they are seeing lower foreclosure-related volumes in their Specialty Servicing software business due to the foreclosure moratorium.

·       Data & Analytics accelerated (+27% YoY): Seeing continued improvement with cross-selling Data & Analytics (~15% of revenue), which could be a solid future growth driver for them.


Additional Highlights:

·        Q4 Revenues were $312m, +4.5% and adj. EPS was +7%.

·        Housing data points: low rates, improved affordability and low inventory continue to put upward pressure on home prices, with the median home price rising by 14.2% in September. This is up from an 11.5% increase in August, the highest annual home price growth rate in more than 15 years. This is benefiting origination volumes. Estimated origination volumes based on underlying locks suggest Q3 refinance and total originations could be up 25% or more from Q2, while purchase lending could be up by 35% or more. This would push 2020 purchase lending to its highest level since 2005 and both refinance lending and total origination volumes to their highest levels ever, with total lending on pace to easily eclipse the $4 trillion threshold for the first time on record.
·      Foreclosure moratorium: For homeowners with mortgages backed by government-sponsored enterprises Fannie Mae or Freddie Mac, the Federal Housing Finance Agency, the moratorium is set to expire at the end of the year. GSEs and other government loans cover about 70% of all mortgages. The other 30% of homeowners w/ private mortgages are not protected under federal law – some banks are following federal guidelines, but only legally obligated to stop foreclosures in a handful states.

·       Their stake in D&B is now worth $1.4B w/ the recent IPO. They invested just under $500m in their D&B stake ~1 year ago giving them a pre-tax unrealized gain of ~$900m.

·       Closed acquisitions of Optimal Blue (enhance their origination and Data & Analytics businesses) and DocVerify (supports e-notarization and remote online notarization).  Optimal Blue is, 80% recurring revenue, accretive to their overall organic growth rate and aided their guidance improvement.

·       Data analytics segment (~15% of revenue) revenues were up 27%, an acceleration from 21% last quarter. Driven by growth in their property data and portfolio analytics businesses.

o   EBITDA margin +940bps YoY.

o   Trending ahead of LT targets in recent quarters on strong cross-sales related to new client deals, as well as renewals. They continue to see promising momentum in this business.

o   Current situation is highlighting their unique data sets and analytics. They are the only company with real-time visibility into the majority of active mortgage loans in the US. This is helping w/ loan origination despite social distancing. They’ve seen significant interest in and adoption of their expedite e-close and e-sign solutions as well as their loss mitigation solution since the beginning of the pandemic.

·        Software Solutions segment (~85% of revenue) down +1%.

o   Within this segment servicing (~70% of revenue) was down -4% driven by lower foreclosure related volumes due to the foreclosure moratorium as part of the CARES Act. The year-over-year performance improved from2Q as a result of the Bank of America conversion and the anniversary of headwinds from a client de-conversion.

o   They continue to dominate first lien loans with leading share and are growing share in second lien loans. Market share for first mortgages is >60%.

o   Year-to-date, signed five new MSP clients, representing over 750,000 loans.

o   Originations (~16% of total revs) made up of new loans and refi’s – revenues increased 20% in Q2 – Volumes were stronger than expected. Lower rates help this business. Growth driven by new clients, a tuck-in acquisition, as well as higher refinanced volumes in their Exchange and e-Lending businesses.

o   Segment EBITDA margin down 110bps YoY.

·         Raised full year 2020 outlook:

o   Revenues of $1,229 million to $1,235 million (raised from $1,170 million to $1,184 million). 

o   Adj. EPS of $2.03 to $2.07 (previously $1.94 to $1.99), street at $1.93

o   Adj. EBITDA of $603 million to $608 million (previously $572 million to $583 million)

Valuation:

·         Trading at <3% FCF yield on 2021 –valuation is getting more expensive but supported by growth potential, strong ROIC with a recurring, predictable revenue model (>90% recurring revenue) and high FCF margins, which is aided by high incremental margins and capex which should taper as they grow.

·         $2.3B in net debt – that puts their leverage ratio at 3.6x. Increased from <2x with recent acquisitions.

·         Capital allocation priorities include debt pay down, opportunistic share repurchases and acquisitions.

Thesis:

  • Black Knight is an industry leader with leading market share of the mortgage servicing industry. 
  • Stable business with >90% recurring revenues, long-term contracts and high switching costs.
  • BKI has high returns on capital and high cash flow margins.


.UA

[tag BKI}

[category earnings]

Sarah Kanwal

Equity Analyst, Director


Direct: 617.226.0022

Fax: 617.523.8118


Crestwood Advisors

One Liberty Square, Suite 500

Boston, MA 02109

www.crestwoodadvisors.com


$BKI.US

[category earnings]

[tag BKI]


BKNG 3Q Results

Current Price: $1,783      Target price: $2,400

Position Size: 1.8%          TTM Performance: -12%


Key Takeaways:

·       Beat on revenue, missed on EPS.

·       Demand improved throughout Q3, but weakened meaningfully beginning in October w/ Covid resurgence in Europe. Strongest trends were w/ domestic driving travel and alternative accommodations (e.g. home rentals). Alternative accommodations were 1/3 of booked room nights.

·       Cost cutting continues which should aid margins when demand environment improves.

·       Weak environment strengthens their position w/ suppliers as they are a key source of demand. Demand mix shift away from business towards leisure benefits BKNG’s leisure focus.


Additional Highlights:


·       CEO said Q3 benefited greatly from some lifting of government lock-downs and the release of pent-up demand created by the almost complete cessation of travel during parts of Q2.  However, COVID-19 case counts are now rising steeply in many parts of the world with corresponding increases in lock-downs and re-imposed travel restrictions that will continue to impact travel in the near-term.
·      Revenues for Q3 were $2.6B (-48% YoY) vs $2.5B consensus. While they missed on EPS, there were some adjustments including an unrealized gain on marketable securities and an impairment charge for OpenTable and Kayak goodwill. 
·       Q3 bookings were $13.4B (-47% YoY vs. -91% in Q2), slightly below consensus. 
·        Improving trends in Q3 – Room nights declined -43% YoY and ADRs declined -8% YoY ex-FX. This is an improvement from Q2 when room nights booked were down 87% YoY. They saw a surge in demand when travel restrictions and stay-at-home orders eased. 
·        Weakening results in Q4 w/ resurgence in outbreaks – The YoY decline in reported room nights was relatively consistent each month of Q3, as the steady improvement in global trends that they saw from April through July, flattened out in August and September. In October reported room nights declined by about 58% compared to October 2019. And over the last 7 days through yesterday, declined by about 70%. Worsening result is driven by increased virus infections and certain governments re-imposing public health-related restrictions. 
·       Weak guidance“Given the trends we are currently seeing, we believe that year-over-year room night declines will be greater in Q4 than what we observed in October. If this turns out to be the case, it will be very challenging for us to reach profitability in Q4.”

·       Strength in domestic travelbooking trends were primarily driven by domestic travel with international trends seeing much more limited improvement. Domestic business benefiting from prohibitions/restrictions on international travel, which forces consumers who want a holiday to travel domestically. Note that “domestic” is just intra-country, so travel between countries w/in Europe is international.

·       Connected trip is a long-term growth driver – The long-term vision for them continues to be the “connected trip.” The idea is to be a platform for not just hotel, but a portal for all aspects of travel including flights, activities, restaurants etc. A key part of this is building up the “supply” (e.g. tour operators). The current environment could be a catalyst for supply as weaker travel trends spur suppliers to look to Booking as a necessary source of demand. They continue to invest behind this despite the current environment including their payment platform which enables payment to companies like tour operators through their platform. They recently announced the launch of flights on Booking.com in the US.

·        Cost cutting and improved marketing efficiency likely to lead to profitability recovering before top line does. Big headcount reductions with more to come. Also cutting marketing expense which is the biggest part of their cost structure – typically ~30% of rev. This is an important lever for cutting costs. As direct traffic grows as a % of bookings (over 50% now and increasing), this is an area where margins can structurally improve over time.

·       Regulatory Risk – New regulatory framework that the European Commission is working on (Digital Services Act)  will focus on “gatekeepers.” The focus is on big tech platforms – BKNG could potentially be included in this. The implications are not yet clear. BKNG feels designating them as a gatekeeper would be a mistake as they do not have the dominant market share of other “gatekeepers” like Google. BKNG puts their market share of bookable room nights in Europe at 11%. 

·       Stock is cheap and expectations are reasonable. Trading at almost a 5% yield on 2021. Consensus is for revenue not to recover to 2019 baseline until 2023. Consistent w/ mgmt. commentary that it will be years and not quarters before the travel market returns to pre-COVID volumes.


Sarah Kanwal

Equity Analyst, Director


Direct: 617.226.0022

Fax: 617.523.8118


Crestwood Advisors

One Liberty Square, Suite 500

Boston, MA 02109

www.crestwoodadvisors.com


$BKNG.US

[category earnings ]

[tag BKNG]


CVS 3Q20 earnings summary

Key Takeaways:


Current Price: $65                            Price Target: $90

Position Size: 1.87%                        1-year Performance: -13%

  • CEO transition announced for February 2021, current CEO Larry Merlo will be replaced by Aetna President Karen Lynch – we’re not expecting any dramatic change to the company’s strategy following the change
  • 2020 guidance increased on the EPS and cash flow lines (higher on better working capital and underlying performance of the business)
  • CEO Merlo quote: “we identified the strategic need to round out our suite of assets with a national health plan business which led to the industry disrupting acquisition of Aetna, and this month marks our two year anniversary as one company and we are now leveraging our local presence and communities to deliver expanded and integrated services to people, wherever they are
  • Winning quote from the Deutsche Bank analyst during the Q&A session: “congratulations to Larry and to Karen and I’ll say […] it’s always good to see a peaceful transition of power
  • 6 millions Covid tests administered so far (or 70% of retail setting tests)
  • Flu vaccine administered August-October were up 78% y/y


Segments update:

  • Health Care Benefits: membership growth driven by government products up 24% y/y (Medicare and Medicaid) while commercial membership declined 4%
  • Pharmacy Services: revenue slightly down (-0.9%) due to some client losses and price compression, partially offset by Specialty Pharma growth. Operating income grew 12% due to purchasing economics and mix.
  • PBM: 98% retention rate
  • Retail/LTC: sales up ~6%, driven by increased prescription volume (+5.8%), higher front store sales (+2.2%), increased diagnostic testing. Profits were impacted by continued reimbursement pressure and additional COVID-19 costs


There are now 450 HealthHub across the US, in over 30 states. In 2021 CVS will expand the offering to add in-person behavioral health support. More visits are now to manage chronic services, which in addition to lowering ER visits and increase adherence to treatment will lower medical costs. Regarding its capital allocation, CVS continues to pay down debt, with the goal to achieve a low 3X leverage ratio.


Thesis on CVS

  • Market leader: largest pharmacy benefit manager (PBM) in the US. This gives CVS scale advantage and negotiating power with pharma companies to obtain better drug pricing discounts. Also the largest US pharmacy retailer, giving it more touch points with consumers/patients. Finally, market share leader in long-term care pharmacy sector thanks to its Omnicare acquisition.
  • Aetna acquisition makes it vertically integrated.
  • Stable and predictable top line and margin profile. CVS benefits from an ageing population in increasing needs of prescription drugs.
  • shareholder friendly, offering a 7% shareholder yield (5% share repurchase + 2.6% dividend yield)


$CVS.US

Category: earnings

tag: CVS

Zoetis 3Q20 earnings results

Key Takeaways:


Share price: $172                     Target Price: $182 NEW (from $177)

Position size: 2.36%                TTM return: +46%


  • Impressive sales growth of 15% (ex-FX):
    • + 18% in the US, driven by demand +21% in companion animals products (paraciticides, vaccines and dermatology products), and +13% in livestock products (rebound from Covid restrictions)
    • Market share gain in paraciticides (+6% share) thanks to Simparicia Trio introduction this year – and cannibalization below expected levels. The Trio offering is attarcting new customers.
    • +11% in International sales (ex-FX), with companion animal sales +20% (strong growth in China) and +6% livestock sales
  • Simparica Trio will continue to be a driver to growth going forward, with heavy investments behind it to gain market share ahead of a competitive launch sometime next year.
  • Potential launch in 1H2021 in Europe of the first injectable monoclonal antibody licensed for alleviation of pain associated with osteoarthritis in dogs.
  • In Q3, there wasn’t an increased number of vet visits, but rather an increase in spending per visit, a positive trend that will continue as long as people spend more time at home with their pet. 
  • There is also an increased use of diagnostics – a good thing as they recently acquired a diagnostics company
  • Guidance for the year increased on good Q3 results, but Q4 is expected to be more moderate
  • CEO quote: “animal health is a steady and reliable sector, even in times of economic hardship. The world’s fundamental need for nutrition, comfort and companionship, provided by animals, has proven durable and enduring over time”.


Updated guidance for 2020:

Revenue guidance increased now +7% to +8% (prior 3%-6%) due to better 3Q results than expected

EPS now $3.76-$3.81 from prior $3.52-$3.68


Zoetis investment thesis:

  • ·         Attractive industry profile: mid-single-digit growth rate, little generic threat, cash payers, pet sub-sector is very fragmented
  • ·         ZTS is a leading diversified animal pharma company that continues to innovate to fulfill unmet animal needs
  • ·         ZTS is growing above the industry rate and has proven resilient throughout economic cycle
  • ·         Experienced management team has proven successful in increasing revenue and margins since the IPO in 2013
  • ·         Good capital allocation strategy: M&A and capex spending have lifted sales and improved profitability

Vontier: recommend selling VNT and adding the proceeds to FTV – #researchtrades

After further review, we recommend selling the small VNT position that came out of the FTV spin-off and put the proceeds into FTV.


Reasons for the sale:


Risks are greater than opportunities:


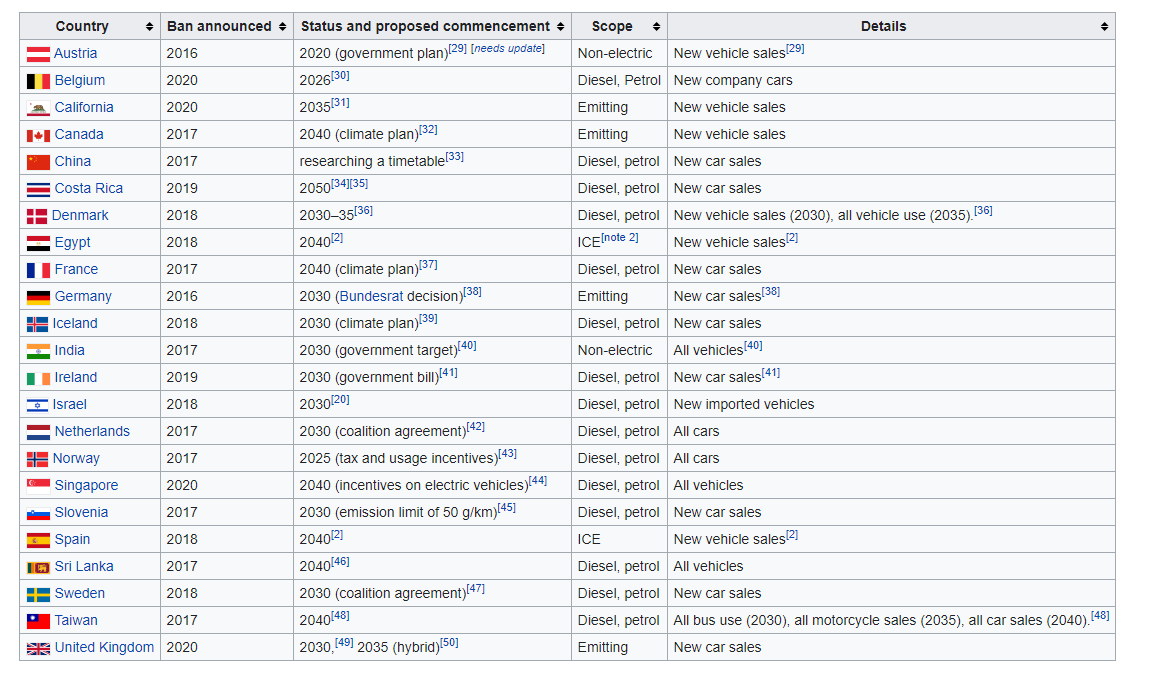
  1. 70% of 2019 sales came from their GVR business (retail fueling stations). We see the longer term risk no so much the decline in chip card readers in the US in 2021 (that can be offset by growth in other markets), but rather the upcoming obsolescence of gas stations as electric cars become a greater part of the vehicle pool globally. While currently only 1% of the car pool today, EV are estimated to be 10% of the car pool in 10 years. This could prove conservative as more countries ban ICE. And as car manufacturers increase production of EV that get better and better. The UK banning the sale of ICE starting in 2035 (including hybrid vehicles). France is planning the ban for 2040. Diesel cars will be banned sooner in some cities (2025 for Paris, Madrid, Mexico City, Athens). See the list below of all the countries that have announced an upcoming ban – this include China that is thinking about a ban as well.
  2. The switch to electric vehicles will also have an impact on their Matco Tools business (20% of sales): EV engines have 1/3 of the ICE engines maintenance. This is due to the fact that ICE engines contains hundreds of moving parts in its motor and drivetrain, vs. and EV engine that contains roughly 20. Less parts means less maintenance, and less trips to the auto repair shop.

While those two major risks to VNT are longer term in nature (short-term, the company could benefit from the increased sale of used cars due to COVID and emerging markets growth), it would require extensive M&A to shift the business towards the electric vehicle trend and/or the smart cities theme that is also growing but only 1% of sales today.


So what about Fortive now?

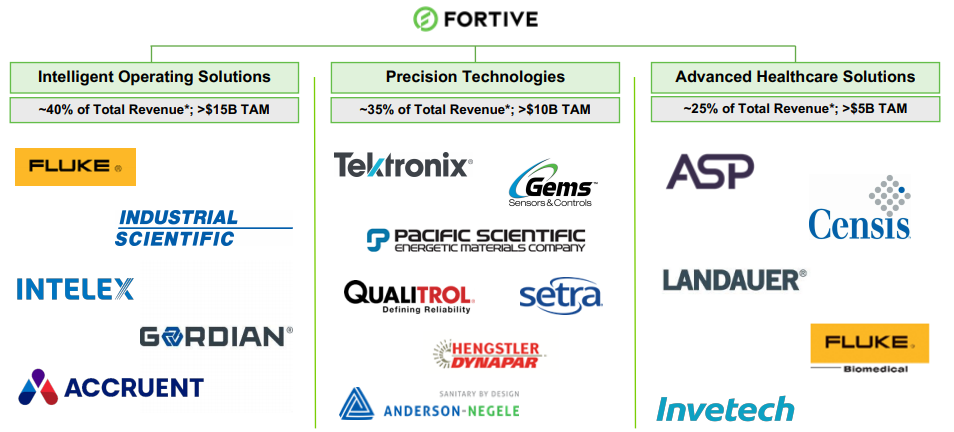
Fortive is focused on products that provide critical workflow solutions in productivity and safety. In addition to instruments that measure and control, they are also adding a set of Software solutions and data analytics capabilities.

3 segments targeting the control/sensor/measuring of liquids/gas/electricity in various end markets:


Some examples of what they actually make:

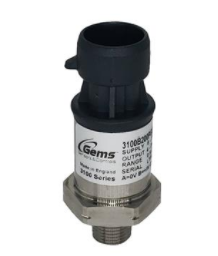
Gems: this company makes various sensors and control systems that find application in numerous end markets. Below are only a few:
  • In healthcare: pressure switch to measure the cooling system of medical imaging equipment, fluid control for medical lasers.
  • In the Alternative Energy space Gems makes sensors critical for wind turbines, by monitoring the hydraulic pressure that maintains the blade pitch, essential to maximize the amount of power generated, while protecting the blade from damage.

  • Gems sensors are also used by the Marine markets, both commercial and military. Since a picture is worth a thousand words, here’s where you can find their sensors on boats:


Dynapar: its products are also used across many end markets such as aerospace & defense, elevatorsm passenger rails and even medical imaging.
  • Example of and encoder used in the medical imaging field: MRI is a noninvasive diagnostic technique that uses nuclear magnetic resonance to produce cross-sectional images of organs and other internal body structures. Dynapar offers a range of industry duty encoders designed to comply with FDA manufacturing guidelines for MRIs and X-Ray imaging. In x-Ray machines our encoders move water in and out of the machine, while in CT Scan and MRI machines they move patients in and out and measure the rotating speed.”


Anderson-Negele: hygienic sensors for the food, beverages, and life sciences industries:  
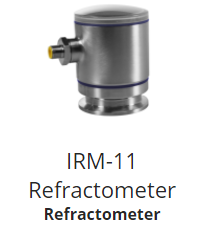
  • They have a product called a refractometer: it measures the sugar content in orange juice to guarantee a consistent taste experience (thank you!!).
  • Their turbidity sensor measures the wine clarity: even before the smell and taste experience, the color and clarity of the wine needs to be consistent and pleasant. A California-based wine maker installed the ITM-4 sensor to monitor the turbidity in their clarification process prior to bottling. This allowed increased production yields and consistent monitoring (Thank you again!!).


Thanks,

Julie

Schwab Q3 results

On 10/29, Schwab hosted their fall update for Q3, a quarter which had earnings of $.51. beating estimate of $.47.  Key takeaways are:

  • Schwab reported solid core new asset growth of 5%. 
  • Completion of the TD Ameritrade acquisition 
    • AUM jumps to $6.0t. from $4.1t
    • Expect cost savings of $1.8b-$2.0b over 2-3 years which will increase margins over 10%
    • SCHW is already the 7th most profitable company in the finance sector (on TTM pretax margin) and the cost synergies could increase margins 10 percentage points!
  • Low interest rates remain a headwind with Net Interest Margin (NIM) falling to 1.34%. 
  • Rising deposits up 52% yoy have helped offset falling NIM. 
  • Valuation remains attractive.


Despite lower interest rates, we remain optimistic that SCHW will continue to grow AUM significantly this year, leveraging its platform to drive ESP growth. 


Current Price: $41.64                     Price Target: $48 (up from $38)

Position Size:   1.85%                       Performance since initiation on 6/24/19: 8.8%


Q2 Highlights:

  • Total client assets rose to $6.0T, with core new asset growth of 5%. 
    • Client assets 6% annualized organic growth
    • Brokerage accounts 21% annualized growth
    • Focus on growing digital platform with 64% digitally active households
  • Net interest margin
    • Net Interest Margin (NIM) was 1.34% falling from 1.53% in Q2, more than offsetting the growth in deposits as interest revenue fell 14%. 
    • NIM will increase slightly with AMTD acquisition
  • Advice and Funds
    • Schwab fee based advice solutions assets grew to $361.2b up 13% YoY.
    • Schwab assets in proprietary ETFs up 12% to $168.9b
    • Expanding into bank loans with $22.3b up 32%
  • Profitability – industry leader
    • ROE 12% and 39.1% pre-tax profit margin.  Expect margins to expand 10% points over the next 2-3 years due to cost savings and scale from the mergers
    • Current expenses are elevated due to mergers
  • Capital allocation
    • Schwab will look to issue a preferred stock issue as growth in balance sheet and acquisitions will require more capital.  Share buybacks are on hold.
    • Dividend yield of 1.70%
    • Valuation is attractive at 19x earnings.  Target price set at 22x.

Schwab Thesis:


  • Expect Schwab’s vertically integrated business model to drive AUM growth.  Schwab has averaged 6% organic core net new asset growth as retail clients and advisors are attracted to Schwab’s low cost trading and custody services.
  • Conservative, well-managed firm who is a leader in online trading and focused on leveraging platform. 
  • Schwab will experience material AUM growth with USAA and TD Ameritrade mergers.  Expect SCHW to reduce costs and leverage platform.


Please let me know if you have any questions.


Thanks,

John


$SCHW.US


Travelers Insurance Q3 results

On 10/20, Travelers reported a Q3 EPS of $3.12, beating estimates of $2.99.  Positives for the quarter were improving margins, core return on equity of 13.5% and continued strong pricing gains in business and personal insurance lines.  Paradoxically, COVID-19 has improved profitability due to fewer claims in auto.


Travelers is a high quality, disciplined underwriter of insurance that is focused on returning capital to shareholders through dividends and share buybacks. 


Current Price: $123.92                           Price Target: $135 (raised from $120)

Position Size:   1.66%                              TTM Performance: -2.58% (up 14% since 9/30)


Thesis Intact. Key takeaways from the quarter:


  1. Core business results were solid, beating estimates

·         Combined ratio improved 6.6 points to 94.9%, ex-cats it improved 2.6 points to 91.5%

·         Net premiums increased 3%

·         Strong pricing with renewal premiums up:

    • Business +6.3%
    • Bond & specialty +8.1%
    • Personal Insurance +8.2%
    • International +7.3%

·         The industry has faced several headwinds – higher cat losses, negative tort trends and falling yields.  As a result industry wide pricing has been strongest in 10 years.

·         Losses related to COVID-19 total $133m driven primarily by worker’s compensation.  These loses were more than offset by lower claims in auto.  Net impact of COVID-19 has been a positive 2% points to the combined ratio.


  1. Net Investment Income rose $38m due to strong returns in private equity investments.


  1. Strong financial position
    • Debt to capital ratio of 22.7%
    • Most of debt is long term – just issued a 30yr bond yielding 2.5%
    • 97.9% of fixed income portfolio is investment grade with average rating of AA
    • Strong rankings from rating agency relative to peers


  1. TRV yields 2.7%.
    • No share buyback due to pandemic. TRV has built roughly $800m in excess capital.
    • Prior to pandemic, TRV has long record of returning capital to shareholders – past 10 years shares outstanding have fallen 53%!
    • Management has a history of employing capital wisely! Instead of investing in mature business with spotty pricing, they are returning excess capital to shareholders


  1. Current valuation of 12.2 P/E is close to historical mean.  Price target represents 13x 2021’s estimated earnings.


The Thesis on TRV:

  • We expect TRV will be able to grow book value per share in the mid-single digits over the near-medium term, and generate ROE in the 10-14% range
  • Industry leader with disciplined underwriting and investment portfolio track record  
  • Consistent returns in the low to mid double digits
  • Responsible capital allocation and proven desire to act in the best interests of shareholders


Please let me know if you have any questions.


Thanks,

John


$TRV.us