Current Price: $1,482 Price Target: $1,650
Position Size: 5.2% TTM Performance: +26%
Key takeaways:
· Alphabet reported better than expected results. Revenues better than feared- down 2% YoY (flat in constant currency).
· Advertising down 8% driven by mix of small-to-mid sized business and exposure to heavily hit industries like retail and travel. Advertising improved toward the end of Q2 through July.
· Strong growth in non-Ad revenues, particularly from Cloud, Google Play and YouTube Subscriptions.
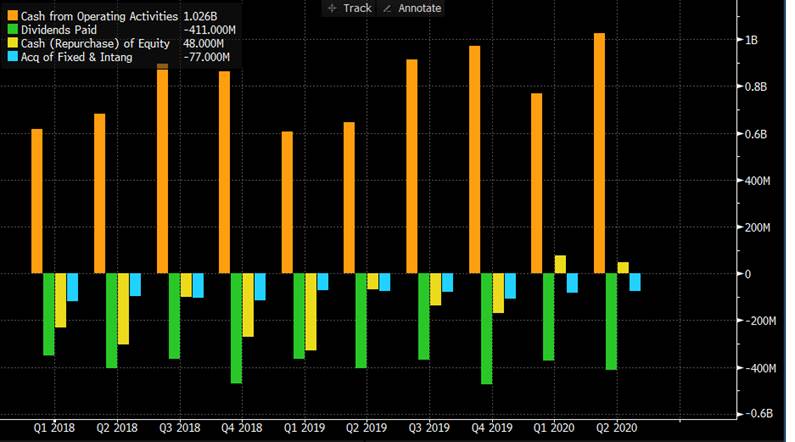
· Share buyback authorization increased $28B.
· CEO, Sundar Pichai said…”We see two distinct trends as businesses embrace the future of work. First, the future of business will be more digital. Customers are choosing Google Cloud to either lower their costs by improving operating efficiency or to drive innovation through digital transformation….Second, the future of work will be more collaborative. Virtual collaboration is critical in order to adapt and succeed in the changing global landscape.”
Additional Highlights:
· Total revs were $38.3B down 2% YoY (flat in constant currency). YoY declines in ad revenues from Search and Network were offset by growth in Google Other and Google Cloud revenues.
· “Like other companies, this quarter we saw the early signs of stabilization as users return to commercial activity online. This is true across most of our advertising verticals and geographies. Of course, the economic climate remains fragile.”
· Google Shopping came up multiple times on the call. Looking to help merchants lower their cost and increase their reach like removing the commission for merchants to be on the platform. Also opening their platform to 3rd party providers including PayPal and Shopify.
· Search revenue ($21.3B) -10%. saw a gradual return in user search activity to more commercial topics throughout the quarter, followed by an increase in spending by advertisers with Search revenues essentially flat to last year by the end of June.
· YouTube ad sales ($3.8B) were +6%, growing faster than search revenues. Ongoing substantial growth in direct response, offset by a continued decline in brand advertising which then moderated toward the end of the quarter.
o YouTube watch time has also significantly increased, particularly live streams. Andrea Bocelli’s live stream on Easter had 39m views.
o YouTube brand advertising growth accelerated in the first two months of the quarter, but started to experience headwinds in the middle of March.
o Direct response ads continued to have substantial year-on-year growth throughout the entire quarter.
· Network ad revenues: $4.7B, -10% YoY, trends improving somewhat towards the end of the quarter as advertisers’ spend began to return.
· Google cloud (GCP and G Suite): was $3B, +43%.
o Overall, the deceleration in Google Cloud revenue growth in 2Q reflects the fact that G Suite lapped a price increase that was introduced in April last year.
o GCP, however, maintained the strong level of revenue growth it delivered in Q1 and its revenue growth was again meaningfully above Cloud overall. Growth again led by Infrastructure offerings and Data and Analytics platform.
o Saw headcount increases.
o Called out GCP clients: Keurig, Dr. Pepper, Deutsche Bank, Loews, Telefonica, Orange, also helping many government agencies deliver care for their citizens, including the States of Oklahoma and New York, and Italy and Spain.
o G Suite maintained healthy growth in average revenue/seat as well as seat growth, which does not include customers who took advantage of free trials as they shifted their employees to WFH.
o Saw continued demand from customers using G Suite to help their employees work-from-home, including Wipro in India and expanded their relationship with the State of Arizona.
o Meet: In Q2, we peaked at more than 600 million Meet participants in a single week. As one example, PwC employees reached nearly 10 million hours of video conferencing in Google Meet in a single month.
· Other Revenues ($5.1B, +26%) – primarily driven by growth in Play and YouTube non-advertising revenues. Google Play App and Game downloads were up more than 35% year-over-year.
· Other Bets – Waymo announced Fiat Chrysler as strategic partner for L-4 autonomous technology across their full portfolio. Also entered into a partnership with Volvo Car Group to integrate the Waymo Driver into an all-new electric vehicle platform for ride-hailing services.
· Margin contraction: driven by higher costs associated with depreciation, data centers, higher content acquisition costs for YouTube, and headcount (up 4,450 from Q1). Most sizeable headcount increases were again and Google Cloud.
· Total TAC was $6.7B or 22% of total advertising revenues, and down 8% YoY. Slightly up as a % of ad revs given decline.
· Outlook: No specifics.
o “Ads revenue gradually improved during the quarter across Search, YouTube and Network. However, we believe it is premature to gauge the durability of recent trends, given the obvious uncertainty of the global macro environment.” Advertising spending closely correlates with the overall health of the economy.
o Continue to plan for lower capex largely driven by lower real estate expense.
o Overall spend on tech infrastructure should be the same YoY. More spend on servers than on data center construction.
o Although we still expect the pace of headcount growth to decelerate somewhat in 2020, we’re continuing to hire aggressively in priority areas like Cloud.
· Q2 FCF was $8.6B and they ended the quarter with cash of $121B. They have ~11% of their market cap in net cash. The stock is still reasonably valued, trading at a ~4% FCF yield on 2021.
Sarah Kanwal
Equity Analyst, Director
Direct: 617.226.0022
Fax: 617.523.8118
Crestwood Advisors
One Liberty Square, Suite 500
Boston, MA 02109
www.crestwoodadvisors.com
$GOOGL.US
[category earnings ]
[tag GOOGL]
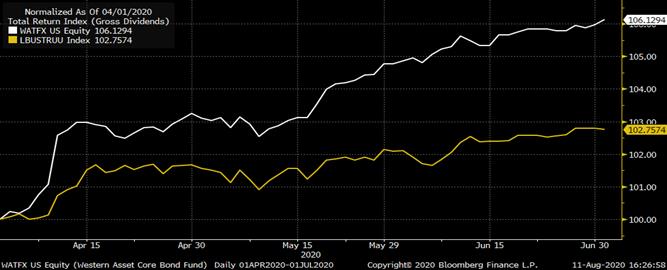
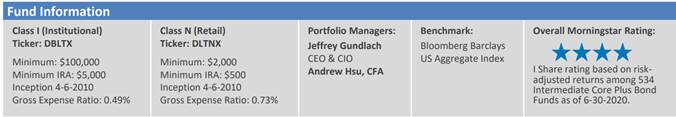
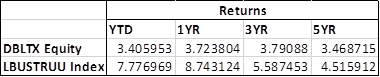
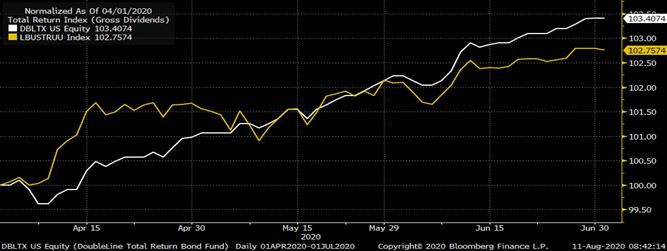
 Increasing allocation to investment-grade corporate bonds