Research Blog – INTERNAL USE ONLY

CSCO 2Q20 Update

Key Takeaways:

1.       Earnings results better than expected and guidance was in-line, the stock is down because management indicated on the call that the same macro-economic  factors they outlined a quarter ago continue to impact end customer spending. They continue to see elongated deal closures and scaled down or deferred projects.

2.       While weakening business confidence and a resultant slowdown in enterprise spending is a headwind for them, the secular drivers that Cisco stands to benefit from are still early stages and a looming tailwind and thus not offsetting the current macro weakness they are seeing.

3.       Their business transformation continues as their revenue mix shifts more toward more software and subscription.


Current Price: $47                            Target Price: $63

Position size: 4.5%                          TTM Performance: -1%


CSCO reported better than expected Q2 results, beating on revenue (-3.5% YoY) and EPS and guided in-line with consensus.  Q3 Revenue growth guided to -1.5% to -3.5%. Their higher mix of subscriptions is negatively impacting the top line by ~100bps. The weakness this quarter was attributed to a continuation of the weak macro environment they discussed last quarter, not company-specific issues. In August they first talked of early signs of macro weakness. That trend increased over the fall and has continued. Similar to other companies, management points to declining business confidence from uncertainties related to a  US/China  Trade  War,  Brexit, pending  election  year,  conflict  in  Hong  Kong and now the Coronavirus. While a slowdown in enterprise spending is a headwind for them, the secular drivers that Cisco stands to benefit from are intact. Long-term, Cisco stands to benefit from a product refresh cycle and evolving network demands that ultimately are driven by increasing data traffic. With rising data traffic, technologies are changing (5G, IoT, WiFi 6, AI) and networks are becoming more complex – Cisco’s products help companies solve for that by helping them simplify, automate, and secure their infrastructure. The difficult thing for Cisco right now is that these technologies are still early stages and still a looming benefit and thus not offsetting the current macro weakness they are seeing. Forward FCF yield is ~7%, and is supported by an increasingly stable recurring revenue business model and rising FCF margins. Their capital return program should limit downside – buying back shares and the 3% dividend yield that’s easily covered helps provide a floor.


Thesis intact, highlights from the quarter:

·         Guidance was in-line, and they tend to guide conservatively. They don’t miss relative to the quarterly expectations they set for themselves. They have hit (or beat) their guided top line sales numbers in 51 of the past 52 quarters. This suggests that the weakness the have been seeing may be turning a corner given sales guided -2.5% at the midpoint (w/ -100bps impact from transition to subscription). This should improve as the year progresses and they lap easier compares (which have been especially difficult this quarter and last quarter).

·         Order trends were broadly weaker as sales cycles elongated. Management again talked about smaller deal sizes and longer approval processes across industries.

·         Product mix continues to improve with more software/subscription. By year end, they target 50% of their revenue to be from software and services.  Subscription revenue was 72% of total software revenue, up 7pts YoY.

·         Operating margins improved, benefitting from the positive impact of rising software mix. This transition will continue to drive an upward trend in CSCO’s margins over the next several years.

·         By segment: Security was the strongest segment (+9% YoY) Infrastructure Platforms was the weakest (-8% YoY) segment, again driven by Service Provider routing. This should improve as Service Providers begin to build out the core of their networks for 5G. Management commented on the continued strength in the ramp of key new products  – Catalyst 9000 and Nexus 9000 (both sold w/ 3-5yr software agreements). Service revenue was up 5%, driven by software and solution support.

·         By end markets: Public sector was flat, enterprise was -7%, commercial was -4% and service provider was -11%.

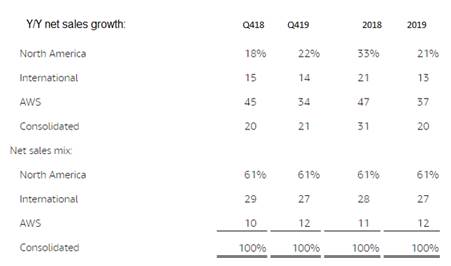
·         By geography: Americas was down 8%, EMEA was down 1% and APJC was down 4%. Total emerging markets were down 7% with the BRICS plus Mexico were down 20%.


Valuation:

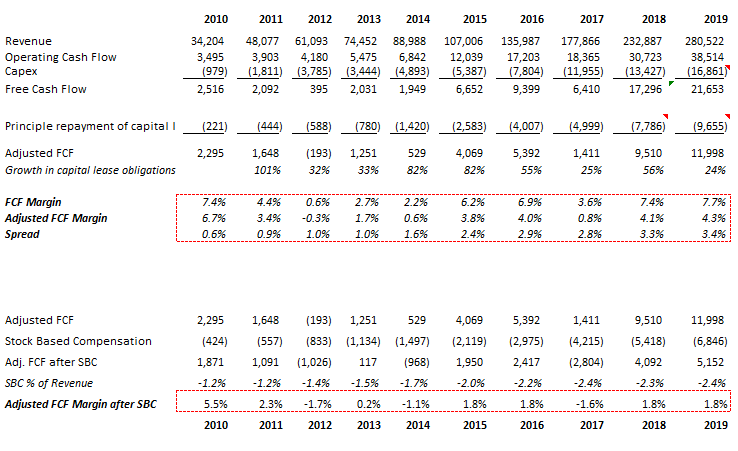
·         They have a 3% dividend yield which is easily covered by their FCF.

·         Capital allocation strategy of returning a minimum of 50% of their FCF to shareholders annually through share repurchases and dividends. Their annual dividend is $6B.

·         Forward FCF yield is ~7%, and is supported by an increasingly stable recurring revenue business model and rising FCF margins.

·         The company trades on a hardware multiple, but the multiple should expand as they keep evolving to a software, recurring revenue model. Hardware trades on a lower multiple because it is lower margin, more cyclical and more capital intensive.

Thesis on Cisco:

·         Industry leader in strong secular growth markets: video usage, virtualization and internet traffic.

·         Cisco is the leader in enterprise switching and service provider routing and one of the few vendors that can offer end-to-end networking solutions.

·         Significant net cash position and strong cash generation provide substantial resources for CSCO to develop and/or acquire new technology in high-growth markets and also return capital to shareholders.

·         Cisco has taken significant steps to restructure the business which has helped reaccelerate growth and stabilize margins.


$CSCO.US

[tag CSCO]

[category earnings]


Sarah Kanwal

Equity Analyst, Director


Direct: 617.226.0022

Fax: 617.523.8118


Crestwood Advisors

One Liberty Square, Suite 500

Boston, MA 02109

www.crestwoodadvisors.com


PLEASE NOTE!

We moved! Please note our new location above!


Fortive (FTV) 4Q19 earnings summary

Key Takeaways:


·         Slow down continues in short-cycle business but had some stabilization in North America

·         The Fortive Business System (concept of continuous improvement) has proven its value with margin expansion despite the top line slow down

·         The filing for the IPO of Vontier is targeted for Q1 2020 but the management team wants to do things when time is right

·         We still see upside to the current company, but we’ll have to re-evaluate the stock once we get more information on the 2 entities later this year


[more]


Current Price: $78.5            Price Target: $86 (updated last quarter)

Position Size: 2.27%            1-year performance: +4.6%


Fortive released its 4Q19 earnings, with core sales growth of 0.4% (+14% reported due to recent acquisitions), a continuation of prior quarters slow down. But Fortive showed its strength in leveraging the business even with slower sales: margins expanded 60bps (+150bps excluding recent M&A) and EPS increased 13%. FCF also increased this quarter, up 17% y/y.

The short-cycle businesses continue to face a slowdown (Fluke & Tektronix) in China and Western Europe but North America is stabilizing. The retail fueling upgrade continues to grow in the US (with an October 2020 deadline to convert the stations to the chip enabled payment centers). Their GVR business is gaining traction in installing EV- charging stations in its legacy client base. And at Matco, new products introduction is driving sales growth in the MSD rate.


The management team introduced its 2020 guidance:

·         Core Revenue Growth (Y/Y): low single digits

·         Core operating margin: +50bps

·         Adjusted Operating Margins: ~22%

·         Adjusted Diluted EPS: $3.68 to $3.78 (+6% to +9%)

·         The coronavirus is expected to have a minus impact ($0.02/share) in Q1


By the end of 2020, Fortive will separate into 2 companies: Fortive (the industrial technology company) and Vontier (the retail and commercial fueling, fleet management, and automotive service and repair solutions). So far, FTV has accomplished the following steps towards the split: announced key members of the senior management team, launched the brand, and made progress against other significant milestones over the past few months.


FTV Thesis:

          Market leader:

·         Leadership position in most of the markets they serve

·         Experienced leadership team

·         Above industry margins with strong cash flows

          Quality:

·         FCF yield ~5%

·         Organic growth target of 3-3.5% (4-5% in last 2 quarters after being under the target in prior quarters)

·         M&A strategy to enhance top line growth

·         Margins expansion from new products introduction, continued application of the Fortive Business Systems and M&A integration

          Shareholder friendly:

·         Management team focused on shareholder wealth creation through top line sustainability and margin expansion

$FTV.US

Category: earnings

Tag: FTV


Julie S. Praline

Director, Equity Analyst


Direct: 617.226.0025

Fax: 617.523.8118


Crestwood Advisors

One Liberty Square

Suite 500

Boston, MA 02109


www.crestwoodadvisors.com


Sensata (ST) 4Q19 earnings summary


Key Takeaways:


·         4Q19 results were better than expected as content growth story continues (Sensata’s strategy is to grow the amount of sensors used in a car over time – by making more sensors that answer a manufacturer’s need to comply to changing regulations for example)

·         Coronavirus impact on 2020 results was clearly quantified by the management team, which lifted some concerns on the name

·         2020 guidance showed the power of the company’s strategy, even when end-markets show some weakness

·         Sensata is still attractively priced, with a FCF yield of 5.3%


[more]


Current Price: $50              Price Target: $61

Position Size: 2.10%          1-year Performance: +2.4%


Sensata released 4Q19 results, with organic sales contracting -0.8%, better than guidance and expectations, thanks to strength in its Industrials segment. Free cash flow was better than guided and in line with the prior year, reflecting a better conversion rate from net income. This past quarter, operating income was impacted by sales deleverage, some productivity headwinds and design & development investments. During the year, ST reduced its share count by ~5%, a wise capital allocation decision by the management team in times of high M&A prices and a stock price still attractively priced.


Segments review:

·         Automotive organic sales decline of -1%: Sensata outgrew this sector by 490bps, thanks to strong content growth in China (double digit growth), but negative impact of the GM strike in North America and softness of European exports to China

·         HVOR organic revenue growth was -2% y/y: Sensata outgrew this sector by 1190bps, thanks to content growth in China as OEM prepare for the implementation of the China VI regulations

·         Aerospace & industrial: organic growth was +1%: thanks to the double digits aerospace growth


The management team provided guidance for 2020 of -1% to +2%, reflecting the impact of the coronavirus on factory closures and supply chain disruptions ($40M sales impact and $20M operating profit hit that will not be recovered later in the year). Without this one-time (hopefully) event that is the virus outbreak, sales and profits would have shown a return to stable demand, which is what consensus was expecting. 1Q20 will be the weakest with -8% to -6% organic growth (Coronavirus impact). The management team assumes global auto market production to decline 5% y/y, China auto down 6% y/y, and the global HVOR market down 9% y/y.


The Thesis on Sensata

  • Sensata has a clear revenue growth strategy (content growth + bolt-on M&A)
  • ST is diversifying its end markets exposure away from the cyclical auto sector over time through acquisitions, also expanding its addressable market size
  • ST is a consolidator in a fragmented industry and still has room to acquire businesses
  • Margins should expand as the integration of the prior two deals is under way, regardless of top line growth, and efficiencies in manufacturing are continuously pursued as they are gaining scale
  • ST is deleveraging its balance sheet post acquisitions, leaving room for future M&A or a return to share buybacks, and improving EPS growth


http://investdigest.net/wp-content/uploads/2020/02/image001.jpg


Tag: ST

category: earnings

$ST.US


Julie S. Praline

Director, Equity Analyst


Direct: 617.226.0025

Fax: 617.523.8118


Crestwood Advisors

One Liberty Square

Suite 500

Boston, MA 02109


www.crestwoodadvisors.com


CVS 4Q19 earnings summary

Key Takeaways:


·         On track with its Aetna integration to become an integrated health-care solutions provider

·         Integration synergies ahead of initial guidance for 2019 and 2020

·         2020 guidance is underwhelming but most likely conservative


Current Price: $73                            Price Target: $90

Position Size: 2.35%                        1-year Performance: +10%


This morning CVS published its 4Q19 earnings results, beating consensus estimates as every segments provided positive results. CVS is going through a multi-year integration process of its acquisition of Aetna. While CVS’s CEO said the integration was successful during the call, the prior Aetna CEO made some noise earlier this month by saying he was being pushed out of the board and that the integration was “far from over”. So far integration synergies are ahead of the initial plan, so we’ll take that as a sign that things are progressing in the right direction. It will most likely take another year before we see greater leverage on the top and bottom line of the integration and offering of better solutions to clients. CVS will be


Segment details:

·         Pharmacy services: revenues up 6.2% thanks to higher claims volume although generics dispensing rate increased (lower prices)

·         Retail/Long-term care: revenues +2.5% due to higher prescription volume but reimbursement and generic pressure

·         Retail pharmacy: same-store-sales +3.2% with front store sales up 0.7% and pharmacy sales +4.1% (driven by continued adoption of patient care programs)

·         Health care benefits: year-end membership was in line with expectations


Initial 2020 guidance:

·         Sales up 2-3.5%

·         EPS of $7.04-$7.17 (consensus $7.15), a 3-5% growth y/y, but we would not be surprised to see this number go up as the year progresses

·         Integration synergies expected to be $800-$900M

·         Enterprise modernization expected to drive a benefit of $450-$550M

·         600-650 HealthHub locations by the end of the year

·         CFO of $10.5-$11B

·         Leverage ratio to be in the low 3x in 2022


Thesis on CVS

  • Market leader: largest pharmacy benefit manager (PBM) in the US. This gives CVS scale advantage and negotiating power with pharma companies to obtain better drug pricing discounts. Also the largest US pharmacy retailer, giving it more touch points with consumers/patients. Finally, market share leader in long-term care pharmacy sector thanks to its Omnicare acquisition.
  • Stable and predictable top line and margin profile. CVS benefits from an ageing population in increasing needs of prescription drugs.
  • shareholder friendly, offering a 7% shareholder yield (5% share repurchase + 2.6% dividend yield)


$CVS.US

Category: earnings

tag: CVS


Julie S. Praline

Director, Equity Analyst


Direct: 617.226.0025

Fax: 617.523.8118


Crestwood Advisors

One Liberty Square

Suite 500

Boston, MA 02109


www.crestwoodadvisors.com


Hilton 4Q19 Results

Key takeaways:

1.       Current RevPAR trends are slowing, but still expected to be slightly positive in 2020.

2.       Their asset light model and solid net unit growth means they are less sensitive to macro driven RevPAR trends. Despite weakening RevPAR, Hilton continues to grow EBITDA and FCF/share aided by 6-7% unit growth, and a robust pipeline that represents 40% future room growth.

3.       Coronavirus is not in guidance, but likely not more than -1% impact to overall FY RevPAR and 50bps impact to unit growth. This could be ~-1% to -2% impact to FY20 EBITDA (China is only 2.7% of their EBITDA). They have shut down 150 hotels (33k rooms) in China which they are estimating could be closed for 3-6 months and an additional 3-6 months of recovery period.


Share Price: $114               Target Price: Raising to $137 from $105

Position Size: 3%              1 Yr. Return: 55%


Hilton beat on revenue and EPS – Q4 RevPAR was slightly below expectations, offset by higher licensing fees. On ~1% FY19 RevPAR growth, they grew EBITDA 10% and EPS 14%, demonstrating the strength of their asset light business model and strong unit growth. While RevPAR is weakening, Hilton’s robust development story means they are a lot less dependent on macro driven RevPAR. Their business model is structurally different than it was last cycle because they own fewer of their hotels and instead receive high margin management and franchise fees. About 7% of their EBITDA is generated from owned hotels vs over 40% in the last recession – this asset light model means less operating leverage and a less volatile earnings stream if RevPAR continues to weaken. Moreover, unit growth will aid EBITDA growth regardless of RevPAR trends. (RevPAR = revenue per available room. It’s their total room revenue divided by their total number of rooms). Their development pipeline is delivering 6-7% unit growth and has some countercyclical aspects. In 2019 they returned more than 8% of their market cap to shareholders in the form of buybacks and dividends. The stock is undervalued, trading at ~4.5% FCF yield on 2020.


Highlights:

·         Currency neutral system-wide RevPAR was -1% for Q4 and +0.8% for the full year. They maintained 2020 RevPAR guidance of 0% to +1% and expect 2020 net unit growth of 6-7%.

·         Q4 by geography – Q4 US RevPAR fell 80 bps, on softer business travel. Europe was +1.4%, Overall AsiaPac was -3.8% and w/in that China was -7.8% (includes impact from Hong Kong), Middle East & Africa was -4.3% (political tensions in Lebanon and supply growth in the UAE continued to pressure rate). Full year stats in chart below.

·         Softer business travel negatively impacted results in the US. Corporate demand (transient and group) drives 70%+ of HLT’s business system-wide.

·         Solid pipeline continues to drive capital efficient growth – Current pipeline represents close to 40% unit growth or 387k rooms. That is several years’ worth of growth w/ over 50% of that pipeline under construction, the majority of which are outside the US. More than 90% of their deals do not require any capital from them.

·         In a sensitivity analysis to a market downturn, mgmt. said they would expect flat to slightly positive growth in adjusted EBITDA and positive growth in free cash flow in an environment where RevPAR were to decline 5% to 6%. This is b/c unit growth will aid EBITDA growth regardless of RevPAR trends.

·         Continued strength in their market leading RevPAR index = counter-cyclicality – RevPAR index is their RevPAR premium/discount relative to peers adjusted for chain scale. They are the market leaders – this is helpful because it’s what leads to pipeline growth (hotel operators want to associate w/ the brand that yields the best rates and occupancy) and is helpful in a macro downturn because it’s even more crucial for a developer to be associated with a market leading brand to get financing. i.e. they would likely take more pipeline share if lending standards tighten. The other countercyclical aspect of their pipeline growth is conversions (an existing hotel changes their banner to Hilton). I.e. Hampton Inn (35 year old brand) has a RevPAR index of 120.

·         Loyalty members hit 104m and account for >64% of system-wide occupancy. Loyalty members continues to grow and % penetration continues to improve – both of which bode well for LT RevPAR trends as they typically see a doubling of wallet share once a customer signs up for the loyalty, and share improves w/ status level.  They get 75-80% share of hotel wallet from Diamond Honors customers.

·         In 2019 they returned more than 8% of their market cap to shareholders in the form of buybacks and dividends.

·         The stock is undervalued, trading at ~4.5% FCF yield on 2020.


Investment Thesis:


       Hotel operator and franchiser with geographic and chain scale diversity of 17 brands, 6,100 hotels and 970k rooms across 119 countries (Hilton, DoubleTree, Hampton Inn & Hilton Garden Inn ≈ 80% of portfolio).

       Network effect moat of leading hotel brand and global scale lead to room revenue premiums and lower distribution costs.

       Shift from hotel ownership to franchising results in resilient, asset-light, fee-based model.

       Record pipeline generating substantial returns on minimal capital will lead to increasing ROIC and a higher multiple.

       Unit growth and fee based model reduce cyclicality – Lower operating leverage vs ownership reduces earnings volatility and unit growth offsets potential room rate weakness.

       Generating significant cash which is returned to shareholders through dividends and buybacks.


$HLT.US

[category earnings]

[tag HLT]


Sarah Kanwal

Equity Analyst, Director


Direct: 617.226.0022

Fax: 617.523.8118


Crestwood Advisors

One Liberty Square, Suite 500

Boston, MA 02109

www.crestwoodadvisors.com


FW: AAPL Q1 – Big Beat and Raise


AAPL reported a very strong quarter beating across segments except a minor miss on services. They raised guidance for next quarter well above the street. iPhones sales were a big positive surprise at up 7.6% YoY vs expected down ~1%. Encouragingly Greater China returned to growth, which helped with the iPhone beat. The coronavirus will have an impact on supply given Apple’s manufacturing footprint in China and will also have an impact on sales within China given some store closures. All of this is factored into their above consensus guidance.  


Key Takeaways:

·         Revenue was up 9% YoY.

·         iPhone 11 continues to be their best-selling iPhone.

·         Mac and iPad sales were down 3% and 11% YoY, respectively. The comparison was tough due to new launches a year ago.

·         Big beat on Wearables, Home & Accessories category – set all-time records for both Apple Watch and AirPods.. The strong wearables results were in spite of supply constraints for both the Apple Watch Series 3 and Airpods Pro.

·         Active installed base of devices has now surpassed 1.5 billion.

·         Services growth decelerated very slightly to ~17% – saw double-digit growth in all regions. The miss here will probably be a focus in the news given that the LT story on Apple rides on this category. However, they are still in the early stages of ramping their opportunity with services. Including several new services that aren’t making much of a contribution yet (Arcade, Apple News+, Apple TV+). A key advantage Apple has is its uniform operating system across devices. The smartphone market is dominated by two operating systems, Apple’s iOS and Android. Apple has mid-teens % of the global market and Android has almost all the rest. However, Android’s operating system is fragmented across multiple manufacturers which can make app development for Android more difficult than for iOS. Apple’s iOS ties in a growing ecosystem of devices including wearables and they have a wealthier installed base that is more likely to pay for Apps. I think this could become more important with 5G because taking advantage of 5G across devices requires app development. 5G’s faster speeds and lower latency will enable new Apps that let people do more with their wireless devices. For instance, Apps that take advantage of artificial intelligence, augmented reality and IoT (Internet of Things). 4G enabled things like Uber and a slew of food delivery apps and Netflix and Facebook on your phone.

·         On a run rate basis with the results of the December quarter they’ve already reached their goal of doubling their fiscal year ’16 Services revenue during 2020.

·         Tim Cook suggested the potential for them to do targeted video advertising in a way that would not infringe on privacy though he wouldn’t “speculate” as to whether they would actually take advantage of that opportunity. This probably depends on the success of Apple TV+ as a subscription service. It does suggest that if they don’t get a lot of subscribers they have an alternate video strategy.

·         China – iPhone sales were up double-digits. Services and wearables were also up double-digits, Cook says iPhone 11 is doing particularly well there. Trade-in and finance programs were also well received

·         Impact from Coronavirus – Apple does have some suppliers in the Wuhan area. There are alternatives and Apple is looking for increases from them. Factories are starting back up after the Lunar Holiday on Feb. 10 which is later than expected. All of that is factored into guidance and management pointed to that as the reason for a wider than usual top line guidance range. One of their retail stores has been closed, and some partners have closed stores or reduced operating hours. Sales within the Wuhan area are small, but retail traffic across China has been reduced. Again, Apple has accounted for this in its outlook.

·         Apple Pay, revenue and transactions more than doubled year-over-year with a run-rate exceeding 15 billion transactions a year.

·         They reiterated goal of being net cash neutral “over time.”


Valuation:

·         Trading at about a 1% dividend yield, and ~4.7% FCF yield.

·         They have about $99B in net cash on the balance sheet. That’s about 7% of their market cap.

·         The stock is still reasonably valued and continued buyback from management’s goal of net cash neutral will support valuation.

·         In addition to the $99B in net cash they already have, they produce >$65B in FCF annually (that’s more than all the other FAANGs combined). This suggests they could buyback over 20% of their current market cap over the next 3 years.  


The Thesis for Apple:

  • One of the world’s strongest consumer brands and best innovators whose product demand

has proven recession resistant.

  • Halo effect -> multiplication of revenue streams: AAPL products act as revenue drivers

throughout portfolio – iPhone, iPod, MacBooks, iPad > iTunes, Apps, Software, Accessories,

  • Strong Balance and cash flow generation.
  • Increasing returns to shareholders via dividends and buybacks.


$AAPL.US

[category earnings]

[tag AAPL]


Sarah Kanwal

Equity Analyst, Director


Direct: 617.226.0022

Fax: 617.523.8118


Crestwood Advisors

One Liberty Square, Suite 500

Boston, MA 02109

www.crestwoodadvisors.com


SHW 4Q19 Update


Current Price: $567        Price Target: $660

Position Size: 3.4%         TTM Performance: +45%


SHW missed on revenue and earnings. Miss was driven by softness in certain industrial end markets and choppiness in their international businesses. This was offset by strength in the America’s group (their chain of paint stores) and growth with their largest North American retail partners. They again had strong paint stores SSS performance of ~5%. In terms of 2020 outlook, management said they expect a similar environment with North American architectural demand remaining solid and industrial demand remaining variable by geography and end market. Last quarter they called out the same weakness.


Key Takeaways:

·         For full year 2020, they expect sales to increase 2% to 4%. By segment, they expect the Americas Group to be at or above the high end of that range. They expect Consumer Brands to be flat or slightly up and Performance Coatings to be up low-single-digits.

·         Guided to adj. 2020 EPS of $22.70 to $23.50 (+9.4% at the midpoint). This is below consensus of $24.33.

·         Management expects flat raw material costs for 2020, with 1H being down slightly.

·         They gave multiple data points on the strength they are seeing in US commercial and residential end markets including contractor and builder sentiment and strengthening in single and multifamily permits.

·         “We enter 2020 well positioned and focused on what we can control.”

·         For FY19 margins increased in all 3 segments. Gross margin expanded as pricing initiatives offset the raw material inflation they have experienced since 2017.

·         The Americas Group:  55% of sales, +5% in Q4

o   SSS of +5%. Prices increases will be a tailwind to 2020 SSS.

o   Opened 62 net new stores for the year.

o   Professional painting contractor customers continue to report strong demand.

·         Consumer Brands Group: 16% of sales, +1% in Q4

o   Q4 growth due to selling price increases and higher volume sales to some of the group’s retail customers.

o   Full year segment sales decreased due to lower than expected sales in Asia and Australia and the impact of the Guardsman divestiture.

o   Supply chain efficiencies, pricing initiatives, moderating raw material costs aided margins

·         Performance Coatings Group: 29% of sales, -5% in Q4

o   Softer sales outside of North America and unfavorable currency translation, partially offset by selling price increases.

o   Sales for the year were variable by geography and end market. Growth in North America and Latin America was more than offset by softness in Europe and Asia. Mid-single-digit growth in packaging and coil lines was offset by softness in other product lines, most notably industrial wood.

Valuation:

  • Expected free cash flow of ~$2.2B in 2020, trading at >4% FCF yield.
  • Given growth prospects, steady FCF margins and high ROIC the stock is undervalued. They deserve a premium multiple based on large exposure to the N. American paint contractor market and lack of exposure to the cyclical sensitive auto OEM end market.

·         Share buybacks should increase in 2020 as their leverage ratio is now below target of 3x.


Thesis:

  • SHW is the largest supplier of architectural coatings in the US. Sherwin-Williams has the leading market share among professional painters, who value brand, quality, and store proximity far more than their consumer (do-it-yourself) counterparts.
  • Their acquisition of Valspar creates a more diversified product portfolio, greater geographic reach, and is expected to be accretive to margins and EPS. The combined company is a premier global paint and coatings provider.
  • SHW is a high-quality materials company leveraged to the U.S. housing market. Current macro and business factors are supportive of demand:
    • High/growing U.S. home equity values. Home equity supportive of renovations.
    • Improving household formation rates off trough levels (aging millennials).
    • Baby boomers increasingly preferring to hire professionals vs. DIY.
    • Solid job gains and low mortgage rates support homeownership.
    • Residential repainting makes up two thirds of paint volume. Homeowners view repainting as a low-cost, high-return way of increasing the value of their home, especially before putting it on the market.


$SHW.US

[category earnings]

[tag SHW]


Sarah Kanwal

Equity Analyst, Director


Direct: 617.226.0022

Fax: 617.523.8118


Crestwood Advisors

One Liberty Square, Suite 500

Boston, MA 02109

www.crestwoodadvisors.com


FW: AMZN Q4 Results


Amazon reported Q4 revenue above consensus forecasts, with the company exceeding the high-end of its revenue guidance for the first time since 1Q18. AWS revenue grew +34%. The big positive surprises in the quarter were an acceleration in N. American revenues (chart below) and better than feared AWS sales (estimates had been coming down). The AWS result (+34%), while a deceleration, was a relief given concerns of an even bigger deceleration from share losses to Azure. Operating income came in above consensus though margins contracted ~80bps YoY.


Guidance: Management guided to Q1 revenue of $69B – $73B vs. consensus of $71.6B. Guidance implies growth of +16% to +22% YoY. They guided Q1 operating income of $3B – $4.2B vs. consensus of $4.1B, but this guidance includes an ~$800m lower depreciation expense due to an increase in the estimated useful life of servers.


N. A. Retail sales up, but profitability down: Online (+15% in Q4) and 3rd party seller services (+31% in Q4) both accelerated from Q418. Since third party fees grew faster than online sales, either their share of gross merchandise volume (GMV) grew or their take rate did. The sustainability of their nearly 27% take rate, which is a key retail profit driver for them, continues to be a risk. This accelerated growth was driven by expensive one-day delivery (which was expanded to lower priced items) that pushed e-commerce sales up, but also drove shipping costs up (to $12.9B) +43% and, as a result, operating margins lower in North America. This is reflected in N. American segment revenues accelerating to 22% from 18% and operating margins that deteriorated 150bps in Q4 and ~100bps for the full year. So, despite the robust top line growth, N. American profit dollars were down YoY – in Q4 from $2.3B to $1.9B and for the year from $7.3B in 2018 to $7B in 2019. Given that advertising and Prime fees are included in their N. American operating profit, these high margin businesses are clearly driving all of that 4.1% margin and making up for higher losses in retail. This suggests that the unit economics in North American retail continue to be challenged as one day shipping just increased their variable costs. International is still not profitable and operating income for Q4 was essentially flat (~$600m loss) on sales up 14%.


AWS not as bad as feared, but losing share to Azure and margins down: AWS is their primary source of profitability but decelerating and losing share to Azure which grew 64% this quarter, well ahead of AWS’s 34%. AWS margins declined >300bps YoY in Q4 and ~200bps YoY for FY19. By contrast, MSFT just reported Azure margins up 500bps. Alphabet’s cloud investments also pose a growing competitive threat to AWS. Mounting pressure on the AWS business seems to be one of the biggest fears of investors.


Trends with their FCF margins continue – valuation is still very expensive:  Adj. FCF margins were 4.3% (similar to 2018) resulting in ~$12B in FCF after capital leases. This is ~1.2% TTM FCF yield. The stock continues to be very expensive. Importantly, this $12B in FCF benefits from the $6.8B they pay in non-cash compensation through SBC and the $1.4B in excess tax benefits they get from SBC on top of that. Many analysts seem to use a sum of the parts valuation that places a multiple on GMV to value their online business. The problem with this is that it may be overstating the value of a retail business that continues to be subscale (i.e. losing money) w/ now likely over $340B in gross sales (GMV) and whose unit economics appear to be going in the wrong direction.


Sarah Kanwal

Equity Analyst, Director


Direct: 617.226.0022

Fax: 617.523.8118


Crestwood Advisors

One Liberty Square, Suite 500

Boston, MA 02109

www.crestwoodadvisors.com


$AMZN.US

[category earnings]

[tag AMZN]


FW: MSFT 2Q20 Earnings


Current Price: $174                          Price Target: Increasing to $195 from $170

Position size: 6.7%                          TTM Performance: 58%


Microsoft reported solid Q2 results, beating street high estimates on both revenue and EPS. The beat was broad based with better than expected growth in all segments. Double-digit top and bottom line growth, driven by the strength of commercial cloud. Q1 revenue was $37B (+15% YoY), gross margin dollars were up 25%, op income was up 39% and EPS was $1.51(+41%). Commercial Cloud business was up 41% constant currency and saw continued margin improvement, helping to drive op income up 39%. Counted w/in that is Azure, which was up 64% constant currency. They are taking share from Amazon’s cloud offering, AWS. This should continue as they are better positioned as more large enterprises, that are longtime customers, move to the cloud. Given their enterprise customer base, recent partnerships with SAP, VMware and Oracle, and superior Azure hybrid architecture, the company is uniquely positioned to capitalize on the growing demand for cloud services.


Key Takeaways:


·         FY 2020 revenue guidance reiterated at up double-digits and op margins guidance increased to +200bps from “increase slightly.”

·         Company Q2 gross margin was 67%, up 5 points YoY, driven by favorable sales mix and improvement across all three segments.

·         Solid growth across all 3 segments:

o   Productivity & Business Processes, up 19% YoY, $11.8B – driven by strong performance in Office commercial and LinkedIn

o   Intelligent Cloud, up 28% YoY, $11.9B – driven by continued strong growth in Azure, +64%. Suggests annualized Azure revenue of ~$17B.

o   More Personal Computing, up 3% YoY, $13.2B.

§  Ahead of expectations as better-than-expected performance across Windows businesses more than offset lower than expected search (+7%) and Surface revenue (+8%).

§  Weakness in gaming with lower console sales as we approach the next Xbox launch – revenues declined 20% constant currency.  The lower console sales benefited gross margins.

·         Q1 Commercial Cloud (consisting of O365 Commercial, Azure, Dynamics Online, and LinkedIn Commercial – this includes some revenue from the first two segments above) was $12.5B, up 41% constant currency in the quarter. Commercial cloud gross margin percentage increased 500bps, driven by material improvement in Azure gross margin.

·         Within Commercial Cloud, Azure growth accelerated to +64% constant currency, from +63% last quarter.

·         Recently  announced exclusive partnership with SAP makes Azure the preferred destination for every SAP customer. Large customers mentioned on call include Accenture, Coca Cola, Rio Tinto and Walgreens.

·         Ambitious new sustainability commitment: Microsoft will be carbon-negative by 2030. And by 2050, they say they will remove all the carbon they have emitted since the company was founded in 1975. And their $1 billion Climate Innovation Fund will accelerate the development of carbon reduction and removal technologies.

·         Returned $8.5 billion to shareholders through share repurchases and dividends.


Valuation:

·         Trading at a 3-4% FCF yield –still reasonable for a company with double digit top line growth, high ROIC and a high and improving FCF margins.

·         They easily cover their 1.2% dividend, which they have been consistently growing.

·         Strong balance sheet with about $134B in gross cash, and about $47B in net cash.

Investment Thesis:

·         Industry Leader: Global monopoly in software that has a fast growing and underappreciated cloud business.

·         Product cycle tailwinds: Windows 10 and transition to Cloud (subscription revenues).

·         Huge improvements in operational efficiency in recent quarters providing a significant boost to margins which should continue to amplify bottom line growth.

·         Return of Capital: High FCF generation and returning significant capital to shareholders via dividends and share repurchases.

$MSFT.US

[category earnings]

[tag MSFT]


Sarah Kanwal

Equity Analyst, Director


Direct: 617.226.0022

Fax: 617.523.8118


Crestwood Advisors

One Liberty Square, Suite 500

Boston, MA 02109

www.crestwoodadvisors.com


Alphabet Q4 Results

Current Price: $1,434                      Price Target: under review

Position Size: 4.9%                          TTM Performance: +25%


Alphabet missed estimates but improved disclosures. The stock is down today, but about even with where it opened yesterday. For the first time they broke out YouTube revenue separate from search revenue and also disclosed Cloud revenue. Despite the miss, 2019 revenue grew +20% (that’s $25B in incremental revenue for the year). Weaker hardware sales contributed to the 4Q miss, but they saw ongoing strength in YouTube and Google Cloud.


Key takeaways:

·         Top growth drivers were mobile search, YouTube and cloud.

·         Ad Revenue:

o   Google properties (includes search and YouTube) grew ~17% in FY19, which continues to grow faster than Network member sites at +7% – these are ads placed on sites that Google does not own.  

o   Search revenue was +15% (a deceleration from +22% in 2018) and YouTube was +36%.

o   YouTube ad revenue was revealed to be a $15B business – there seemed to be a wide range of estimates on how big this was, but this is in the range. Interestingly, their YouTube ad revenue is bigger than CBS, NBC, Fox and ABC ad revenue combined. See chart below.

o   They do not report YouTube’s profitability.

·         Google Cloud was +53% and is at a $10B run rate. GCP’s growth rate accelerated from 2018 to 2019. Commentary around this business, including backlog, was very strong. They are investing heavily behind this.

·         Google Other Revenues (includes Google Play, Hardware and YouTube’s non-advertising revenue)

o   In Q4, other revenues were up 10% YoY, primarily driven by growth in YouTube and Play, offset by declines in hardware. Lapping product launched contributed to lower growth.

o   YouTube now has over 20 million music and premium paid subscribers and over 2 million YouTube TV paid subscribers, ending 2019 at a $3 billion annual run rate in YouTube subscriptions and other non-advertising revenues. They also have a YouTube shopping initiative where people can now buy products in YouTube’s home feed and search results.

·         Other Bets: Losses grew. Management brought up the intention to get outside investors in these businesses. Verily is an example of a company in the portfolio that has outside investors like Silver Lake. They said they would consider opportunities for some of their Other Bets to take similar steps over time.

·         Key expense lines:

o   Higher cost of revenues driven by costs associated with data centers and servers, and content acquisition costs, primarily for YouTube.

o   Headcount was key driver in opex increases. They added 20k employees in 2019, an increase of over 20%! Majority of new hires were engineers and product managers. The most sizable headcount increases were again in Google Cloud for both technical and sales roles.

·         Share buybacks increased 59% QoQ.


Valuation:

·         Reasonably valued, trading at ~3.5-4% FCF yield on 2020.

·         $105B in net cash, ~11% of their market cap.


$G OOGL.US

[category earnings]

[tag GOOGL]


Sarah Kanwal

Equity Analyst, Director


Direct: 617.226.0022

Fax: 617.523.8118


Crestwood Advisors

One Liberty Square, Suite 500

Boston, MA 02109

www.crestwoodadvisors.com