Research Blog – INTERNAL USE ONLY

HILIX – Q1 2019 Commentary

HILIX – Q1 2019 Commentary

The Hartford International Value Fund underperformed its benchmark during the quarter and has now lagged over the past twelve months. During Q1, underperformance was driven by stock selection in financials and materials. The team remains focused on long term results investing in companies that are out of favor but have strong balance sheets and growth potential.

Continue reading “HILIX – Q1 2019 Commentary”

EOG 1Q19 earnings summary

Key Takeaways:

Current Price: $91 Price Target: $115 (NEW)

Position Size: 1.8% 1-year Performance: -23%

EOG released 1Q19 earnings with production levels ~1% above the top end of its forecast, giving some reassurance that they are well on track to deliver on current estimates for 2019. EOG mentioned on the call having 13 years of premium well inventory. Oil production was 20% higher than 1Q18. Increased efficiencies are driving better results at a lower cost, boosting earnings results. Adjusted EPS was 15% above guidance. Capex will be $6.3B for the year and will boost production by 12-16% in 2019 (as previously guided). EOG will use its FCF to strengthen its balance sheet, planning to repay $500m in debt, and $3B total between 2018 and 2021. The company is also boosting its dividend by 31%, a sign that the management team thinks cash flow will remain consistent going forward. Continue reading “EOG 1Q19 earnings summary”

Hilton 1Q19 Results

Share price: $92 Target price: Raising to $105 from $96

Position size: 2.9% 1 yr return: 17%

Hilton beat on revenue and EPS. Revenue rose 6% to $2.2B. EPS was $0.80, +16% vs consensus $0.75 (guidance was $0.73-$0.78). System wide RevPAR grew 1.8% on a currency neutral basis, in line w/ full year guidance of +1-3%. EBITDA was $499m, ahead of the high end of guidance and consensus. As a result, full year EPS and EBITDA guidance was raised. They still expect system-wide RevPAR growth to increase 1-3%. They reiterated their plan to return $1.3-$1.8B in capital to shareholders for the year, equating to 5-7% of current market cap.

Key takeaways:

· Both system-wide and US RevPAR grew 1.8%, outperforming the chain scale weighted industry data due to strong market share gains across all brands and major regions.

· Mgmt points to market share gains as a leading indicator of what should happen with their network effect because that attracts more capital. It’s why you see the pipeline growing and rooms under construction growing. Last year was the first time in history they grew market share everywhere in the world, including the US.

· Group business continues to be solid with RevPAR up 3.7%

· On 1.8% RevPAR growth in 1Q, they grew EBITDA 12%.

· Net unit growth of 7% is running ahead of targeted 6.5% for the year.

· Development pipeline grew to 371k rooms from 364k rooms last quarter – equates to 40% of room count. Over half of pipeline is under construction.

· >50% of pipeline is outside of the US.

· In a sensitivity analysis to a market downturn, mgmt. said they would expect flat to slightly positive growth in adjusted EBITDA and positive growth in free cash flow in an environment where RevPAR were to decline 5% to 6%. This is b/c Hilton is structurally different than it was last cycle – asset light means less operating leverage and less volatile earnings stream if RevPAR continues to weaken. Moreover, unit growth will aid EBITDA growth regardless of RevPAR trends.

· Loyalty members hit 89m from 85m last quarter and account for >60% of system-wide occupancy. Goal is to have 100m members by the end of the year.

· The stock is undervalued, trading at 7.5% FCF yield on 2019.

· ESG: ranked number one on Fortune’s Best Companies to Work For list in the US – the first hospitality company in history and the first non-tech company since 2004 to achieve this number one rating.

Investment Thesis:

∙ Hotel operator and franchiser with geographic and chain scale diversity of 14 brands, 5,400 hotels and 880k rooms across 106 countries (Hilton, Hampton Inn & Hilton Garden Inn ≈ 2/3 of portfolio).

∙ Network effect moat of leading hotel brand and global scale lead to room revenue premiums and lower distribution costs.

∙ Shift from hotel ownership to franchising results in resilient, asset-light, fee-based model.

∙ Record pipeline generating substantial returns on minimal capital will lead to increasing ROIC and a higher multiple.

∙ Unit growth and fee based model reduce cyclicality – Lower operating leverage vs ownership reduces earnings volatility and unit growth offsets potential room rate weakness.

∙ Generating significant cash which is returned to shareholders through dividends and buybacks.

$HLT.US

[tag HLT]

Sarah Kanwal

Equity Analyst, Director

Direct: 617.226.0022

Fax: 617.523.8118

Crestwood Advisors

One Liberty Square, Suite 500

Boston, MA 02109

www.crestwoodadvisors.com

Black Knight 1Q19 Earnings

Share price: $54 Target Price: Raising to $60 from $55

Position size: 2.2% TTM return: 12%

Key Takeaways:

· Slight beat on revenue and EPS, guidance maintained. Revenue was $283 (+5%) vs street $282 and EPS was $0.44 vs street $0.43.

· Adjusted EBITDA was $137 million, an increase of6%. Adjusted EBITDA margin was 48.4%, an increase of 50bps.

· By segment, management continues to expect mid to high-single digit growth in Servicing, high-single to low-double digit growth in Origination, and low to mid-single digit growth in Data & Analytics.

· Data analytics segment (~15% of revenue) revenues were up 6% driven by growth in their property data and portfolio analytics businesses. This segment is lower margin, but margins are improving – EBITDA margins were up 200bps for the quarter.

· Software Solutions segment (~85% of revenue) was up 4% driven by higher average revenue per loan and loan growth on their core servicing software solution.

o Within this segment servicing (~75% of revenue) grew 4%. This is steadier than their originations revenue. They continue to dominate first lien loans with 62% share and are growing share in second lien loans. They have high-teens share of second lien and expect to reach 30% once current commitments are implemented.

o Originations (~10% of total revs) made up of new loans and refi’s. Grew 7% primarily driven by 25% growth in their loan origination system solutions from new clients, partially offset by lower professional services and the effect of lower refinance origination volumes.

· Despite the economy being strong, their end markets (U.S. mortgage originators and Servicers) are actually weak. “Based on market conditions we’re in the midst of our clients recession. I know the economy is doing well and other industries are doing well, but with rates rising, it’s caused pain.”

· BKI has consistently performed well through a tough time for their end clients, partly because they’re providing them with solutions that solve their problems like increasing efficiency and maintaining regulatory compliance.

Continue reading “Black Knight 1Q19 Earnings”

CVS 1Q19 earnings summary

Key Takeaways:

Current Price: $57 Price Target: $90

Position Size: 1.60% 1-year Performance: -20%

This morning CVS published its 1Q19 earnings results and gave an update on its 2019 outlook. Both surprised to the upside, in addition to a new cost cutting program named “Enterprise Modernization Initiative”. The new cost cutting plan will look for productivity improvements across the operations (mostly rationalization of IT) and is expected to generate $1.5-$2B in savings by 2022, on top of synergies with Aetna. CVS raised its FY19 EPS guidance range to $6.75 to $6.90 from $6.68 to $6.88. The company did not want to comment on the 2020 outlook only noting that FY20 PBM selling season was expected to have a mid-90%’s retention rate. Overall we are pleased to see some relief on this story, and maintain our positive view on the name long-term. Continue reading “CVS 1Q19 earnings summary”

Apple 2Q19 Earnings Results

Apple beat on revenue and EPS and issued solid guidance. Midpoint of 3Q revenue guidance was better than street. Key positive is that the beat was driven by better than expected iPhone and services revenues. Better Q3 guidance suggests demand for iPhones has stabilized after a disappointing holiday period. Increasing their buyback program by $75B as they head to their goal of net cash neutral.

Key Takeaways:

· Q2 revenues of $58 billion, beating estimates of $57.5B.

· Q2 EPS of $2.46, beating expectations of $2.37.

· Q3 forecast of between $52.5B and $54.5B, beating estimates of $52.22B.

· Q2 iPhone revenues of $31B, beating estimates of $30.5B. iPhone revenue down YoY, but better than expectations and mgmt. said sales improved throughout the quarter.

· They saw strength across all segments except the Mac.

· Services revenue of $11.45B, +16%, an all-time record. Accounted for 20% of sales and 1/3 of gross profit.

· Wearables +50% on strong Apple watch results and huge demand for air pods.

· iPad up 22% – strongest iPad growth in 6 years due to their strategy shift: new Pro models last year and new cheaper, mid-range models (the iPad mini and iPad Air) this year.

· Europe, Greater China, and Rest of Asia Pacific segments were all down YoY, but the Americas and Japan were both up slightly. Greater China sales down 22% YoY.

The following excerpt from the call highlights Apple’s opportunity to grow services given their massive installed base of over 1.4 billion active devices:

“We believe we’re really just beginning to tap into what we can do to help our users actively manage their health and well-being. For example, last month Stanford Medicine reported results of the Apple Heart Study, the largest study ever of its kind, which enrolled over 400,000 participants from all 50 states in a span of only eight months. And hundreds of institutions are now supporting health records on iPhone with recent additions including Michigan Medicine and UT Health Austin.

In February, we announced that we are working with the U.S. Department of Veterans Affairs to make health records on iPhone available to veterans. This will be the first record sharing platform of its kind available to the VA, which is the largest medical system in the U.S. providing service to more than nine million veterans across more than 1,200 facilities.”

Valuation:

· Returned over $27B to shareholders through share repurchases and dividends. Board authorized an additional $75 billion for share repurchases.

· The stock is undervalued and substantial buyback from management’s goal of net cash neutral will support valuation.

· Trading at close to a 1.8% dividend yield, a ~6% FCF yield.

The Thesis for Apple:

  • One of the world’s strongest consumer brands and best innovators whose product demand

has proven recession resistant.

  • Halo effect -> multiplication of revenue streams: AAPL products act as revenue drivers

throughout portfolio – iPhone, iPod, MacBooks, iPad > iTunes, Apps, Software, Accessories,

  • Strong Balance and cash flow generation.
  • Increasing returns to shareholders via dividends and buybacks.

$AAPL.US

[tag AAPL]

Sarah Kanwal

Equity Analyst, Director

Direct: 617.226.0022

Fax: 617.523.8118

Crestwood Advisors

One Liberty Square, Suite 500

Boston, MA 02109

www.crestwoodadvisors.com

Sensata (ST) 1Q19 earnings summary

Key Takeaways:

Current Price: $49.7 Price Target: $61

Position Size: 2.01% 1-year Performance: -0.2%

Sensata released its 1Q19 results this morning, in line with Street expectations but better than ours, as companies we monitor had recently been incrementally more negative on the global auto market. Organic growth was ~1%: HVOR outgrew the market growth by 850bps, as did their auto business outperforming by 490bps, thanks to continued strong content growth. Margin pressure should abate as new products grow in volume. They lowered their guidance for the year based on weaker end markets in auto in China and Europe, which is not surprising. The company is continuously looking to streamline its operations to drive higher productivity and react better to lower volumes. Buybacks reduced share count by an impressive 8.3% (a 4 cent boosts to the $0.85 adjusted EPS this quarter). Overall we see the secular growth drivers intact for Sensata, while recent weakness in auto continues to pressure end markets in the near term. Continue reading “Sensata (ST) 1Q19 earnings summary”

AAPL 2Q – up after-hours on strong quarter

Apple is up ~5% after-hours after reporting a strong 2Q. They beat on revenue and EPS and issued solid guidance. Midpoint of 3Q revenue guidance was better than street. Key positive is that the beat was driven by better than expected iPhone and services revenues. More details after the call.

$AAPL.US

[tag AAPL]

Sarah Kanwal

Equity Analyst, Director

Direct: 617.226.0022

Fax: 617.523.8118

Crestwood Advisors

One Liberty Square, Suite 500

Boston, MA 02109

www.crestwoodadvisors.com

Alphabet Q1 Results – Stock down on revenue miss

Current Price: $1,191 Price Target: $1,350

Position Size: 4.6% TTM Performance: 18%

Alphabet reported earnings, missing on the top line and beating on EPS. Management attributed the revenue miss primarily to Fx and also the timing of some ad product changes. Total revenue was $36.3B vs. consensus of $37.3B, up 19% constant currency (+17% reported) – that’s a deceleration from 23% in 4Q18. Currency was a $1B headwind, so pretty much all of the miss. This was partially offset by lower TAC which only grew 9%. That put net revenue up almost 19%. Excluding the impact of the EU fine EPS was $10.81, better than consensus of $10.53.

Key takeaways:

· Management attributed the broad-based slowdown to product changes but did not elaborate further. Lack of detail here is largely the reason for the selloff.

· Trend of lower TAC continues – decreased from 24% of rev to 22%.

· Alphabet accrued a 1x fine from the European Commission this quarter for €1.5B ($1.7B) related to agreements in the AdSense business that were found to be in restraint of competition.

· Operating expenses were $12B, up 20% YoY. The biggest increase was in R&D expenses with headcount growth in Cloud as the largest driver.

· Capex of ~$4.6BN decreased materially vs. $7.3BN in 1Q18 as they lapped the purchase of office space in New York City in 1Q18.

· ESG:

o Google data centers use 50% less energy than a typical data center, while delivering 7x more computing power than they did five years ago.

o Since 2017, they have matched 100% of the electricity consumption of their operations with purchases of renewable energy and is now the world’s largest corporate buyer of renewable energy.

Segment performance:

As a reminder, they report in 2 segments: “Google” and “Other Bets.” Google segment revenue is comprised of: Google Sites, Network Partners & Google Other Revenue. The first two are ad revenues and make up the majority of total revenue. Other Revenue includes hardware and cloud. “Other Bets” are their moonshots like Waymo – they’re a tiny part of the business and losing money.

· Google ~$30B in ad revenue, +15% YoY.

o Google Sites: revenues were ~$25B, +17%YoY (includes roughly 2 pts drag from Fx). In terms of dollar growth, results were led again by mobile search with a strong contribution from YouTube, followed by Desktop Search.

o Network: revenues were $5B, +8% YoY, continuing to reflect the performance of the primary drivers of growth, AdMob, followed by Google Ad Manager.

· Other revenues for Google were $5.4 billion, up 25% year-over-year, fueled by Cloud and Play and partially offset by Hardware (slowing growth of premium smartphones resulted in lower Pixel sales). “Today 9 of the world’s 10 largest media companies, 7 of the 10 largest retailers and more than half of the 10 largest companies in manufacturing, financial services, communications and software use Google Cloud.”

· Other Bets – Revenues were $170 m, primarily generated by Fiber and Verily. Loss increased from $600m to ~$900m.
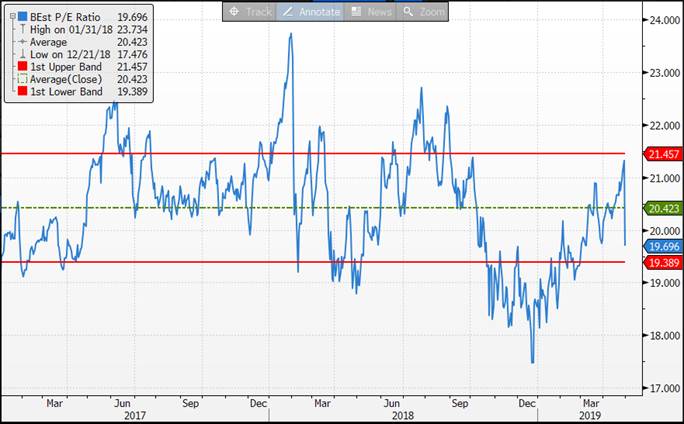
Valuation:

· Trading at below average P/E ratio (see above) and about a 4.5% FCF yield.

· $110B in net cash, 13% of their market cap.

· Repurchased ~$3B worth of shares during quarter. $11B remaining on the existing share repurchase authorization.

$GOOGL.US

[tag GOOGL]

Sarah Kanwal

Equity Analyst, Director

Direct: 617.226.0022

Fax: 617.523.8118

Crestwood Advisors

One Liberty Square, Suite 500

Boston, MA 02109

www.crestwoodadvisors.com