Research Blog – INTERNAL USE ONLY

Pepsi 4Q18 earnings call

Key takeaways:

Current price: $115 Price target: $123

Position size: 2.30% 1-year performance: +1.5%

Pepsi reported +4.6% of organic revenue growth, helped by pricing +4% (although FX was -4%). What mattered today was the company’s 2019 guidance announcement. The company plans to return $8B to shareholders in 2019 through share repurchases and dividends. PEP expects organic top line to grow 4% (above consensus of +3.4%), and EPS of $5.50, which would be a 3% decline y/y as the company expects to reinvest for growth (more marketing spending) and incur some restructuring costs. It is pretty common to see an EPS “reset” lower as a new CEO takes the helm of a company. Thus there is no surprise there with a 3% decline in EPS this year. There is nothing completely different with newly appointed CEO Ramon Laguarta strategic vision. He has a desire to streamline Pepsi’s manufacturing and supply-chain footprint for better performance, becoming “leaner, more agile and less bureaucratic”. As costs rise, Pepsi is renewing its efforts to drive productivity gains and is targeting $1B in savings/year until 2023. Long term, Pepsi is hopeful to return to an algorithm of +4-6% organic growth, core operating margin expansion of 20-30bps and a high-single-digit core EPS growth starting in 2020. Continue reading “Pepsi 4Q18 earnings call”

Update on Retail Sales

· Monthly retail & food service sales released by the Census Bureau yesterday were far worse for December than expected. Sales fell a seasonally adjusted 1.2% in December from November. Every major category tracked was down except motor vehicles and building materials. Excluding automobiles, gasoline, building materials and food services, retail sales dropped 1.7%. Since 1992, month-over-month (MoM) retail sales have averaged 0.35% and saw a low of -3.9% in Nov 2008.

· A further surprise in the report was that December online sales fell 3.9% from November. YoY online sales were up 3.7% from a year earlier.

· While some retailers have reported some softening, the numbers run counter to other indicators. For example, MasterCard SpendingPulse reported strong holiday retail sales numbers – they said sales from Nov 1 to Dec 26 were up 5.1% and that online was up 19%. Also we’ve seen strong job numbers.

· Yesterday the NRF released their holiday sales numbers of up 2.9% YoY below the 5% MasterCard reported (which was also roughly the consensus). The NRF’s chief economist said, “The combination of financial market volatility, the government shutdown and trade tensions created a trifecta of anxiety and uncertainty impacting spending.”

· While the numbers from the Census Bureau are a bit troubling, they are subject to revisions which can sometime be large and the weakness may have been temporary driven by factors like stock market volatility and the initial days of the government shutdown. For instance, Visa reported some softening in US spending in December that recovered in January.

· Retailers start reporting earnings next week. Some have already pre-released with softer than expected results including Macy’s, Kohl’s, JC Penney. However, others like Target and Costco pre-released strong numbers.

· Total retail & food service sales are ~30% of GDP, so we may see a weaker Q4 GDP number.

Sarah Kanwal

Equity Analyst, Director

Direct: 617.226.0022

Fax: 617.523.8118

Crestwood Advisors

One Liberty Square, Suite 500

Boston, MA 02109

www.crestwoodadvisors.com

CSCO 2Q19 Update

Current Price: $48 Target Price: $54

Position size: 4.4% TTM Performance: 16%

CSCO reported very strong 2Q results. Sales and EPS were better than expected and guidance was ahead of consensus. They delivered revenue growth across all geographies and businesses, strong margins, double-digit EPS growth, and continued solid cash generation. Cisco is benefiting as their customers face an increasingly complex IT environment as they move to the cloud, deal with growing connectivity of users and devices, and changing security needs. Cisco’s evolving portfolio of products helps customers navigate this complexity by helping them simplify, automate, and secure their infrastructure. As a result, despite concerns of weakening IT spending, CSCO is seeing robust demand. Demand is solid enough that they haven’t seen any impact to their business from changes in the global macro-economic environment. The CEO said, “I would tell you that it certainly is one of the more complex macro geopolitical environments that I think we’ve seen in quite a while with all the different moving parts. But to be honest, from the first day of the quarter to the last day of the quarter, we saw zero difference. We saw very steady demand throughout the quarter.” They are in the early innings of evolving network architectures, so there is a lot of runway to the growth they are seeing.

Thesis intact, key takeaways:

· Top line growth was ~7%. Q3 sales expected to be up 4-6%, street was expecting +3%.

· Impact of the 10% tariff was immaterial in the quarter. They were able to offset with pricing.

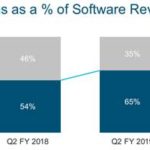
· Transition to recurring revenue model. The percentage of recurring revenue is now ~1/3 – they set a goal of 37% by 2020. They are on track to drive software revenue to 30% of total revenue by FY20. Subscription revenue was 65% of total software revenue, up from 57% last quarter. This transition will drive an upward trend in CSCO’s margins over the next several years.

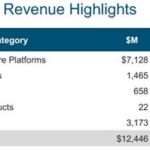
· Their largest segment, Infrastructure Platforms (58% of revenue), was up +6% YoY on another quarter of campus switching strength, driven by solid demand for their Catalyst 9k products. Routing declined due to weakness in service provider end markets. They also saw a decline in data center servers.

· In terms of customer segments, enterprise was up 11%, commercial grew 7%, public sector was up 18%, and service provider was down 1%.

Valuation:

· They have close to 3% dividend yield which is easily covered by their FCF. Dividend increased 6% and added $15B to buyback authorization, bringing the total to $24B, or over 10% of their current market cap.

· They have $15B in net cash. In the quarter they returned $6.5B to shareholders – $1.5B in dividends and $5B in buybacks.

· Forward FCF yield is almost 7%, well above sector average and is supported by an increasingly stable recurring revenue business model and rising FCF margins.

· The company trades on a hardware multiple, but the multiple should expand as they keep evolving to a software, recurring revenue model. Hardware trades on a lower multiple because it is lower margin, more cyclical and more capital intensive.

Thesis on Cisco:

· Industry leader in strong secular growth markets: video usage, virtualization and internet traffic.

· Cisco is the leader in enterprise switching and service provider routing and one of the few vendors that can offer end-to-end networking solutions.

· Significant net cash position and strong cash generation provide substantial resources for CSCO to develop and/or acquire new technology in high-growth markets and also return capital to shareholders.

· Cisco has taken significant steps to restructure the business which has helped reaccelerate growth and stabilize margins.

$CSCO.US

[tag CSCO]

Sarah Kanwal

Equity Analyst, Director

Direct: 617.226.0022

Fax: 617.523.8118

Crestwood Advisors

One Liberty Square, Suite 500

Boston, MA 02109

www.crestwoodadvisors.com

PLEASE NOTE!

We moved! Please note our new location above!

Hilton 4Q18 Results

Share price: $78 Target price: $96

Position size: 2.5% 1 yr return: -11%

Hilton beat on revenue and EPS. 2019 EPS and EBITDA guidance better than expected despite lowered RevPAR guidance range from 2-4% to 1-3%. This new lowered RevPAR guidance was largely expected and is in line with other hotel operators. EBITDA was $544m, ahead of guidance and consensus. RevPAR for 4Q was +2% driven entirely by higher rates. Q1 guidance also ahead of expectations. While RevPAR guidance is weakening, Hilton is structurally different than it was last cycle – asset light means less operating leverage and less volatile earnings stream if RevPAR continues to weaken. Moreover, unit growth will aid EBITDA growth regardless of RevPAR trends. (RevPAR = revenue per available room. It’s their total room revenue divided by their total number of rooms).

[MORE]

Key takeaways:

· Their weakest areas of demand were leisure travelers in the US and Asia Pacific.

· Group business is solid – 2019 group bookings up in the mid-single-digits and corporate negotiated rates up just over 2%; slightly ahead of last year’s growth. More than 70% is already on the books.

· On 2% RevPAR growth in 4Q, they grew EBITDA 12%.

· Net unit growth – In 2018 they opened more than one hotel per day – the best year of openings in their history. They added over 450 hotels (+57K rooms) or approximately 7% growth YoY. They ended 2018 with 5,700 properties and 913K rooms (~5% global room share) across 113 countries.

· Strong pipeline for 2019 – record year for construction starts and signings. They are expecting to grow rooms 6-7% in 2019. 80% of that is under construction. >50% of pipeline is outside of the US.

· Launched new luxury brand, LX. The first hotel opening under this banner is in Dubai and is a conversion from a contract Marriott lost last year.

· Loyalty members hit 85m and account for 60% of system-wide occupancy. Goal is to have 100m members by the end of the year.

· China RevPAR was weaker than expected at +5% – it had been trending up double digits. They echoed other companies in saying that the macro environment in China is weakening. Despite that, management had a very positive tone about the future of their operations in China.

· Conversions (an existing hotel changes their banner to Hilton) increased from 20% of pipeline to 25%. This can be a little counter-cyclical. It peaked as a % of their pipeline in the recession in low 40% range. They are starting to see a ramp in conversions in China.

· Returned $1.9B to shareholders in 2018.

· The stock is undervalued, trading at over an 8% FCF yield on 2019.

Investment Thesis:

∙ Hotel operator and franchiser with geographic and chain scale diversity of 14 brands, 5,400 hotels and 880k rooms across 106 countries (Hilton, Hampton Inn & Hilton Garden Inn ≈ 2/3 of portfolio).

∙ Network effect moat of leading hotel brand and global scale lead to room revenue premiums and lower distribution costs.

∙ Shift from hotel ownership to franchising results in resilient, asset-light, fee-based model.

∙ Record pipeline generating substantial returns on minimal capital will lead to increasing ROIC and a higher multiple.

∙ Unit growth and fee based model reduce cyclicality – Lower operating leverage vs ownership reduces earnings volatility and unit growth offsets potential room rate weakness.

∙ Generating significant cash which is returned to shareholders through dividends and buybacks.

$HLT.US

[tag HLT]

Sarah Kanwal

Equity Analyst, Director

Direct: 617.226.0022

Fax: 617.523.8118

Crestwood Advisors

One Liberty Square, Suite 500

Boston, MA 02109

www.crestwoodadvisors.com

Travelers (TRV) Q4 results

On 1/22/19, Travelers reported Q4 EPS of $2.13, slightly above consensus of $2.10. Catastrophic losses were elevated due to the devastating Camp Fire and Hurricane Michael. Excluding these losses, Traveler’s results improved year-over-year with the combined ratio falling 130bps to 91.1%. Travelers is a high quality, disciplined underwriter of insurance that is focused on returning capital to shareholders. TRV is selling at an attractive valuation of 11.4 x 2019 earnings.

Current Price: $127.16 Price Target: $145 (raised from $125)

Position Size: 2.19% TTM Performance: -5.8%

Thesis Intact. Key takeaways from the quarter:

  1. Results were solid considering catastrophic losses
    • Solid premium growth 4% and retention rates of 87%
    • Investment income +15% with help from rising rates and lower taxes
    • Slight decrease in combined ratio to 91.1% due to improved results in autos and bond and specialty segments
    • 2018 ROE 10.7% up 170bps from 2017
  1. TRV continues to aggressively return capital to shareholders – for 2018 TRV returned $2.1b to shareholders out of $2.4b in earnings
    • Over past 10 year shares outstanding have fallen 57%!
    • Shareholder yield of 6.2% which is a dip from +10% of prior quarters
    • Management employing capital wisely! Instead of investing in mature business with spotty pricing, they are returning excess capital to shareholders
  1. Catastrophic losses have been elevated for past few years

Effective 2019, TRV significantly increased its catastrophe reinsurance, which should help smooth earnings and protect the balance sheet in the future.

4. Valuation is attractive. Currently TRV trades at a forward P/E of 11.4 which is close to the bottom of its five-year valuation range of 10 – 15.

The Thesis on TRV:

  • We expect TRV will be able to grow book value per share in the mid-single digits over the near-medium term, and generate ROE in the 10-14% range
  • Industry leader with disciplined underwriting and investment portfolio track record
  • Consistent returns in the low to mid double digits
  • Responsible capital allocation and proven desire to act in the best interests of shareholders

Thanks,

John

($TRV.US)

John R. Ingram CFA

Managing Director

Asset Allocation and Research

Direct: 617.226.0021

Fax: 617.523.8118

Crestwood Advisors

One Liberty Square

Suite 500

Boston, MA 02109

www.crestwoodadvisors.com

Stryker trim 70bps #researchtrades

After review, we decided to trim Stryker by 70bps, and put the proceeds in cash (IVV) until our next idea makes it into the portfolio. Stryker is currently our biggest relative weight, yet at today’s valuation (+8% upside on our new $198 price target) we think this carries too much risk. The Medtech sector has seen its multiple expand in the past decade, helped by healthy fundamental drivers. While we think Stryker still has room to grow, the Medtech sector now trades at a 40% premium vs. the market.

Julie S. Praline

Director, Equity Analyst

Direct: 617.226.0025

Fax: 617.523.8118

Crestwood Advisors

One Liberty Square

Suite 500

Boston, MA 02109

www.crestwoodadvisors.com

Update on Q4 Earnings Results

So far, 66% of the companies in the S&P 500 have reported results for Q4.

· Overall, companies are beating estimates, but the magnitude of beats is lower than what’s typical. Also, revenue and EPS growth estimates are coming down. EPS growth for Q1 is expected to be slightly negative.

· 71% have beat on EPS (= to 5 yr. average) and 62% have beat on revenue (above 5 yr. average).

· The blended sales and blended earnings growth rates for Q4 is 7% and 13% respectively. 10 of the 11 sectors are reporting YoY earnings growth.

· More companies are issuing negative EPS guidance for Q1 than average. Not all companies issue guidance, but of the 65 in the S&P that have so far, 82% issued negative guidance.

· Growth is expected to decelerate next year to 5.1% revenue growth and 5% earnings growth. Currency headwinds are a factor in this.

· The forward 12-month P/E ratio is 15.8.

· The Consumer Discretionary sector has the highest forward P/E ratio at 19.6x, while Financials has the lowest at 11.3x.

Sarah Kanwal

Equity Analyst, Director

Direct: 617.226.0022

Fax: 617.523.8118

Crestwood Advisors

One Liberty Square, Suite 500

Boston, MA 02109

www.crestwoodadvisors.com

Fortive 4Q18 earnings summary

Key Takeaways:

Current Price: $76 Price Target: $87 (under review)

Position Size: 2.19% 1-year performance: +7%

Fortive released 4Q18 results with sales up 7.4% organically (+11.4% reported), and adjusted EPS up 30% from last year (helped by lower interest expenses and lower tax rate). While China was highlighted as strong in 4Q18, the company did warn that there was some early buying that pulled forward some sales (70-100bps of growth) as companies were buying ahead of possible tariffs. Management thinks North America will remain solid in 2019, while Western Europe and China could experience some slowing down. Those assumptions are driving the 3% core top line growth guidance for 2019, and the high end of 5% assumes there is no slow down. Operating margins increased 40bps (excluding the recent acquisitions dilutive effect), helped by 80bps price increases. During the call, the company highlighted accelerating their portfolio transformation towards less cyclical markets and more secular growth drivers, also increasing in the recurring revenue base. This is part of our buy thesis on the name and reassuring to hear the transformation is going in the right direction. Continue reading “Fortive 4Q18 earnings summary”

Sanofi 4Q18 earnings summary

Key Takeaways:

Current Price: $42.5 Price Target: $51

Position Size: 1.65% 1-year Performance: +7%

Sanofi reported 4Q18 sales results containing no surprises, with sales up 3.9% and EPS +4.7%. Flu vaccines was a growth driver this past quarter, while the diabetes franchise remained weak. The divestiture of Zentiva, its European generic business as well as growth of Dupixent will boost margins going forward. The Dupixent sales increased thanks to advertising and the recent US launch in asthma (the drug is approved for severe form of eczema and asthma). Sanofi new R&D chief is pruning the portfolio to focus on better prospects, accelerating research on 17 programs while discontinuing 25 others. The firm is putting cancer treatment on its priority list, and removing diabetes from it, which had been a major growth driver for the company in the past (with drug Lantus). In addition, the company is refocusing its segments in order to “unlock organizational efficiencies”… we have heard that from other companies in the past, and we remain unconvinced about the value of such reorganizational efforts. But on the positive side, Sanofi’s dividend yield is now an attractive 4.2%, which offers good support to the stock. Continue reading “Sanofi 4Q18 earnings summary”

DBLTX – Q4 2018 Commentary

DBLTX – Q4 2018 Commentary

As volatility spiked in 2018, investors moved away from risk assets and the Barclays Agg was flat for the year. The DoubleLine Total Return Bond Fund outperformed its benchmark during the fourth quarter and added 174 bps of outperformance for the full year. Given the current state of local and global fixed income markets, DoubleLine favors actively managed products that are well diversified and biased toward quality holdings.

Continue reading “DBLTX – Q4 2018 Commentary”