Research Blog – INTERNAL USE ONLY

Lazard International Strategic Equity – Q2 2018 Commentary

LISIX – Q2 2018 Commentary

Lazard International Strategic Equity performed in line with the MSCI EAFE Index during the second quarter and has outpaced the benchmark by approximately 300 bps YTD. Flat performance for the asset class was driven by geopolitical concerns in Europe and fears of protectionist policies from the United States. The portfolio team remains confident that, by continuing to focus on stock selection of companies with sustainably high or improving returns, the strong long term track record of the strategy can continue.

Continue reading “Lazard International Strategic Equity – Q2 2018 Commentary”

Baron Emerging Market Commentary – Q2 2018

BEXIX – Q2 2018 Commentary

Baron Emerging Markets fell 9.35% during the quarter, underperforming the broader EM index. Relative underperformance was driven largely by a single position in a Malaysian e-service provider. The selloff within EM has been caused by a withdrawal of liquidity driven by cheap US dollar funding as well as increased rhetoric around protectionist measures coming out of the U.S. The Baron team believes that many major EM countries have undergone a positive and supportive evolution of political direction recently, and their differentiated stock selection process should be able to take advantage of recent increased volatility.

Continue reading “Baron Emerging Market Commentary – Q2 2018”

Alphabet 2Q18 Earnings

Alphabet reported very strong Q218 results, beating on sales and earnings. Google segment revenues were up 25% and other revenue, which includes cloud, was up 37%. Mobile search and YouTube continue to drive ad revenue. Importantly, traffic acquisition costs (TAC) were down as a percentage of revenue (23% of revenue vs 24% last quarter). This was a key positive in the quarter as TAC accounts for most of cost of sales. Management previously suggested this reversal was coming. Two dynamics have been driving higher TAC: the mix shift to mobile and to programmatic. Although these evolving ad formats monetize differently and are lower margin than desktop search they continue to represent meaningful growth opportunities. They report their ad revenues in two buckets: “Google Properties” (rev from search, Gmail, YouTube etc) and “Google Network Members” (rev from 3rd party sites that use AdSense, AdMob or DoubleClick to sell ads on their sites). Google Properties has lower TAC and is growing faster (>80% of ad revenue). Starting last quarter, they changed their monetization metrics. For Network Member properties they switched from reporting clicks (how many times people clicked on an ad) to impressions (how often ads are viewed). The change represents the growing importance of (higher TAC) programmatic on Network properties (which is largely monetized by impression). They also had solid performance in their non-ad businesses. Hardware is seeing strong growth and their cloud business continues to see momentum as they work to catch up with Amazon and Microsoft. Today (at their “Google Cloud Next” event) they announced an important new hybrid cloud solution that targets Microsoft Azure’s dominance in this space. This underscores the growing importance of hybrid solutions as cloud penetration increases. The CEO spent a lot of time on the call talking about applications of AI across their business and their opportunity in cloud. He echoed a similar sentiment that Satya Nadella (MSFT CEO) did last week – that despite AWS’s early lead, cloud should not be viewed as winner-take-all on a customer level because… “businesses are going to embrace multiple clouds over time.” He also indicated that he thinks cloud adoption is still in early stages and that “there’s a lot of opportunity.”

With the exception of lower TAC, this quarter follows a similar trend of rising expenses and investment impacting margins as they “invest ahead of growth.” Higher operating expenses are largely related to head count increases in R&D (tech talent) and sales & marketing. Capex continues to remain elevated, increasing from $2.8B in 2Q17 to $5.5B this quarter. This is a similar pace of growth as last quarter (ex the Chelsea Market purchase). They continue to invest in things like equipment and data centers. The investments in technical infrastructure reflect expanding applications of machine learning across the company.

[MORE]

Valuation:

· FCF for the quarter was $4.7B and is expected to be $26B for the year.

· Trading at a ~3% FCF yield. Although the stock looks more expensive, it is on depressed FCF margins which should improve as capital intensity normalizes. No change in thesis.

· $98B in net cash, $140/share or 11% of their market cap.

Thesis on Alphabet:

· Online advertising as a share of overall Ad budgets will continue to grow as:

o People spend more time on the internet/mobile internet vs tv, radio, newspapers etc

o Higher ROI (+ easier to measure) per marketing dollar spent online vs other ad mediums

· They are the global leader in search.

· Well positioned to benefit from increased smartphone penetration.

· Flexible business model provides operating leverage with high returns ROIC and huge free cash flow generation.

$GOOGL.US

[tag GOOGL]

Sarah Kanwal

Equity Analyst, Director

Direct: 617.226.0022

Fax: 617.523.8118

Crestwood Advisors

One Liberty Square, Suite 500

Boston, MA 02109

www.crestwoodadvisors.com

PLEASE NOTE!

We moved! Please note our new location above!

MMM 2Q18 earnings

Key Takeaways:

MMM reported 2Q18 revenue that were better than expected, with EPS in line after removing the one-time gain from the sale of its Communications Markets business. Revenue grew +7.4% y/y (+5.6% organic ex-FX), gross margins expanded by 120bps y/y, and operating margin increased 100bps mostly from better volume and productivity actions. Sales growth was broad based, with all segments seeing organic growth. Some of the beat this quarter was due to US customers accelerating their purchases ahead of an ERP roll-out in the US in Industrials, Safety & Graphics and Electronics & Energy (this has been implemented in Europe in the last 18 months). The impact from this implementation is a +50-100bps of growth pulled forward to 2Q18. Adjusted EPS grew 27% y/y thanks to organic growth, productivity efforts and a lower tax rate.

MMM returned $2.4B to shareholders via dividends and share repurchases this quarter. The management team increased the lower end of its share repurchase guidance to $4-5B from $3-5B.

The stock initially sold off as the management team adjusted its top-end EPS guidance for the year due to the sale of a business, but recovered since as the underlying fundamentals remain strong. Overall MMM has some good momentum in its pricing power, offsetting raw-material inflation. The new tariffs have little effect so far on the company’s costs, only estimated at 1c/share. However the management team is monitoring the impact from any increase in tariffs and possible retaliations, and could change sourcing and/or pricing increases if necessary. We are not changing our price target or position size at this point.

Continue reading “MMM 2Q18 earnings”

Touchstone Total Return Name Change

Good Morning,

I want to make everybody aware that, as of July 20th, the official name for Touchstone Total Return Bond (TCPNX) has changed to Touchstone Impact Bond Fund.

The team has integrated ESG criteria into its process since the inception of the fund and the goal of the name change is to highlight that element of the strategy.

The only thing that will change is the name. The ticker, CUSIP, and most importantly, process will remain the same moving forward.

If anybody has specific questions about the change please let me know.

Thank You,

Pete

Peter Malone, CFA

Research Analyst

Direct: 617.226.0030

Fax: 617.523.8118

Crestwood Advisors

One Liberty Square

Suite 500

Boston, MA 02109

www.crestwoodadvisors.com

PLEASE NOTE!

We moved! Please note our new location above!

Touchstone Total Return Name Change.pdf

SLB 2Q18 earnings satisfactory, FCF improvement towards the end of the year

Key Takeaways:

Schlumberger 2Q18 earnings results were generally in line with expectations, with revenue +6% quarter/quarter, and margin +75bps q/q. Technology and software, differentiating factors for SLB’s margins, were offset by startup costs and transitory operational delays. Cameron (offshore activity) is slow to rebound, but should contribute to growth in 2018-2019. Management had a positive outlook for its international business, seeing positive pricing trends, projecting it to strengthen in 4Q. Initial guidance is for double digit growth in its international business in 2019, while capex needs remain at $2B, lifting the company’s FCF. Its equipment will be fully deployed by the 4th quarter, setting the stage for greater pricing power in 2019. However, its North American geography is projected to get worse before it gets better. During the quarter, SLB repurchased 1.5M shares. On the negative side, 3Q18 guidance came below consensus, with EPS up 10-15% q/q. Overall we are pleased with the results, and believe patience is key with this stock to see improving free cash flow.

SLB Thesis:

1. After 5 years of significant underperformance, The Energy Sector is historically cheap and SLB is

historically cheap relative to the sector – despite being one of the highest quality Energy companies

in the world

2. As the leading Global Oil Services company, SLB is well positioned to benefit from (1) Secular

growth in U.S. shale production and (2) Cyclical rebound in global oil production/oil prices

3. SLB is a high quality company within a highly cyclical industry – SLB has generated 16% annual

Returns on Invested Capital over the past 10 years and throws off a lot of free cash flow

4. SLB’s stock is highly levered to increasing oil prices and will not wait for the turn to make its

move. We are also getting closer to a bottom in EPS estimates and SLB protects better than most

energy stocks on the downside due to its high quality nature – strong balance sheet, ROIC, cash

flows

$SLB.US

[tag SLB]

Julie S. Praline

Director, Equity Analyst

Direct: 617.226.0025

Fax: 617.523.8118

Crestwood Advisors

One Liberty Square

Suite 500

Boston, MA 02109

www.crestwoodadvisors.com

PLEASE NOTE!

We moved! Please note our new location above!

Bank of America (BAC) Q2 2018 results

Bank of America (BAC) reported core Q2 EPS of $.67 above market expectations of $.65 due to solid expense control, better card income and capital market results. BAC continues to be levered to rising rates, improve the balance sheet and return capital to shareholders. BAC increased the dividend by 25% and plans to return $26b to shareholders via buybacks and dividends for a shareholder yield over 8%.

Current Price: $30.8 Price Target: $37 (Increased from $30 – 15x 2018E)

Position Size: 3.5% Trailing 12-month Performance: 25.5%

Q1 Highlights:

  • Solid results, despite weak revenue growth
    • Good control of noninterest expense -5% yoy
    • Strong digital footprint
      • Increased digital bank users to 35.7m from 30.8m a year ago
      • 76% of deposits are conducted digitally
    • Focused on returning capital to shareholders
  • Continued improvement in the balance sheet
    • Common equity tier 1 ratio 11.3% up from 7.8% in 2009 and above Fed’s target of 9.5% for BAC
    • ROE of 10.8% with a return on tangible book of 15.2%
    • Net charge offs 0.43%
  • Net Interest income was increased 5% YoY
    • Loan growth of 5% and deposit growth of 3%
    • 100 bps increase in yield curve will increase net interest income by $3.2b over the next year, driven by sensitivity to short-term rates
    • Strong growth in online banking with attractive offering for consumers – up 19% yoy.
  • Continued strong expense controls
    • Total headcount fell 1%
    • Efficiency ratio improve 100 bps to 59%
  • BAC is still attractively valued at 1.1x Book value and 14.2x P/E
    • New target represents 1.5 times book value
    • Expect the stock to grind higher given our view of accelerating EPS over the next 12-18 months driven by:
      • BAC’s focus on balance sheet quality
      • Declining expenses
      • Positive leverage to rising rates
  • BAC is focused on returning capital to shareholders increasing the dividend 25% and a shareholder yield over 8%

BAC Thesis:

· BAC has transformed its business to a higher quality mix

· Recent results demonstrate an accelerating EPS growth and returns over the next 2 years

· BAC has become a return of capital story

($BAC.US)

John R. Ingram CFA

Managing Director

Asset Allocation and Research

Direct: 617.226.0021

Fax: 617.523.8118

Crestwood Advisors

50 Federal Street, Suite 810

Boston, MA 02110

www.crestwoodadvisors.com

Microsoft 4Q18 Earnings Report

Current Price: $106 Price Target: $120 (new target price; increased from $105)

Position size: 5% TTM Performance: 42%

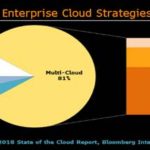
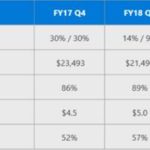
Microsoft reported solid Q4 results beating on the top and bottom line and delivering above consensus guidance. Revenue growth accelerated slightly from 16% last quarter to +17%, with double digit revenue growth across all segments. Revenue was $30B for the quarter and for the year crossed $100B for the first time. Top line results were aided by the weaker dollar which added 2pts. Windows and the PC cycle still matter, but Cloud is the key driver of growth. They saw strong demand in both, driven by a robust IT spending environment. Though Microsoft has trailed AWS, Cloud adoption is moving into a phase where Microsoft should have an advantage. The results this quarter substantiate that. The key is hybrid cloud and multi-cloud. Early cloud adopters tended to be smaller companies and digital native companies – companies that didn’t have enormous legacy data centers with tons of money invested in equipment or with critical data that they wanted to keep in-house. As larger companies with legacy IT infrastructure increasingly shift to the cloud, they will take a hybrid approach, which just means they still keep some stuff on-premise. It is a bridge between the old and new. Microsoft has an advantage with Azure stack because it is a highly differentiated product and the leading technology for hybrid. They are also well positioned because they have entrenched enterprise relationships. The trend to multi-cloud refers to companies wanting to use multiple vendors so there is no vendor lock-in or loss of bargaining power. So, adopting AWS doesn’t mean you wouldn’t also use Azure. Microsoft is and will continue to be a beneficiary of this trend.

Commercial Cloud (Office 365 commercial, Azure, Dynamics 365) revenues were $6.9B, up 53% and accounting for 23% of revenue in the quarter (up slightly from 22% last quarter). For the full year, Commercial Cloud was $23.2 a little ahead of expectations and full year cloud run rate is now close to $28B. Importantly, cloud margins continue to improve (+600bps YoY) which will help drive better FCF margins as the business scales. Within Commercial Cloud, Azure grew 89%. The “More Personal Computing” segment which includes Windows, Xbox, Surface, and all other hardware continues to improve. That segment accelerated to 17% growth on solid results from Windows Commercial (+23%), Surface (+25%) and gaming (+39%). This segment performance is consistent with their previous comments of an improving commercial PC market and a “stabilizing” consumer PC market. Free cash flow in the quarter was over $7.4B down 15% YoY reflecting higher capex in support of their cloud business. Capex was $4B in the quarter vs $2.3B in 4Q17. They returned $5.3 billion to shareholders with $3.2B in dividends and $2.1B in share repurchases.

Valuation:

· They produced $32B in FCF for the year putting them at close to a 4% FCF yield – reasonable for a company with double digit top line growth, high ROIC and a high and improving FCF margins.

· They easily cover their 1.6% dividend, which they have been consistently growing.

· Strong balance sheet with about $134B in gross cash, and about $57.5B in net cash.

· Increasing price target to $120 based on ~30% FCF margins and mid-to-high single digit top line growth.

Investment Thesis:

· Industry Leader: Global monopoly in software that has a fast growing and underappreciated cloud business.

· Product cycle tailwinds: Windows 10 and transition to Cloud (subscription revenues).

· Huge improvements in operational efficiency in recent quarters providing a significant boost to margins which should continue to amplify bottom line growth.

· Return of Capital: High FCF generation and returning significant capital to shareholders via dividends and share repurchases.

$MSFT.US

[tag MSFT]

Sarah Kanwal

Equity Analyst, Director

Direct: 617.226.0022

Fax: 617.523.8118

Crestwood Advisors

One Liberty Square, Suite 500

Boston, MA 02109

www.crestwoodadvisors.com

PLEASE NOTE!

We moved! Please note our new location above!

UNP 2Q18 earnings recap: underlying business trend is good, one-time items hit its operating ratio

Key Takeaways:

UNP reported revenue growth of 8%, but an operating ratio of 63% above consensus of 62% (lower is better). Fuel prices had a negative impact on margin of -100 bps (fuel costs +48% y/y), as the company passes on the increased fuel expenses to clients with a lag. The services related costs increase offset the productivity gains this quarter. UNP noted some one-time challenges that impacted performance: a tunnel collapse being out of service from May 29 to June 20 (this added 4-5 days for some freight as trains had to be re-routed), and train-crew shortages (which is improving). While those costs should persist in 3Q, overall 2H should show some productivity gains. Another negative point highlighted during the call was the decline in Permian volumes Frac Sand, as local sand mines come online. Freight revenue experienced positive performance: +4% volume (accelerating from 2% in 1Q18), +2% core pricing, +3.5% fuel surcharge, and a -1% mix impact. Free cash flow was better than expected, but helped by lower capex than estimates. The management team is more positive in its business environment outlook, and lifted its volume growth guidance for 2018 to low-to-mid single digit growth (from low single digit).

Volume growth will be supported by:

o future plastic shipments (chemical plants coming on stream)

o truck drivers shortages pushing conversion to rail in intermodal

o e-commerce supporting shipment of parcels.

So far UNP is being lifted by positive trends lifting volumes and prices, but a couple of one-time items impacted its productivity, masking any improvement in its operating ratio. We will monitor the fuel cost increase to make sure it is being passed on to customers in the coming quarters. We are not lifting our price target at this time, as we need to see its operating ratio improve at this stage of the economic cycle.

Continue reading “UNP 2Q18 earnings recap: underlying business trend is good, one-time items hit its operating ratio”

Crown Castle International ($CCI.US) Q2 2018: Outpaced guidance and expectations

Crown Castle International Corp. (CCI) had another strong quarter, outpacing guidance and expectations for top and bottom line as well as FFO per share. CCI introduced slightly higher guidance for Q3 2018 and the remainder of the year. During the quarter, CCI paid out a dividend of $1.05 per share, a year over year increase of 11%. This is above the company’s goal of 7-8% dividend growth annually. Growth in the towers industry continues to be driven by consumer demand for data which leads to investment by mobile carriers. CCI’s investment in small cells and fiber are performing better than expected and should accelerate in the second half of the year.

Current Price: $111 TTM Return: 13.05%

Target Price: $125 Position Size: 2%

Continue reading “Crown Castle International ($CCI.US) Q2 2018: Outpaced guidance and expectations”