CSCO 1Q19 Update

Current Price: $46 Target Price: $54

Position size: 4.4% TTM Performance: 30%

Thesis intact, key takeaways:

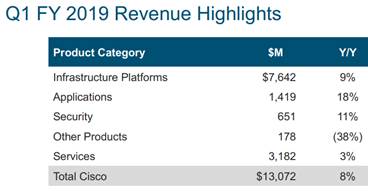
· Cisco reported a really solid Q1 with better than expected sales and EPS and issued guidance in-line with consensus. Top line growth was ~8%. FY19 sales growth is expected to be +5-7% and GM guided better than expected.

· Impact of the 10% tariff was immaterial in the quarter. They were able to offset with pricing. Their guidance assumes some impact from the tariff escalation to a 25%.

· The transformation they laid out 3 years ago is working, driven by their transition to a software and services focused business. They accelerated revenue growth, expanded margins, generated strong operating cash flow and double-digit EPS growth.

· Growth was broad-based across all geographies, product categories, and customer segments.

· The percentage of recurring revenue is now ~1/3 – they set a goal of 37% by 2020.

· Gross margins increased by 110bps YoY mostly driven by Product gross margins, while Service margins where basically flat.

· Switching had another great quarter and routing returned to growth.

· Campus switching strength – Infrastructure Platforms segment (58% of revenue; +7% YoY) driven solid demand for their Catalyst 9k products. Catalyst 9K was launched last year and is only sold with a subscription. The product is a key part of their strategy of shifting to recurring revenue. It involves “intent-based networking” – this automates configuration, saving labor hours. The reason it’s relevant and resonates with customers is because networks are becoming more complex. Enterprises are expanding to multi-cloud and hybrid-cloud environments with growing data traffic from a proliferation of new devices.

· They have $43B in cash. In the quarter they returned $6.5B to shareholders through dividends and buybacks.

Valuation:

· They have close to 3% dividend yield which is easily covered by their FCF.

· Forward FCF yield is over 7%, well above sector average and is supported by an increasingly stable recurring revenue business model and rising FCF margins.

· The company trades on a hardware multiple, but the multiple should expand as they keep evolving to a software, recurring revenue model. Hardware trades on a lower multiple because it is lower margin, more cyclical and more capital intensive.

Thesis on Cisco

· Industry leader in strong secular growth markets: video usage, virtualization and internet traffic.

· Significant net cash position and strong cash generation provide substantial resources for CSCO to develop and/or acquire new technology in high-growth markets and also return capital to shareholders.

· Cisco has taken significant steps to restructure the business which has helped reaccelerate growth and stabilize margins.

$CSCO.US

[tag CSCO]

Sarah Kanwal

Equity Analyst, Director

Direct: 617.226.0022

Fax: 617.523.8118

Crestwood Advisors

One Liberty Square, Suite 500

Boston, MA 02109

www.crestwoodadvisors.com

PLEASE NOTE!

We moved! Please note our new location above!

Aramark 4Q18 Earnings Update

Current Price: $35 Price Target: $43

Position Size: 2% TTM Performance: -11%

Aramark missed consensus, but the stock was up on strong organic growth and solid margins. They will update 2019 guidance at their investor day in a few weeks.

Key Takeaways:

· Aramark reported 4Q18 earnings, missing on the top and bottom line, though full year adj. EPS of $2.25 was at the midpoint of their guidance.

· Despite the miss, the stock was up because the organic growth was strong and they hit their margin target. The miss was largely driven by currency and the negative impact of natural disasters – mostly wildfire related.

· Constant currency sales grew 8% in the quarter. This increase was composed of 5% from acquisitions (about three quarters of which was from AmeriPride) with the remaining 3% growth generated by their legacy business.

· Last quarter they raised organic revenue growth guidance from 3% to 3.5% and they delivered. The Q4 +3% organic growth put full yr. organic growth at 3.4%

· Heading into the 2nd half of the year, guidance was heavily back-half weighted.

· Excluding natural disasters and currency, they hit their target of 100bps operating margin improvement that they set at their investor day in 2015. They did this through reductions in food, labor and SG&A expense.

· They have their next investor day coming up on December 11. Management is not providing specific guidance until then.

· Retention rate remains strong in mid-90’s.

Continue reading “Aramark 4Q18 Earnings Update”

Booking Holdings 3Q Earnings Update

Current Price: $2,007 Price Target: $2,400

Position Size: 2.5% TTM Performance: 20%

· Key Takeaways:

1. Beat on revenue, missed on EPS. Miss driven largely by higher ad spend.

2. Strong Q3 room night growth of 13%, well ahead of guidance.

3. Strong Q4 guidance for room nights, revenue and EPS.

4. Increased ad spend helped re-accelerate growth.

· Bookings of $24.3B were better than expected (+14% constant currency) and an acceleration from last quarter. This is important as bookings guidance was a disappointment last quarter. Management blamed weak trends on the World Cup and unseasonably warm weather in Europe. They saw an acceleration after they reported 2Q results.

· Part of the disappointment last quarter was weak room growth that was somewhat self-inflicted. Room night growth slowed previously due to reduced programmatic ad spend….and maybe some weather like they said. They’ve since increased ad spend (which contributed to the EPS miss). Ad spend has been part of their engine of growth and their ability to spend at scale has enabled their success. They spend back more than a third of their revenue on advertising. That’s over $4B. Expedia does the same thing. They have been trying to “optimize” this for several quarters by spending less on performance advertising (e.g. Google AdWords) and more on brand advertising (e.g. TV commercials). The idea is that brand advertising drives direct traffic to their site, resulting in a higher ROI. This ad spend/rev growth algorithm will continue to be a focus going forward as clearly the relationship between growth and spend persists and their ability to shift to “higher ROI” ad spend still isn’t clear.

· The good news is direct channel mix did increase (now ~50% of booked room nights). Probably not a coincidence that they now say over 50% of their bookings come from mobile devices, as mobile traffic is more likely to be direct (via app).

· Merchant revenues are growing faster than agency revenues. With merchant revs they get paid up front for the full cost of travel and hold onto the cash until remitted to the hotel/home owner (less their fee) at the travel date. Revenues from their growing home rentals business (competes w/ Airbnb) are primarily driving this as they’re booked as merchant revs. This dynamic drives a growing negative cash cycle which benefits their FCF. So, as this business grows this will be a tailwind to FCF.

· They continue to work on a local experience product through both organic investment and acquisitions (FareHarbor).

Continue reading “Booking Holdings 3Q Earnings Update”

CVS 3Q18 earnings: good core business results and better synergies with Aetna ahead

Key Takeaways:

Current Price: $77.77 Price Target: $90

Position Size: 2.25% 1-Year Performance: +10.3%

The stock is up today after releasing good Q3 earnings results, and positive comments regarding their Aetna acquisition. Total sales were up +2.4%, and EPS +15.5% (mostly on lower tax). CVS’s PBM retention rate for next year remains high at 98% (previous number was ~95%), showing that the AET deal is not disrupting their PBM business at this point. 2018 guidance on CVS’s core business was reiterated, but 4Q results should be diluted by the AET deal costs. The Aetna transaction should close before Thanksgiving, and CVS’s management team seems incrementally more positive on the level of expected synergies (now to exceed $750M). Synergies will come from reduction in corporate expenses, integration of operations and medical costs reduction (integration of pharmacy and medical claims, leveraging the clinical data and utilizing CVS’s community assets: points of distribution and health professionals). The overall goal will be to reduce expensive hospital admissions and provide better management to the complex chronic disease cases. CVS will provide clearer details on the combined entity’s earnings guidance in February 2019. The Analyst day will also move to June (from December). Overall we remain positive on the name.

Continue reading “CVS 3Q18 earnings: good core business results and better synergies with Aetna ahead”

XOM 3Q18 earnings: clear improvement from last quarter

Key Takeaways:

Current Price: $81.86 Price Target: $86

Position Size: 1.83% 1-year Performance: -1.6%

Exxon reported 3Q18 results, with a clear production improvement from last quarter. Its Refining activity outperformed thanks to improved utilization, better reliability and lower maintenance activities (although the later should pick up in 4Q18). XOM continues to see organic growth opportunity in its portfolio. The management team continues to see its dividend as the key method to return capital to shareholders, rather than share buybacks. On the ESG front, XOM is facing some prominent lawsuits regarding climate change costs and how the company might have misled investors. The financial risks of those lawsuits should be minimal to XOM’s operations. The bigger impact on the company’s operations would however be the reclassification of oil & gas waste from solid to hazardous materials, which would add disposal costs to the entire industry. The EPA decision should come in March. No change to our price target or position size.

Continue reading “XOM 3Q18 earnings: clear improvement from last quarter”

Apple Q418 Earnings Results

Apple reported good numbers for Q4, but disappointed on guidance and indicated they would stop reporting unit numbers. As consolation for the reduced disclosure, they are going to start reporting gross margins on Products and Services separately. They beat on top and bottom line and units were basically in-line with expectations. Revenues were $63B, up 20% and EPS was $2.91 (vs street $2.78), +41% YoY. All regions posted double digit growth.

Key Takeaways:

· The selloff today is because of guidance and the reduced/changed disclosure. Q1 (calendar Q4) is their seasonally biggest quarter and typically accounts for 35-36% of annual revenues.

o Weak guidance: Street is at the high end of 1Q19 revenue guidance. Guidance blamed on Fx ($2B headwind) and “macroeconomic uncertainty particularly in emerging markets.” Gross margin guidance was also weaker. The midpoint of rev and GM guidance would put 1Q19 gross profit about $1B shy of expectations.Weaker guidance may be conservative given growing mix of services and falling NAND (memory) prices.

o No more unit numbers: This is a little disappointing, especially given slowing global smartphone unit sales. Whenever a company reduces disclosures it’s viewed as a bad thing. Apple has historically reported units for iPhone, iPad and Mac. This also allows for ASP calculation. So going forward we’ll have neither of those.

o Gross Margin disclosure – this could be a silver lining to their disclosure changes if Services are more profitable than expected. This is especially true given Services are expected to be the new leg of growth.

· Weak iPad numbers, but they gained share. Also, not surprising given pending new product launches.

· Apple’s iPhone pricing power is strong with an average selling price (ASP) of $793 (much better than expected). That’s a 28% increase YoY and 10% increase sequentially. This is key as units were only up 0.5% for the year. So, iPhone revenues, which were up 18% for FY18, were basically driven entirely by higher ASPs. iPhones are about 63% of total revenues.

· Apple is taking share in smartphone units – 2018 should be the 2nd year in a row of global unit declines in smartphones. Calendar YTD Apple iPhone units are up 1.4%.

o In Q3 smartphone vendors shipped 355.2m smartphones, down 6% from the 377.8m units in Q3 2017.

o Apple gained 80bps of share, Samsung lost 180bps and Huawei gained 420bps.

o Huawei overtook Apple as #2 for Q3. However, Apple typically wins calendar Q4, while Samsung typically dominates the first three quarters of the year (but they’ve been ceding share to Huawei this year).

Valuation:

  • Strong balance sheet and FCF generation continue. $123B in net cash. 2018 FCF was $64B.
  • The stock is undervalued and the substantial buyback will support valuation. Trading at close to a 1.4% dividend yield, a 6.6% FCF yield and a 15.3x P/E.
  • Returned almost $90 billion to investors during the year, including $73B in share repurchases and $14B in dividends.

The Thesis for Apple:

  • One of the world’s strongest consumer brands and best innovators whose product demand

has proven recession resistant.

  • Halo effect -> multiplication of revenue streams: AAPL products act as revenue drivers

throughout portfolio – iPhone, iPod, MacBooks, iPad > iTunes, Apps, Software, Accessories,

  • Mac gaining share in PC market and iPhone robust global demand driven by China/EM.
  • Strong Balance and cash flow generation.
  • Increasing returns to shareholders via dividends and buybacks.

$AAPL.US

[tag AAPL]

Sarah Kanwal

Equity Analyst, Director

Direct: 617.226.0022

Fax: 617.523.8118

Crestwood Advisors

One Liberty Square, Suite 500

Boston, MA 02109

www.crestwoodadvisors.com

EOG 3Q18 earnings results: stock weak on recent higher capex levels and lower production near term but long term thesis intact

Key Takeaways:

Current Price: $102 Price Target: $136

EOG reported better well productivity that led to oil and total production levels above expectations. Following 3Q results, the company is lifting its 2018 oil volume guidance by 1%, although total production remains below consensus (lower natural gas production). On the negative side this quarter, the 3Q18 oil production increase came with an increase in capex (and a 2018 capex guidance increase of 4%). We believe the stock is weak today as the management team is expecting slower growth in 4Q18 and 1Q19, since it plans on slowing down drilling activity. On the positive side, EOG maintained its 5% well costs reduction target in 2018 and even further reduction in 2019. FCF should also inflect positively in the coming year as capex shouldn’t increase as it did in 3Q, and capital efficiency should rise. We are not changing our price target or position size.

Continue reading “EOG 3Q18 earnings results: stock weak on recent higher capex levels and lower production near term but long term thesis intact”

Black Knight 3Q18 Earnings

· They missed slightly on top line, beat on EPS and reiterated full year guidance. The street is at the high end of their guidance for the year. Revenues were up 7% and EPS was up 38%.

· Data analytics segment (~15% of revenue) revenues were up 2% an improvement from down 4% last quarter. YTD segment revenues are flat, though growth going forward in this segment is targeted at ~3-5%.

· Software Solutions segment (~85% of revenue) was up 7% driven by loan growth, higher average revenue per loan and cross-sales to existing clients.

o Within this segment servicing (~75% of revenue) grew 7%. This is steadier than their originations revenue. They continue to dominate first lien loans with 62% share and are growing share in second lien loans. They have high-teens share of second lien and expect to reach 30% once current commitments are implemented.

o Originations (~10% of total revs), which is made up of new loans and refi’s, grew 8%. Refinancing, down 28%, continues to be negatively impacted by rising rates.

o Margins expanded 230bps.

o Trends in this segment highlight a dynamic weighing on US housing statistics. The issue is a lock-in effect from lower mortgage rates. Homeowners have mortgage rates lower than prevailing rates making them less likely to sell as it would mean taking out a new mortgage at a higher rate. This is decreasing housing inventory and existing home sales. The average length of homeownership tenure has been rising from around 4 years in 2000 to over 8 years now.

Continue reading “Black Knight 3Q18 Earnings”

Sanofi 3Q18 earnings results

Key Takeaways:

Current Price: $44.8 Price Target: $51

Position Size: 1.56% 1-year Performance: -8.6%

Sanofi reported 3Q18 sales results 3& above expectations thanks to a strong rebound in vaccines (strong Flu shipments with $985M in sales +4% y/y, and recovery in Pediatric $511M in sales, +18% y/y) & in Emerging Markets. Regeneron added positively to its income, helping the 8% EPS beat vs. consensus. Sanofi raised its 2018 EPS outlook from 3-5% to 4-5%, as the strong momentum in Vaccines should continue in 4Q18, as guidance was raised to mid- to high-single-digit growth. Sales of Praluent (cholesterol drug) reflected the continued significant payer utilization restrictions in the US and limited market access in Europe. Sanofi’s Diabetes business continues to struggle (down 11% y/y – Lantus had $897M in sales, down 20% y/y), but the recent Bioverativ and Ablynx acquisitions should help drive growth going forward. Dupixent in Immunology is reaching an attractive level ($225M in sales, up 200%). Aubagio that treats multiple sclerosis, grew 12% ($426M in sales) and is the second biggest selling drug. Overall results were reassuring that Sanofi could return to top and bottom line growth after a couple years of disappointment.

Continue reading “Sanofi 3Q18 earnings results”

Visa 4Q18 Earnings Update

Current Price: $142 Price Target: $160

Position Size: 3.3% TTM Performance: 25%

Visa reported a mixed Q4 with revenue slightly below the street but better than expected EPS. For FY18 revenues were +12% and EPS was +32%. Tax reform added 10 points to EPS growth. For full year, currency added 1% to top line and 1.5% to EPS. Strengthening dollar meant Fx went from a 150bps tailwind in Q3 to a 50bps headwind in Q4. They issued solid 2019 guidance in line with street. Full year revenue growth guided to up low-double-digits and EPS up mid-teens. This time last year they guided to high-single-digit revenue growth – they ended up with +12%. So incrementally more positive on outlook going into 2019. Management pointed to the US consumer being stronger than they expected. Debit growth (which skews younger and lower income) has also been stronger.

Continue reading “Visa 4Q18 Earnings Update”