Crown Castle Earnings Update

Crown Castle reported a good quarter yesterday with a broad beat and strong guidance. CCI beat on both site rental revenue and networks services revenue, and reported better than expected EBITDA and EPS.

Thesis intact, highlights on the quarter:

· The company is experiencing the highest level of tower leasing activity in more than a decade, and management expects this to continue.

· Organic site rental revenue was +6%

· CCI small cell pipeline in 2019 is 10 – 15 thousand nodes (trending now on the lower end around 10k)

· Management provided FY20 guidance for the first time for ~8% AFFO growth and assumes the proposed merger between T-Mobile and Sprint in 1Q20

· Strong 2020 outlook for new leasing activity for towers: +$145 million at the mid-point is $5 million higher than +$140m outlook for 2019.

· Fiber guidance reflects an expectation for improved leasing activity. Initial outlook for new leasing activity in 2020 of $165 million is +$15 million higher than the company’s 2019 outlook for $150 million in fiber solutions.

· CCI’s outlook on fiber and small cells reflects carriers’ deployment of new spectrum and densification of their networks in preparation for 5G

· Big 4 carriers make up 90% of site rental revenue – AT&T, Sprint, T-Mobile and Verizon.

· Could see churn picking up from the TMUS/S merger in 2020. However, management views a T-Mobile/Sprint merger as a long-term positive as Sprint has valuable spectrum holdings which it has not been able to fully deploy due to capital constraints, and T-Mobile appears likely to accelerate deployment of 5G as part of its anticipated integration. Management believes that the investment from a combined T-Mobile/Sprint, with or without DISH as a fourth wireless carrier, will likely more than offset the impacts of T-Mobile decommissioning duplicative sites.

· Dividend increase of 7% delivered on targeted annual range of 7-8%.

Valuation:

· Strong AFFO growth will drive the valuation (2020 expected 8% YoY). They have a 10 year AFFO CAGR of ~14%.

· High incremental margins means AFFO growth should outpace or be in line with site rental revenue growth.

· Low maintenance capex (~2% of revenue) supports high AFFO margins.

· Expected $2.479B in AFFO ($5.94/share) in 2019 is a yield of just under 5%. This is an attractive yield given the secular growth potential.

The Thesis on Crown Castle:

1. CCI is well positioned to capitalize on secular mobile data demand growth and small cell/urban opportunity.

2. Strong competitive position. Leading US tower company.

3. Toll booth business – offensive (secular growth) & defensive (4% dividend & contracted cash flows) characteristics.

4. Revenues derived from long term contracts with price escalators and good visibility.

Sarah Kanwal

Equity Analyst, Director

Direct: 617.226.0022

Fax: 617.523.8118

Crestwood Advisors

One Liberty Square, Suite 500

Boston, MA 02109

www.crestwoodadvisors.com

$CCI.US

[tag CCI]

Constellation Brands (STZ) earnings summary

Key takeaways:

Current Price: $192 Price Target: $226 (NEW)

Position Size: 2.52% 1-Year Performance: +15.5% (since inception 12/20/2018)

Constellation Brands released their 2Q FY20 earnings results this morning. While their beer performance was stellar as usual (+7.5% depletion), it was overshadowed by their cannabis investment. Canopy Growth proves to be more challenging, with close to $500M in losses this quarter, and STZ recognizing a $839M decrease on its equity fair value. This is not totally surprising as STZ ousted Canopy’s founder and CEO Bruce Linton this summer, being “not pleased” with Canopy’s results, announcing this summer that they needed 3-5 year to turn profitable.

The FY20 guidance of 7-9% beer sales and operating income growth was maintained, while its wine sales decline is now better at -15% to -20% (vs. prior -20% to -25%). The divestment of the lower-priced wines is now expected to close at the end of 3Q FY20, explaining why the adjusted sales and EPS guidance was raised slightly to account for a later divestment date than expected. Gross margins expanded 45bps.

We are excited to hear that Constellation is expanding its Corona line with the launch of a Corona Hard Seltzer next year (a high growth drink category). We are updating our price target to $226 to account for the sale of the lower priced wine & spirit brands (lowering FCF $).

Below is a picture of the new product (not yet released by the company – this was found on a blog…)

Investment Thesis:

· Adding STZ helps position our portfolio to be more defensive at this stage of the economic cycle

· STZ is down ~20% YTD, giving us a good entry point

· STZ continues to have HSD top line growth and high margins that should incrementally improve going forward

· STZ comes out of a heavy capex investment cycle to support its growth: FCF margins are set to inflect thanks to lower capex

[tag STZ]

$STZ.US

Julie S. Praline

Director, Equity Analyst

Direct: 617.226.0025

Fax: 617.523.8118

Crestwood Advisors

One Liberty Square

Suite 500

Boston, MA 02109

www.crestwoodadvisors.com

McCormick (MKC) 3Q19 earnings review

Key Takeaways:

Current Price: $167 Price Target: $174 (NEW)

Position size: 2.80% 1-Year Performance: +26%

McCormick released 3Q EPS that beat expectations with sales +2.2% (ex-FX), thanks to positive volume/mix in its Consumer segment: sales were +4%. Consumer operating margins expanded 250bps y/y, leading adjusted consolidated margins higher 160bps y/y. Their Flavor Solutions segment proved once more to be volatile quarter-to-quarter as sales were down 0.4%. The company had a warehouse transition to support its future growth which had a negative impact on sales as well. The management team raised the EPS guidance for the year to $5.30-$5.35 from $5.20-$5.30 but this is mostly driven by lower taxes as sales growth (ex-FX) was narrowed down to 3-4% from 3.5% and operating income from 8-10% to 8-9%. As the reduction in leverage is ahead of schedule, MKC announced being on the hunt for companies to acquire. The company is also expecting to spend more in advertising in the fourth quarter, an important season for the company with the Holidays and home cooking. While the quarter was good, we think the stock is reacting very well today (+7%) as the management team highlighted during the call that the growth in the private label category recently moderated significantly. The competition from private labels has been strong in the past years, so we see this as a good explanation for today’s move back to prior trading levels the stock reached this summer (the stock had been weak after a sell-side analyst downgrade in August). We are updating our price target to $174.

The Thesis on MKC:

• Industry Leader: McCormick & Company (MKC) is a leading manufacturer of spices and flavorings. MKC has been in business for 120 years and the founding family still has ownership interest

• Growth opportunity: Spice consumption is growing 3 times faster than population growth. With the leading branded and private label position, MKC stands to be the biggest beneficiary of this global trend

• Offense/Defense: MKC supplies spices to major food companies including PepsiCo and YUM! Brands giving it a blend of cyclical and counter-cyclical exposure

• Balance sheet and cash flow strength offer opportunities for continued consolidation through M&A in the sector

$US.MKC

[tag MKC]

Julie S. Praline

Director, Equity Analyst

Direct: 617.226.0025

Fax: 617.523.8118

Crestwood Advisors

One Liberty Square

Suite 500

Boston, MA 02109

www.crestwoodadvisors.com

TJX 2Q20 Earnings Update

Current Price: $50 Price Target: $60

Position Size: 3.4% TTM Performance: 1%

TJX initially traded down after reporting revenue that missed quarterly estimates and guiding below consensus for next quarter. Since the call the stock has recovered as management indicated weather in May dampened same store sales (SSS) results which contributed to the miss. SSS in June and July materially improved. Weak SSS at HomeGoods also contributed to the miss, but mgmt. said that was almost entirely self-inflicted and not really about a weakening macro environment. Additionally, management’s commentary around their inventory positioning eased concerns of bloated inventories (inventory growth outpaced sales growth in the quarter). Full year SSS and EPS guidance maintained.

Key takeaways:

· Revenue missed on same store sales of +2% vs expected +3%.

· Traffic was again the biggest driver of SSS. E-commerce sales are not included in SSS numbers.

· EPS was in-line with expectations.

· Management sees Q3 EPS of $0.63-$0.65, below consensus of $0.68, on same-store sales growth of 1%-2%. In Q3 they are lapping their strongest quarter last year which saw a 7% consolidated comp increase and a 9% comp at Marmaxx.

· In Q2, their core Marmaxx division (60% of revenue) delivered SSS growth of +2%.

· Flat SSS at HomeGoods contributed to the miss – management attributed this to issues in a few categories which they are working to fix. This led to higher markdowns and some margin compression in this segment. Mgmt said 80% to 90% self-inflicted execution issues and very, very, very little macro environment.

· International comp sales grew an impressive 6%. Despite the challenging retail landscape in Europe they continue to take share as many other major retailers across Europe report slower sales growth and close underperforming stores.

· Higher payroll costs and escalating freight expenses from rising home-furniture penetration are margin headwinds

· Merchandise margin was down, but would have been positive ex-freight.

· In terms of inventory, mgmt. said they are “thrilled with the tremendous buying opportunities we see in the marketplace, and are in an excellent position to take advantage of them .”

· When asked on the call about the impact of tariffs they said in the “short term, we believe some of the advantageous buys that we’re making more recently could be due to early delivery of tariff category merchandise.”

· Chart below demonstrates TJX’s resistance to e-commerce and economic cycles. Despite the ramp in e-commerce share of retail over the last several years, of the companies listed below TJX is nearly half of aggregate incremental spend. The companies listed below represent ~$200B of the $275B in US apparel retail sales. Additionally, in the ’08 to ’09 period they were one of few retailers that continued to grow and post positive SSS.

Continue reading “TJX 2Q20 Earnings Update”

CSCO 4Q19 Update

Current Price: $46 Target Price: $63

Position size: 4.1% TTM Performance: 7%

CSCO reported strong Q4 results, but guided below expectations for next quarter. Revenue growth guided to 0% to +2% vs street +2.6% and Q1 adj. EPS guided to $0.80c to $0.82 vs street $0.83. Weaker than expected guidance driven by Server Provider end markets (e.g. telecoms) and China. While China is only about 3% of sales, revenue was down 25% in Q4 and is down “very dramatically” in Q1 which mgmt attributed to the trade war and said that with state-owned enterprises in China they are being uninvited to bid. Their Service Provider end markets have been weak for some time, but should improve over time as telecoms spend to build out the core of their networks for 5G. Management’s tone about the macro environment was more negative…” we did see in July some slight early indications of some macro shifts that we didn’t see in the prior quarter.”

Thesis intact, key takeaways:

· Total revenue was $13.4 billion, up 6%. Non-GAAP EPS was $0.83, up 19%. Q4 gross margin was 65.5%, up 2.3 points.

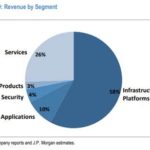
· Infrastructure platforms (largest segment, ~58% of revs) grew 6%. All of the businesses were up with the exception of routing. Switching had a great quarter with double-digit growth with the continued ramp of Cat 9K and strength of the Nexus 9K. Routing declined due to weakness in service provider end markets.

· Applications were up 11% with collaboration, AppDynamics and IoT software all up double digits.

· Security was up 14% with strong performance in identity and access, advanced threat, unified threat and web security.

· Service revenue was up 4% driven by software and solution support.

· They continue to transform their business, delivering more software offerings and driving more subscriptions. Subscription revenue was 70% of total software revenue, up 12pts YoY and 5 points sequentially. This transition will drive an upward trend in CSCO’s margins over the next several years.

· While orders were flat YoY, orders outside of service provider grew mid-single digits. Total product orders growth was flat. By geography, Americas was up 1%,EMEA was up 4% and APJC was down 8%. Total emerging markets were down 8% with the BRICS plus Mexico down 20%. By customer segments, enterprise was down 2%, commercial grew 7%, public sector was up 13% and service provider was down 21%.

· Cisco is helping their customers change their technology infrastructure to accommodate new technologies like cloud, AI, IoT, 5G and WiFi 6. Their evolving portfolio of products help customers navigate this complexity by helping them simplify, automate, and secure their infrastructure. They are in the early innings of evolving network architectures.

Valuation:

· They have a 3% dividend yield which is easily covered by their FCF.

· In their Q2 fiscal ’18 earnings call, they said they would return $31 billion through share repurchases over the following 18 to 24 months. As of Q4 fiscal ’19 they completed that commitment with share repurchases of 32.6 billion. Going forward, they will return to a capital allocation strategy of returning a minimum of 50% of their FCF to shareholders annually through share repurchases and dividends. This indicates much less buyback going forward as their annual dividend is $6B and half of annual FCF would be less than $8B.

· They have ~$9B in net cash. In the quarter they returned $6B to shareholders – $1.5B in dividends and $4.5B in buybacks.

· Forward FCF yield is ~7.5%, well above sector average and is supported by an increasingly stable recurring revenue business model and rising FCF margins.

· The company trades on a hardware multiple, but the multiple should expand as they keep evolving to a software, recurring revenue model. Hardware trades on a lower multiple because it is lower margin, more cyclical and more capital intensive.

Thesis on Cisco:

· Industry leader in strong secular growth markets: video usage, virtualization and internet traffic.

· Cisco is the leader in enterprise switching and service provider routing and one of the few vendors that can offer end-to-end networking solutions.

· Significant net cash position and strong cash generation provide substantial resources for CSCO to develop and/or acquire new technology in high-growth markets and also return capital to shareholders.

· Cisco has taken significant steps to restructure the business which has helped reaccelerate growth and stabilize margins.

$CSCO.US

[tag CSCO]

Sarah Kanwal

Equity Analyst, Director

Direct: 617.226.0022

Fax: 617.523.8118

Crestwood Advisors

One Liberty Square, Suite 500

Boston, MA 02109

www.crestwoodadvisors.com

PLEASE NOTE!

We moved! Please note our new location above!

Cisco down after hours on weak guidance

Cisco reported Q4 results that beat expectations, but guidance for their fiscal Q1 is below estimates. Revenue growth guided to 0% to +2% vs street +2.6% and Q1 adj. EPS guided to $0.80c to $0.82 vs street $0.83. More details to come.

Sarah Kanwal

Equity Analyst, Director

Direct: 617.226.0022

Fax: 617.523.8118

Crestwood Advisors

One Liberty Square, Suite 500

Boston, MA 02109

www.crestwoodadvisors.com

$CSCO.US

[tag CSCO]

BKNG 2Q Results

Current Price: $1,916 Price Target: $2,400

Position Size: 2.5% TTM Performance: -4.7%

Key Takeaways:

· Gross bookings growth was $25B up 5% YoY and up 10% constant currency. Guidance was for 4-6% growth constant currency.

· They booked 213 million room nights in 2Q, a 12% increase (6-8% guided).

· ADR’s down 1.5% a little better than the -2% last quarter. Geographic mix and stronger dollar negatively impacting ADR’s. Countries with lower ADR’s growing faster and European travelers to the US trading down b/c of stronger dollar.

· Revenues were $3.85B, up 9% (14% constant currency), better than the $3.75B expected.

· Bookings guidance for Q3 (peak travel season) was lower than expected, but they have a long history of guiding conservatively (chart below). Guidance for Q3 is +3-5% gross bookings growth constant currency, suggesting a deceleration from this quarter (partly driven by tougher compares). Despite this, management noted a “solid start to the summer travel season”

· Increased ad spend this quarter (+8%) aided higher bookings growth. They’ve been trying to “optimize” ad spend for several quarters which has been resulting in weaker bookings growth…clearly this ad spend/rev growth algorithm will continue to be a focus going forward as the trade-off between growth and spend persists.

· On the call they said “short-term return on our brand spending is running below our expectations. As a result, we plan on refining our spending levels on brand marketing in the second half of the year.”

· Investing for growth: focus on “connected trip” and payment platform that supports non-hotel properties. Investments will reduce their full year EBITDA growth by a few percentage points. Connected trip vision encompasses all of their brands w/ a goal of broadening focus from accommodations to other aspects of travel spend. They’ve been talking about this for a while, but focus here seems to be ramping with more emphasis on leveraging assets like Opentable.

· Alternative accommodations: this is their business that competes with Airbnb and HomeAway. This is growing faster than their overall business. They declined to give any details on the state of this business when asked.

· French digital services tax will have $32m full year impact.

Continue reading “BKNG 2Q Results”

CVS 2Q19 earnings summary

Key Takeaways:

Current Price: $57 Price Target: $90

Position Size: 1.64% 1-year Performance: -17%

This morning CVS published its 2Q19 earnings results, with EPS above expectations (an 11% beat) thanks to higher revenue and gross margins. Revenue was up 3.7%: pharmacy same-store-sales were +4.7% (comparable scripts were up +7.2% thanks to better adherence to taking medication) and front end same-store-sales were +2.9% (although 80bps of that was a shift in Easter holiday date y/y). On the PBM side, claims were up 4% y/y, a growth in volume that helped boost margins 9.7% y/y. Net new business is still negative (-$7.6B, on the loss of Centene and lower new contracts) but this result was better than the previously negative $8.7B provided at the June investor day. Aetna is performing well, with synergies expectations now to be $400M in 2019 vs $300-350M previously announced: formulary optimization and transition of functions happening faster than initially thought (such as consolidation of the mail operations and pharmacy). The management team raised its FY19 guidance to $ $6.89-$7.00 from $6.75-$6.90. Its 2020 EPS is currently $7, which appears conservative at this point. We believe sentiment around this name will improve as regulatory concerns dissipate and we gain more clarity on PBM business wins during the year. Continue reading “CVS 2Q19 earnings summary”

Disney Update

Disney is down pre-market on below consensus Q3 results, missing on revenue and EPS. The miss was driven primarily by disappointing results at theme parks and at the acquired 21st century Fox business (21CF). Almost all of the operating income miss was the result of one-time issues that led to disappointing results at the acquired 21CF film studio and Star (India TV and streaming). They reiterated their expectation for 21CF to be accretive to EPS in FY21. Weak domestic theme park attendance was disappointing given the Star Wars Land launch at Disneyland in Anaheim. Management attributed weak attendance to admission price increases and higher hotel rates in advance of the Star Wars Land opening. Weak attendance at Disney World attributed to people deferring visits until the Star Wars Land attraction opens there later this month. Management seemed confident that these demand issues are temporary. With a slew of changes at Disney including 21CF acquisition, further acquisition of Hulu stake from Comcast, investment behind yet to be launched DTC (including forgone licensing revenue), Disney is in a spending mode ahead of an evolving business model. So it’s not surprising that results are choppy. No change in thesis, more details to come.

Sarah Kanwal

Equity Analyst, Director

Direct: 617.226.0022

Fax: 617.523.8118

Crestwood Advisors

One Liberty Square, Suite 500

Boston, MA 02109

www.crestwoodadvisors.com

$DIS.US

[tag DIS]

Black Knight 2Q19 Earnings

Share price: $60 Target Price: $60

Position size: 2.3% TTM return: 9%

BKI reported a good quarter but lowered guidance. Revenues were +6%, slightly below consensus and adj. EPS was better at $0.49 vs $0.48 consensus. Adj. EBITDA of $148m was above consensus of $146.5m. They updated guidance to the low end of the previously given range – the decrease was due to an earlier than planned client loss from a single-client product they are discontinuing. In general, the results highlight ongoing strength in their core business as they continue to win new clients and successfully expand existing relationships through cross-selling and contract renewals.

Key Takeaways:

· Despite slightly weaker than expected revenues in 2Q their strong new client pipeline in both mortgage servicing and origination software should accelerate revenue growth.

· Long term targets continue to be 6-8% revenue growth and mid-teens EPS growth. By segment, management continues to expect mid to high-single digit growth in Servicing, high-single to low-double digit growth in Origination, and low to mid-single digit growth in Data & Analytics.

· Data analytics segment (~15% of revenue) revenues were up 3% driven by growth in their property data and portfolio analytics businesses. This is a lower margin segment that has been seeing margin improvement, however this quarter margins contracted by 160bps. Adjusted EBITDA decreased 4% to $9m due to higher personnel costs as they grew their sales team

· Software Solutions segment (~85% of revenue) was up 7% driven by higher average revenue per loan and loan growth on their core servicing software solution.

o Segment EBITDA margins increased by 90bps.

o Within this segment servicing (~70% of revenue) grew 7%. This is steadier than their originations revenue. They continue to dominate first lien loans with leading share and are growing share in second lien loans. Once current commitments are implemented they will have ~70% share in first lien and ~30% share in second lien.

o Originations (~15% of total revs) made up of new loans and refi’s – revenues increased 8% driven by growth in their loan origination software business (Empower) which was up 18%. Counter cyclical aspect to this segment where falling rates bode well for mortgage origination volumes, primarily by increasing refinance activity.

· BKI has consistently performed well through tough times for their end clients, partly because they’re providing them with solutions that solve their problems like increasing efficiency and maintaining regulatory compliance.

Valuation:

· Trading at ~3.9% FCF yield –valuation is supported by growth potential, strong ROIC with a recurring, predictable revenue model (>90% recurring revenue) and high FCF margins, which is aided by high incremental margins and capex (~9% of revenue now) which should taper as they grow.

· Leverage ratio now at 3x, because of Dun & Bradstreet.

· Capital allocation priorities include opportunistic share repurchases, debt pay down and potential acquisitions.

Thesis:

  • Black Knight is an industry leader with leading market share of the mortgage servicing industry.
  • Stable business with >90% recurring revenues, long-term contracts and high switching costs.
  • BKI has high returns on capital and high cash flow margins.

$BKI.UA

[tag BKI}

Sarah Kanwal

Equity Analyst, Director

Direct: 617.226.0022

Fax: 617.523.8118

Crestwood Advisors

One Liberty Square, Suite 500

Boston, MA 02109

www.crestwoodadvisors.com

PLEASE NOTE!

We moved! Please note our new location above!