MSFT 4Q19 Earnings

Current Price: $139 Price Target: $150

Position size: 6.4% TTM Performance: 31%

Microsoft reported solid Q4 results with better than expected growth in all segments. Cloud continues to be the key driver. Q4 revenue was $31B (+14 YoY constant currency) and EPS was $1.37 (+24% constant currency). Commercial Cloud business was up 39% and saw continued margin improvement, helping to drive op income up 24% constant currency. Counted w/in that is Azure, which was up 73%. They are taking share from Amazon’s cloud offering, AWS. This should continue as they are better positioned as more large enterprises, that are longtime customers, move to the cloud. Just two days ago AT&T chose MSFT’s cloud – one of their largest cloud commitments to-date. Given their enterprise customer base, recent partnerships with VMware and Oracle, and superior Azure hybrid architecture, the company is uniquely positioned to capitalize on the growing demand for cloud services.

Key Takeaways:

· Solid growth across all 3 segments:

o Productivity & Business Processes, up 14% YoY, $11.1B

o Intelligent Cloud, up 19% YoY, $11.4B

o More Personal Computing, up 4% YoY, $11.3B.

· For the full year Commercial Cloud (consisting of O365 Commercial, Azure, Dynamics Online, and LinkedIn Commercial – this includes some revenue from the first two segments above) was $38B. That’s 30% of total revenue, and grew 39% in the quarter.

· Within Commercial Cloud, Azure growth was 64% YoY (68% constant currency) vs. 75% cc last quarter.

· Commercial Cloud gross margins improved 600bps YoY and 200bps sequentially, driven by material improvement in Azure gross margin.

· Similar to last quarter, the only area of weakness was gaming.

Valuation:

· For the full year they returned $30B to shareholders.

· Trading at a 3-4% FCF yield –still reasonable for a company with double digit top line growth, high ROIC and a high and improving FCF margins.

· They easily cover their 1.3% dividend, which they have been consistently growing.

· Strong balance sheet with about $134B in gross cash, and about $56B in net cash.

Investment Thesis:

· Industry Leader: Global monopoly in software that has a fast growing and underappreciated cloud business.

· Product cycle tailwinds: Windows 10 and transition to Cloud (subscription revenues).

· Huge improvements in operational efficiency in recent quarters providing a significant boost to margins which should continue to amplify bottom line growth.

· Return of Capital: High FCF generation and returning significant capital to shareholders via dividends and share repurchases.

$MSFT.US

[tag MSFT]

Sarah Kanwal

Equity Analyst, Director

Direct: 617.226.0022

Fax: 617.523.8118

Crestwood Advisors

One Liberty Square, Suite 500

Boston, MA 02109

www.crestwoodadvisors.com

UNP 2Q19 earnings summary

Key Takeaways:

Current Price: $172 Price Target: $177

Position Size: 1.83% 1-year Performance: +16.5%

UNP reported a 2% revenue decline, but this negative was countered by an operating ratio improvement of 340bps, an all-time quarterly record despite weather related challenges (60bps drag). Total volumes were down 4% but pricing up 2.75%. UNP continues its focus on asset utilization, improving its locomotives productivity (+19% this quarter). UNP expects 2H volume to be down 2% (worse than previously thought) but continued pricing gains. Operating ratio guidance is positive reaching under 61% in 2019, and below 60% in 2020. The company now expects 2019 workforce reduction of 10%.

Adjusted net debt/EBITDA has increased in the past year, now reaching 2.5x, something to keep an eye on if volumes continue to decline. Continue reading “UNP 2Q19 earnings summary”

Pepsi 2Q19 earnings summary

Key takeaways:

Current price: $131 Price target: $139

Position size: 2.40% 1-year performance: +23%

Pepsi reported +4.5% of organic revenue growth (+2.2% revenue growth), thanks to strong performance from Frito-Lay. Contrary to last quarter, PEP had broad-based revenue growth in all geographies and divisions. Continued growth has been boosted by recent investments in the brands, which the CFO sees as sustainable in the long term. The management team did not increase its 2019 guidance as commodity inflation remains a risk and investments spending is being made in its manufacturing and supply-chain footprint. Its recent drink bubly (introduced last year) is doing well, reaching almost $300M in sales with 11% market share, that is projected by Pepsi to become a $1B in sales in the future. Pepsi and Mountain Dew are turning around after a tougher 2018.The stock has been strong year-to-date so we are not surprised to see it not move higher on solid, but expected results today. Continue reading “Pepsi 2Q19 earnings summary”

TJX 1Q20 Earnings Update

Current Price: $52 Price Target: $60

Position Size: 3.6% TTM Performance: 19%

TJX reported Q1 EPS and same store sales (SSS= sales at stores open >1yr.) that were better than expected. EPS was $0.57 vs consensus $0.55 and EPS guidance was raised. SSS were +5% vs consensus +3.6%. Full yr. SSS guidance of +2-3% was maintained. They plan to buyback 2.5-4% of their market cap this fiscal year. It has again been a very mixed quarter of results so far for retailers. KSS, JWN have stood out with weak results. TJX, along with other off-price retailers, continue to take market share.

Key takeaways:

· Traffic was again the biggest driver of SSS (SSS numbers do not include e-commerce).

· Core Marmaxx division (60% of revenue) delivered SSS growth of +6%. Remarkable performance given Marmaxx’s average age of their store base is 20 years old!

· International comp sales grew an impressive 8%. Despite the challenging retail landscape in Europe they continue to take share.

· Merchandise margin was down, but would have been positive ex-freight.

· Just launched e-commerce for Marshall’s.

· When asked on the call about the impact of tariffs they said they incorporated a minor impact in their guidance. “Historically, disruptions in the marketplace have created off price buying opportunities for us.”

· Chart below demonstrates TJX’s resistance to e-commerce and economic cycles. Despite the ramp in e-commerce share of retail over the last several years, of the companies listed below TJX is nearly half of aggregate incremental spend. The companies listed below represent ~$200B of the $275B in US apparel retail sales. Additionally, in the ’08 to ’09 period they were one of few retailers that continued to grow and post positive SSS.

Continue reading “TJX 1Q20 Earnings Update”

CSCO 3Q19 Update

Current Price: $56 Target Price: Raising to $63 from $54

Position size: 5% TTM Performance: 24%

CSCO reported very strong 3Q results. Sales and EPS were better than expected and guidance was ahead of consensus. Higher tariffs are included in this better than expected guidance. Adjusted revenue was up 6% and EPS was up 18% (aided by buybacks). They delivered growth across all geographies and businesses, improving margins, double-digit EPS growth, and continued solid cash generation. “We had another strong quarter of performance across the business, demonstrating our ability to execute despite the ongoing uncertainty in both the macro and geopolitical environments.”

Thesis intact, key takeaways:

· Cisco is helping their customers change their technology infrastructure to accommodate new technologies like cloud, AI, IoT, 5G and WiFi 6.

· Their evolving portfolio of products help customers navigate this complexity by helping them simplify, automate, and secure their infrastructure. They are in the early innings of evolving network architectures, so there is a lot of runway to the growth they are seeing.

· Cisco has the only integrated multi-domain intent-based architecture with security at the foundation. It is designed to allow customers to securely connect their users and devices over any network to any application, no matter where they are.

· Tariff increase to 25% is in guidance and offset with pricing and supply chain optimization. “We see very minimal impact at this point.”

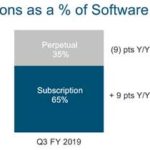
· Transition to recurring revenue model. The percentage of recurring revenue is now ~1/3 – they set a goal of 37% by 2020. They are on track to drive software revenue to 30% of total revenue by FY20. Subscription revenue was 65% of total software revenue, up 9 points YoY. This transition will drive an upward trend in CSCO’s margins over the next several years.

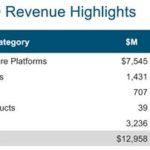
· Their largest segment, Infrastructure Platforms (58% of revenue), was up +5% YoY with solid growth across all businesses, switching had another good quarter with growth driven by the continued ramp of the Cat 9K. Routing grew driven by SD-WAN.

· Security was up 21% – pleased also with the integration of Duo into the security portfolio.

· Service revenue was up 3% driven by software and solutions support.

· By geography, Americas was flat, EMEA was up 9% and APJC was up 6%. Total emerging markets was up 5% with the BRICS plus Mexico down 2%.

· In terms of customer segments, enterprise was up 9%, commercial grew 5%, public sector was up 10%, and service provider continues to be weak, down 13%. This is similar to reports from competitors like Juniper which saw weakness in service provider. Service provider revenue is lumpy from quarter to quarter, it’s driven by only a few large customers whose capex is down YoY and will likely be weak until increased network build out of 5G.

Valuation:

· They have a 2.5% dividend yield which is easily covered by their FCF.

· Buyback authorization now at $18B, or over 7% of their current market cap.

· They have ~$17B in net cash. In the quarter they returned $7.5B to shareholders – $1.5B in dividends and $6B in buybacks.

· Forward FCF yield is 6.5%, well above sector average and is supported by an increasingly stable recurring revenue business model and rising FCF margins.

· The company trades on a hardware multiple, but the multiple should expand as they keep evolving to a software, recurring revenue model. Hardware trades on a lower multiple because it is lower margin, more cyclical and more capital intensive.

Thesis on Cisco:

· Industry leader in strong secular growth markets: video usage, virtualization and internet traffic.

· Cisco is the leader in enterprise switching and service provider routing and one of the few vendors that can offer end-to-end networking solutions.

· Significant net cash position and strong cash generation provide substantial resources for CSCO to develop and/or acquire new technology in high-growth markets and also return capital to shareholders.

· Cisco has taken significant steps to restructure the business which has helped reaccelerate growth and stabilize margins.

$CSCO.US

[tag CSCO]

Sarah Kanwal

Equity Analyst, Director

Direct: 617.226.0022

Fax: 617.523.8118

Crestwood Advisors

One Liberty Square, Suite 500

Boston, MA 02109
www.crestwoodadvisors.com

PLEASE NOTE!

We moved! Please note our new location above!

Disney gets full control of Hulu

Disney and Comcast came to an agreement giving Disney full operational control of Hulu effective immediately. Comcast continues to own its 33% stake until 2024, at which point Disney or Comcast can force a sale at a price not lower than $5.8B. The deal also ensures Hulu will continue to have access to NBCU content. This is a positive for Disney as joint operational control was the hurdle in determining an international rollout strategy for Hulu and a bundling strategy for Hulu, Disney+ and ESPN+.

$DIS.US
[TAG DIS]

Sarah Kanwal Equity Analyst, Director

Direct: 617.226.0022
Fax: 617.523.8118

Crestwood Advisors
One Liberty Square, Suite 500
Boston, MA 02109
www.crestwoodadvisors.com

Booking Holdings 1Q Results

Current Price: $1,736 Price Target: $2,400

Position Size: 2.5% TTM Performance: -20%

Key Takeaways:

· Beat on bookings, slight miss on EPS, 2Q guidance a little weak. Room nights also better than expected.

· Gross travel bookings were +2% (+8% constant currency). Guidance was for +5-7% constant currency. So better than the high end of guidance.

217 million room nights booked in the quarter, which is up 10% YoY, also ahead of the high-end of guidance (+6-8%). Average daily rates were down 2%.

· Outperformance w/ bookings is an important positive because over the last several quarters they have been trying to “optimize” ad spend which has been resulting in weaker bookings. Their goal is to spend less on performance advertising (e.g. Google AdWords) and more on brand advertising (e.g. TV commercials). The idea is that brand advertising drives direct traffic to their site, resulting in a higher ROI. This ad spend/rev growth algorithm will continue to be a focus going forward as clearly the trade-off between growth and spend persist.

· Weak guidance: slightly disappointing Q2 booking guidance but they have a track record of conservative guidance – they almost always come in ahead of the high end of their bookings guidance on a constant currency basis. EBITDA and EPS guidance also a little light.

· Europe softening – the slow start to the year in Europe that they mentioned last call continues. Europe is a key market for them, so this is clearly a drag on their growth right now.

· FX headwind is expected to be significant this year. Current rates assumed in guidance reduces gross booking growth, revenue growth and non-GAAP EPS growth by 300 bps for the full year.

· Investing for growth: this will reduce their full year EBITDA growth by a few percentage points. This reflects increased spend on brand advertising, customer acquisition and incentive programs and spending to support their new payment platform. They are investing in a payment platform that supports non-hotel properties, and will facilitate growth in transport and local attractions business.

· Alternative accommodations: this is their business that competes with Airbnb and HomeAway. This is growing faster than their overall business.

Continue reading “Booking Holdings 1Q Results”

Disney 2Q19 Results

Share price: $135 Target price: $165

Position size: 2% 1 yr. return: 35%

Disney reported a strong 2Q, beating on revenue and EPS. Revenue was $14.92B (+3% YoY) vs consensus $14.54B and EPS was $1.61 vs consensus $1.58. EPS down 13% YoY because of higher tax rate, tough studio compare, Hulu consolidation and DTC investments. Studio and DTC (direct-to-consumer) hindered 2Q growth, but Studio is already re-accelerating on its robust film slate and 3Q DTC losses guided lower than expected. The Parks segment shined in the quarter and strength here is set to continue as they open the biggest expansion in their history later this year w/ the openings of Star Wars lands at Disney World and Disneyland. Performance at Parks and Studio will help offset drag from DTC investments.

Key takeaways:

· Media networks revenue $5.53B, flat YoY. Cable Networks revenues for the quarter increased 2% to $3.7B and operating income increased 2% to $1.8B. Higher operating income was due to an increase at ESPN. Broadcasting revenues for the quarter decreased 2% to $1.8B and operating income decreased 29% to $247m. The decrease in operating income was due to higher programming costs, lower program sales and a decrease in advertising revenue, partially offset by higher affiliate revenue from contractual rate increases.

· Parks, experiences & consumer products revenue $6.2B (+5% YoY). Margin expansion in this segment continues as operating income increased 15% to $1.5B. Operating income growth for the quarter was due to growth at domestic theme parks and resorts. Domestic Parks continue to fire on all cylinders with revenue up 6% YoY. Star Wars: Galaxy’s Edge openings at Disneyland on May 31st and Disney World August 29th will help continue the successes in domestic attendance and spending gains.

· Studio entertainment revenue (-15% YoY). The decrease in theatrical distribution results was due to lapping Black Panther and Star Wars: The Last Jedi from 2Q last year with Captain Marvel and no comparable Star Wars title in the current quarter. Despite tough compares, studio should drive record summer performance w/ Avengers: Endgame, Aladdin, Toy Story 4, Lion King. This will also support growth in consumer products.

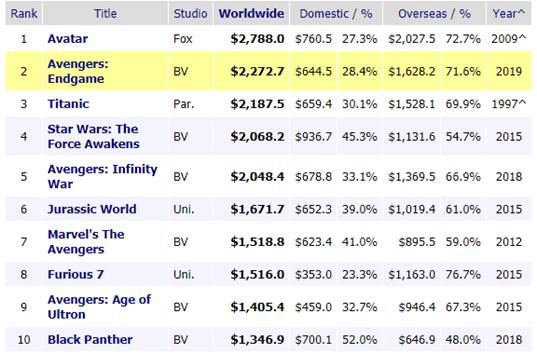
· Avengers: Endgame is now the second-highest grossing film of all time and will stream exclusively on Disney+ starting December 11th. It’s #2 only a couple weeks in, so clearly will take the #1 spot. Amazingly, movies from the Marvel Cinematic Universe (includes Black Panther) make up 5 of the top 10 grossing movies of all time.

· DTC & international revenue ~$1B, +15% YoY. Hulu now consolidated in this segment.

· $2B in merger cost synergies reiterated.

· Discussion on the call about the potential to acquire the 1/3 of Hulu that they don’t own from Comcast. Getting full ownership would help solidify int’l Hulu rollout strategy and Disney+, ESPN+, Hulu bundling strategy.

Global Box Office

Investment Thesis:

  1. Disney is a global media and entertainment company that owns a massive library of intellectual property.
  2. Their competitive advantage is their evergreen brands and synergistic business model. Disney can create content that builds off existing franchises and can be monetized across all their business, giving them the ability to create higher budget, quality content and an ever growing library of IP.
  3. New direct-to-consumer (DTC) initiativewill strengthen synergies between businesses and lead to structurally higher margins and higher multiple on recurring revenue business.
  4. Recent Fox acquisition improves their content positioning and global growth opportunities.
  5. High quality company with solid balance sheet, strong FCF generation and ROIC.

$DIS.US

[tag DIS]

Sarah Kanwal

Equity Analyst, Director

Direct: 617.226.0022

Fax: 617.523.8118

Crestwood Advisors

One Liberty Square, Suite 500

Boston, MA 02109
www.crestwoodadvisors.com

EOG 1Q19 earnings summary

Key Takeaways:

Current Price: $91 Price Target: $115 (NEW)

Position Size: 1.8% 1-year Performance: -23%

EOG released 1Q19 earnings with production levels ~1% above the top end of its forecast, giving some reassurance that they are well on track to deliver on current estimates for 2019. EOG mentioned on the call having 13 years of premium well inventory. Oil production was 20% higher than 1Q18. Increased efficiencies are driving better results at a lower cost, boosting earnings results. Adjusted EPS was 15% above guidance. Capex will be $6.3B for the year and will boost production by 12-16% in 2019 (as previously guided). EOG will use its FCF to strengthen its balance sheet, planning to repay $500m in debt, and $3B total between 2018 and 2021. The company is also boosting its dividend by 31%, a sign that the management team thinks cash flow will remain consistent going forward. Continue reading “EOG 1Q19 earnings summary”

Hilton 1Q19 Results

Share price: $92 Target price: Raising to $105 from $96

Position size: 2.9% 1 yr return: 17%

Hilton beat on revenue and EPS. Revenue rose 6% to $2.2B. EPS was $0.80, +16% vs consensus $0.75 (guidance was $0.73-$0.78). System wide RevPAR grew 1.8% on a currency neutral basis, in line w/ full year guidance of +1-3%. EBITDA was $499m, ahead of the high end of guidance and consensus. As a result, full year EPS and EBITDA guidance was raised. They still expect system-wide RevPAR growth to increase 1-3%. They reiterated their plan to return $1.3-$1.8B in capital to shareholders for the year, equating to 5-7% of current market cap.

Key takeaways:

· Both system-wide and US RevPAR grew 1.8%, outperforming the chain scale weighted industry data due to strong market share gains across all brands and major regions.

· Mgmt points to market share gains as a leading indicator of what should happen with their network effect because that attracts more capital. It’s why you see the pipeline growing and rooms under construction growing. Last year was the first time in history they grew market share everywhere in the world, including the US.

· Group business continues to be solid with RevPAR up 3.7%

· On 1.8% RevPAR growth in 1Q, they grew EBITDA 12%.

· Net unit growth of 7% is running ahead of targeted 6.5% for the year.

· Development pipeline grew to 371k rooms from 364k rooms last quarter – equates to 40% of room count. Over half of pipeline is under construction.

· >50% of pipeline is outside of the US.

· In a sensitivity analysis to a market downturn, mgmt. said they would expect flat to slightly positive growth in adjusted EBITDA and positive growth in free cash flow in an environment where RevPAR were to decline 5% to 6%. This is b/c Hilton is structurally different than it was last cycle – asset light means less operating leverage and less volatile earnings stream if RevPAR continues to weaken. Moreover, unit growth will aid EBITDA growth regardless of RevPAR trends.

· Loyalty members hit 89m from 85m last quarter and account for >60% of system-wide occupancy. Goal is to have 100m members by the end of the year.

· The stock is undervalued, trading at 7.5% FCF yield on 2019.

· ESG: ranked number one on Fortune’s Best Companies to Work For list in the US – the first hospitality company in history and the first non-tech company since 2004 to achieve this number one rating.

Investment Thesis:

∙ Hotel operator and franchiser with geographic and chain scale diversity of 14 brands, 5,400 hotels and 880k rooms across 106 countries (Hilton, Hampton Inn & Hilton Garden Inn ≈ 2/3 of portfolio).

∙ Network effect moat of leading hotel brand and global scale lead to room revenue premiums and lower distribution costs.

∙ Shift from hotel ownership to franchising results in resilient, asset-light, fee-based model.

∙ Record pipeline generating substantial returns on minimal capital will lead to increasing ROIC and a higher multiple.

∙ Unit growth and fee based model reduce cyclicality – Lower operating leverage vs ownership reduces earnings volatility and unit growth offsets potential room rate weakness.

∙ Generating significant cash which is returned to shareholders through dividends and buybacks.

$HLT.US

[tag HLT]

Sarah Kanwal

Equity Analyst, Director

Direct: 617.226.0022

Fax: 617.523.8118

Crestwood Advisors

One Liberty Square, Suite 500

Boston, MA 02109

www.crestwoodadvisors.com