Black Knight 4Q18 Earnings

Share price: $52 Target Price: $55

Position size: 2% TTM return: 9%

Key Takeaways:

· They beat revenue and EPS expectations. Adjusted revenue was up 6%, above the midpoint of their original guidance. Adjusted EPS was up 35%, above the high end of their guidance range, partly driven by a lower tax rate. Guidance issued for 2019 was a little below expectations.

· Data analytics segment (~15% of revenue) revenues were up 7% a big improvement from +2% last quarter. Growth was primarily driven by portfolio analytics and multiple listing service businesses. This segment is lower margin, but margins are improving – they were up 150bps for the quarter and 30bps for the year.

· Software Solutions segment (~85% of revenue) was up 6% driven primarily by strong loan growth on their core servicing software platform from new and existing clients, higher average revenue per loan and new client wins.

o Within this segment servicing (~75% of revenue) grew 7%. This is steadier than their originations revenue. They continue to dominate first lien loans with 62% share and are growing share in second lien loans. They have high-teens share of second lien and expect to reach 30% once current commitments are implemented.

o Originations (~10% of total revs), which is made up of new loans and refi’s, grew 4%. Driven by 35% growth in loan origination system solutions, partially offset by the effect of lower refinance origination volumes. Refinancing volumes, down 40%, continue to be negatively impacted by rising rates.

o Segment EBITDA margins expanded 60bps for the quarter and 190bps for the year.

o Trends in this segment highlight a dynamic weighing on US housing statistics. The issue is a lock-in effect from lower mortgage rates. Homeowners have mortgage rates lower than prevailing rates making them less likely to sell as it would mean taking out a new mortgage at a higher rate. This is decreasing housing inventory and existing home sales. The average length of homeownership tenure has been rising from around 4 years in 2000 to over 8 years now.

Continue reading “Black Knight 4Q18 Earnings”

Pepsi 4Q18 earnings call

Key takeaways:

Current price: $115 Price target: $123

Position size: 2.30% 1-year performance: +1.5%

Pepsi reported +4.6% of organic revenue growth, helped by pricing +4% (although FX was -4%). What mattered today was the company’s 2019 guidance announcement. The company plans to return $8B to shareholders in 2019 through share repurchases and dividends. PEP expects organic top line to grow 4% (above consensus of +3.4%), and EPS of $5.50, which would be a 3% decline y/y as the company expects to reinvest for growth (more marketing spending) and incur some restructuring costs. It is pretty common to see an EPS “reset” lower as a new CEO takes the helm of a company. Thus there is no surprise there with a 3% decline in EPS this year. There is nothing completely different with newly appointed CEO Ramon Laguarta strategic vision. He has a desire to streamline Pepsi’s manufacturing and supply-chain footprint for better performance, becoming “leaner, more agile and less bureaucratic”. As costs rise, Pepsi is renewing its efforts to drive productivity gains and is targeting $1B in savings/year until 2023. Long term, Pepsi is hopeful to return to an algorithm of +4-6% organic growth, core operating margin expansion of 20-30bps and a high-single-digit core EPS growth starting in 2020. Continue reading “Pepsi 4Q18 earnings call”

CSCO 2Q19 Update

Current Price: $48 Target Price: $54

Position size: 4.4% TTM Performance: 16%

CSCO reported very strong 2Q results. Sales and EPS were better than expected and guidance was ahead of consensus. They delivered revenue growth across all geographies and businesses, strong margins, double-digit EPS growth, and continued solid cash generation. Cisco is benefiting as their customers face an increasingly complex IT environment as they move to the cloud, deal with growing connectivity of users and devices, and changing security needs. Cisco’s evolving portfolio of products helps customers navigate this complexity by helping them simplify, automate, and secure their infrastructure. As a result, despite concerns of weakening IT spending, CSCO is seeing robust demand. Demand is solid enough that they haven’t seen any impact to their business from changes in the global macro-economic environment. The CEO said, “I would tell you that it certainly is one of the more complex macro geopolitical environments that I think we’ve seen in quite a while with all the different moving parts. But to be honest, from the first day of the quarter to the last day of the quarter, we saw zero difference. We saw very steady demand throughout the quarter.” They are in the early innings of evolving network architectures, so there is a lot of runway to the growth they are seeing.

Thesis intact, key takeaways:

· Top line growth was ~7%. Q3 sales expected to be up 4-6%, street was expecting +3%.

· Impact of the 10% tariff was immaterial in the quarter. They were able to offset with pricing.

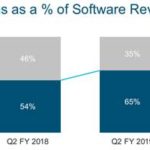
· Transition to recurring revenue model. The percentage of recurring revenue is now ~1/3 – they set a goal of 37% by 2020. They are on track to drive software revenue to 30% of total revenue by FY20. Subscription revenue was 65% of total software revenue, up from 57% last quarter. This transition will drive an upward trend in CSCO’s margins over the next several years.

· Their largest segment, Infrastructure Platforms (58% of revenue), was up +6% YoY on another quarter of campus switching strength, driven by solid demand for their Catalyst 9k products. Routing declined due to weakness in service provider end markets. They also saw a decline in data center servers.

· In terms of customer segments, enterprise was up 11%, commercial grew 7%, public sector was up 18%, and service provider was down 1%.

Valuation:

· They have close to 3% dividend yield which is easily covered by their FCF. Dividend increased 6% and added $15B to buyback authorization, bringing the total to $24B, or over 10% of their current market cap.

· They have $15B in net cash. In the quarter they returned $6.5B to shareholders – $1.5B in dividends and $5B in buybacks.

· Forward FCF yield is almost 7%, well above sector average and is supported by an increasingly stable recurring revenue business model and rising FCF margins.

· The company trades on a hardware multiple, but the multiple should expand as they keep evolving to a software, recurring revenue model. Hardware trades on a lower multiple because it is lower margin, more cyclical and more capital intensive.

Thesis on Cisco:

· Industry leader in strong secular growth markets: video usage, virtualization and internet traffic.

· Cisco is the leader in enterprise switching and service provider routing and one of the few vendors that can offer end-to-end networking solutions.

· Significant net cash position and strong cash generation provide substantial resources for CSCO to develop and/or acquire new technology in high-growth markets and also return capital to shareholders.

· Cisco has taken significant steps to restructure the business which has helped reaccelerate growth and stabilize margins.

$CSCO.US

[tag CSCO]

Sarah Kanwal

Equity Analyst, Director

Direct: 617.226.0022

Fax: 617.523.8118

Crestwood Advisors

One Liberty Square, Suite 500

Boston, MA 02109

www.crestwoodadvisors.com

PLEASE NOTE!

We moved! Please note our new location above!

Hilton 4Q18 Results

Share price: $78 Target price: $96

Position size: 2.5% 1 yr return: -11%

Hilton beat on revenue and EPS. 2019 EPS and EBITDA guidance better than expected despite lowered RevPAR guidance range from 2-4% to 1-3%. This new lowered RevPAR guidance was largely expected and is in line with other hotel operators. EBITDA was $544m, ahead of guidance and consensus. RevPAR for 4Q was +2% driven entirely by higher rates. Q1 guidance also ahead of expectations. While RevPAR guidance is weakening, Hilton is structurally different than it was last cycle – asset light means less operating leverage and less volatile earnings stream if RevPAR continues to weaken. Moreover, unit growth will aid EBITDA growth regardless of RevPAR trends. (RevPAR = revenue per available room. It’s their total room revenue divided by their total number of rooms).

[MORE]

Key takeaways:

· Their weakest areas of demand were leisure travelers in the US and Asia Pacific.

· Group business is solid – 2019 group bookings up in the mid-single-digits and corporate negotiated rates up just over 2%; slightly ahead of last year’s growth. More than 70% is already on the books.

· On 2% RevPAR growth in 4Q, they grew EBITDA 12%.

· Net unit growth – In 2018 they opened more than one hotel per day – the best year of openings in their history. They added over 450 hotels (+57K rooms) or approximately 7% growth YoY. They ended 2018 with 5,700 properties and 913K rooms (~5% global room share) across 113 countries.

· Strong pipeline for 2019 – record year for construction starts and signings. They are expecting to grow rooms 6-7% in 2019. 80% of that is under construction. >50% of pipeline is outside of the US.

· Launched new luxury brand, LX. The first hotel opening under this banner is in Dubai and is a conversion from a contract Marriott lost last year.

· Loyalty members hit 85m and account for 60% of system-wide occupancy. Goal is to have 100m members by the end of the year.

· China RevPAR was weaker than expected at +5% – it had been trending up double digits. They echoed other companies in saying that the macro environment in China is weakening. Despite that, management had a very positive tone about the future of their operations in China.

· Conversions (an existing hotel changes their banner to Hilton) increased from 20% of pipeline to 25%. This can be a little counter-cyclical. It peaked as a % of their pipeline in the recession in low 40% range. They are starting to see a ramp in conversions in China.

· Returned $1.9B to shareholders in 2018.

· The stock is undervalued, trading at over an 8% FCF yield on 2019.

Investment Thesis:

∙ Hotel operator and franchiser with geographic and chain scale diversity of 14 brands, 5,400 hotels and 880k rooms across 106 countries (Hilton, Hampton Inn & Hilton Garden Inn ≈ 2/3 of portfolio).

∙ Network effect moat of leading hotel brand and global scale lead to room revenue premiums and lower distribution costs.

∙ Shift from hotel ownership to franchising results in resilient, asset-light, fee-based model.

∙ Record pipeline generating substantial returns on minimal capital will lead to increasing ROIC and a higher multiple.

∙ Unit growth and fee based model reduce cyclicality – Lower operating leverage vs ownership reduces earnings volatility and unit growth offsets potential room rate weakness.

∙ Generating significant cash which is returned to shareholders through dividends and buybacks.

$HLT.US

[tag HLT]

Sarah Kanwal

Equity Analyst, Director

Direct: 617.226.0022

Fax: 617.523.8118

Crestwood Advisors

One Liberty Square, Suite 500

Boston, MA 02109

www.crestwoodadvisors.com
Fortive 4Q18 earnings summary

Key Takeaways:

Current Price: $76 Price Target: $87 (under review)

Position Size: 2.19% 1-year performance: +7%

Fortive released 4Q18 results with sales up 7.4% organically (+11.4% reported), and adjusted EPS up 30% from last year (helped by lower interest expenses and lower tax rate). While China was highlighted as strong in 4Q18, the company did warn that there was some early buying that pulled forward some sales (70-100bps of growth) as companies were buying ahead of possible tariffs. Management thinks North America will remain solid in 2019, while Western Europe and China could experience some slowing down. Those assumptions are driving the 3% core top line growth guidance for 2019, and the high end of 5% assumes there is no slow down. Operating margins increased 40bps (excluding the recent acquisitions dilutive effect), helped by 80bps price increases. During the call, the company highlighted accelerating their portfolio transformation towards less cyclical markets and more secular growth drivers, also increasing in the recurring revenue base. This is part of our buy thesis on the name and reassuring to hear the transformation is going in the right direction. Continue reading “Fortive 4Q18 earnings summary”

Sanofi 4Q18 earnings summary

Key Takeaways:

Current Price: $42.5 Price Target: $51

Position Size: 1.65% 1-year Performance: +7%

Sanofi reported 4Q18 sales results containing no surprises, with sales up 3.9% and EPS +4.7%. Flu vaccines was a growth driver this past quarter, while the diabetes franchise remained weak. The divestiture of Zentiva, its European generic business as well as growth of Dupixent will boost margins going forward. The Dupixent sales increased thanks to advertising and the recent US launch in asthma (the drug is approved for severe form of eczema and asthma). Sanofi new R&D chief is pruning the portfolio to focus on better prospects, accelerating research on 17 programs while discontinuing 25 others. The firm is putting cancer treatment on its priority list, and removing diabetes from it, which had been a major growth driver for the company in the past (with drug Lantus). In addition, the company is refocusing its segments in order to “unlock organizational efficiencies”… we have heard that from other companies in the past, and we remain unconvinced about the value of such reorganizational efforts. But on the positive side, Sanofi’s dividend yield is now an attractive 4.2%, which offers good support to the stock. Continue reading “Sanofi 4Q18 earnings summary”

Sensata (ST) 4Q18 earnings summary

Key Takeaways:

Current Price: $49 Price Target: $61

Position Size: 2.13% 1-year Performance: -10%

Sensata reported slower revenue growth sequentially, a miss vs. consensus as well. Organic sales growth was +3.5%, with an overall Chinese business organic growth rate of 4.3%, which we think is respectable given the recent business volatility cited by the company and peers. Although the Chinese auto production end market declined 15% in 4Q (way beyond their expectations) and drove most of the slowdown in their overall results in 4Q18, Sensata had an impressive +1560bps sales above the auto end market production. The company noticed a small slowdown in Europe as well, but a strong North America growth. For 2019, management expects +400-500bps relative outperformance over the global auto production. While China’s economy is still growing, volatility is expected to continue in 1Q19. Regarding its other end markets, aerospace was strong but industrial weak driven by the Chinese slowdown. Margins expanded 80 bps in the quarter despite lower volume and unfavorable impacts from tariffs. Their business model enables continued profitability, even in down cycles, as they have a highly variable cost structure. While today’s results were below expectations, investors were expecting much worse. It is reassuring to see the company able to protect its operating margins in a volatile environment, a proof of the company’s strong business model. Continue reading “Sensata (ST) 4Q18 earnings summary”

Alphabet 4Q18 Earnings

Alphabet reported mixed Q4 results, beating on top line (+22%) but spending on cloud and YouTube resulted in lower than expected profit margins (21% vs 22% expected). Two key positives were better than expected: ad revenue and lower TAC. Ad revenue disappointed last quarter, so this was an important reversal. TAC is the largest cost of revenues and, after climbing for a while, continues to trend down. Weaker operating margins were from higher R&D, headcount and marketing. Headcount increased to 99K people from 80k a year ago. The most sizable head count increases were in cloud for both technical and sales roles. The higher spending is not totally unexpected. This quarter follows a similar trend of rising expenses and higher capex impacting profitability as they “invest ahead of growth,” particularly, cloud, YouTube and hardware. “With great opportunities ahead, we continue to make focused investments in the talent and infrastructure needed to bring exceptional products and experiences to our users, advertisers and partners around the globe."

Key Takeaways:

· They are seeing broad based strength globally with the US growing 21%, EMEA up 20% and APAC up 32%.

· Net advertising revenues were up 21% to $25.2B vs consensus of $24.7B. Mobile search and YouTube continue to drive ad revenue.

· Revenue from Google sites was up 22%. Network sites revenues were up 12%. Other revenues (includes Google Play, Google Cloud, and Hardware) were up 31%.

· TAC was slightly better YoY at 23% percent of revenue. High TAC levels have been driven by the mix shift to mobile and to programmatic.

· Margins were negatively impacted by higher “other cost of revenues.” This is everything other than TAC. Key drivers were content acquisition costs (CAC) for YouTube, costs associated with data centers, and hardware-related costs for Made by Google and the Nest family of products.

· OpEx of $13.2B was up 27% YoY (vs. consensus of +23% YoY) driven by increases in R&D, headcount and marketing.

· “Other Bets” also contributed to the operating profit miss. Operating loss for the segment was $3.4B for the FY18, vs a loss of $2.7B in 2017. Accrual of compensation expenses to reflect increases in the valuation of equity in certain Other Bets hurt margins.

· Capex continues to increase. They spent nearly $7 billion in capex in 2018.

· Google Cloud: New head of cloud announced, Thomas Kurian. Management is not giving any specific cloud metrics, though they did say they more than doubled both the number of Google Cloud Platform deals >$1M as well as the number of multi-year contracts signed.

Valuation:

· FCF for 2019 is expected to be ~$31B or about a 4% FCF yield.

· $105B in net cash, 13% of their market cap.

Thesis on Alphabet:

· Online advertising as a share of overall Ad budgets will continue to grow as:

o People spend more time on the internet/mobile internet vs tv, radio, newspapers etc

o Higher ROI (+ easier to measure) per marketing dollar spent online vs other ad mediums

· They are the global leader in search.

· Well positioned to benefit from increased smartphone penetration.

· Flexible business model provides operating leverage with high returns ROIC and huge free cash flow generation.

$GOOGL.US

[tag GOOGL]

Sarah Kanwal

Equity Analyst, Director

Direct: 617.226.0022

Fax: 617.523.8118

Crestwood Advisors

One Liberty Square, Suite 500

Boston, MA 02109

www.crestwoodadvisors.com
PLEASE NOTE!

We moved! Please note our new location above!

SHW Q4 Results

Current Price: $418 Price Target: $480

Position Size: 2% TTM Performance: 2%

SHW reported Q4 results, they already released sales and earnings numbers a couple weeks ago that were below expectations. The stock rallied after the report yesterday on guidance which reflected rebounding demand trends. Revenue guidance was better than the street and EPS guidance was weaker. They will see less benefit from lower raw material costs this year than the street was expecting. Guidance implies low-single-digit raw material inflation for 2019 (though raw material prices are trending lower, they see the benefit on a 6-9 month lag). Q1 Revenues guided to +2-6% and full year revenues guided to +4-7%, led by strength in the N. America paint stores business. Price increases should add about 2-3% to top line in 2019, which implies volumes +2-4%. That’s a nice rebound from flat last quarter. Mgmt said they’re “off to a very good start. January sales will come in high above our first quarter guidance.” The improvement was a big relief given the negative pre-announcement a couple weeks ago. The weakness in October and November that hurt Q4 results has been largely attributed to weather.

Key Takeaways:

· SHW set to benefit from higher product prices, good volume growth, and falling raw material costs.

· They are taking share with strong volumes despite weak housing numbers.

o Turnover is down, both new and existing home sales are weak. But SHW says they are seeing a decoupling from housing turnover and residential repaint. More homeowners are staying in place and remodeling. Higher home values and mortgage rate lock-in are contributing to that. Current rates are above a vast amount of mortgages which discourages selling.

o They’ve been growing residential repaint double digits for five consecutive years while the industry is growing more like high single-digits.

· Raw materials, delayed benefit – As has been the case for a few quarters, pricing continues to lag raw material inflation. The good news is raw material costs have started to go in the other direction, but that will take several months to show up in COGS. When it does, SHW should see a gross margin benefit because of all the pricing they’ve taken. Raw materials represent ~80% of the cost of a coatings product on average.

· They saw generally weak trends across products in Europe.

· The Americas Group (55% of sales) – this is their network of 4,270 paint stores.

o SSS were +3% for Q4 and +5% for FY18.

o Domestic new residential construction & repaint end-markets are ~50% of store sales. The domestic commercial building paint end-markets are 20-25% and domestic industrial end-markets including protective coatings for structural steel and U.S. marine coatings are 15-20%.

o Residential repaint remained their strongest customer segment in the year, up by double-digit percentage.

· Performance Coatings Group (29% of sales) – up 4.6% in Q4 driven mostly by price increases. Sales across all product categories were positive, led by general industrial and packaging, which were both up by double-digit percentages.

· Consumer Brands Group (16% of sales)– Down 6.5% in Q4 due primarily to lower volume sales to some of the Group’s retail customers and the new revenue standard, partially offset by a new customer program and selling price increases.

  • They retired $1 billion in debt in 2018 and repurchased $613 million in shares. They aim to reduce their leverage ratio from 3.3x to below 3x by year end. LT target is 2-2.5x.

Valuation:

· Expected free cash flow of $2B in 2018, trading at over a 5% FCF yield. Dividend yield <1%.

· Given growth prospects, steady FCF margins and high ROIC the valuation is still reasonable. They deserve a premium multiple based on large exposure to the N. American paint contractor market and no exposure to the cyclical sensitive auto OEM end market.

· Balance sheet is fairly levered from the Valspar acquisition, but they expect to get to under 3x by the end of the year.

Thesis:

· SHW is the largest supplier of architectural coatings in the US. Sherwin-Williams has the leading market share among professional painters, who value brand, quality, and store proximity far more than their consumer (do-it-yourself) counterparts.

· Their acquisition of Valspar creates a more diversified product portfolio, greater geographic reach, and is expected to be accretive to margins and EPS. The combined company is a premier global paint and coatings provider.

· SHW is a high-quality materials company leveraged to the U.S. housing market. Current macro and business factors are supportive of demand:

o High/growing U.S. home equity values. Home equity supportive of renovations.

o Improving household formation rates off trough levels (aging millennials).

o Baby boomers increasingly preferring to hire professionals vs. DIY.

o Solid job gains and low mortgage rates support homeownership.

o Residential repainting makes up two thirds of paint volume. Homeowners view repainting as a low-cost, high-return way of increasing the value of their home, especially before putting it on the market.

$SHW.US

[tag SHW]

Sarah Kanwal

Equity Analyst, Director

Direct: 617.226.0022

Fax: 617.523.8118

Crestwood Advisors

One Liberty Square, Suite 500

Boston, MA 02109

www.crestwoodadvisors.com

Exxon (XOM) 4Q18 earnings summary

Key Takeaways:

Current Price: $76 Price Target: $86

Position Size: 1.74% 1-year Performance: +11.8%

Exxon reported 4Q18 results, with continued production improvements and earnings ahead of consensus ($1.20 vs. 1.07). Permian production came ahead of expectations, with close to a 90% increase y/y, thanks to an increase in rigs. XOM’s CEO sees very good returns in the Permian even if the price of oil comes down to $35/barrel. On the other hand, growth in its other 4 pillars won’t be seen until 2020. Refining profits more than doubled as margins increased. Free cash flow covered their dividends. Capex spending slowed in 4Q as oil prices declined but Capex for 2019 is now guided up +16% y/y vs. management’s previous guidance numbers ($30B vs $28B previously). Overall we see Exxon moving in the right direction, and importantly staying the course on its strategic investments. Continue reading “Exxon (XOM) 4Q18 earnings summary”