Crestwood ESG Model Presentation

Good Morning,

I have attached the approved vehicle slides for our ESG Model.

Slides 3-4 show example holdings from specified funds with a rationale for their selection. Slide 5 provides an overview of Calvert’s dedication to ESG/Impact investing and gives an understanding of what it means to invest in “green bonds”.

If anybody has specific questions please let me know.

Thank You,

Pete

ESG Slides_RDT

Peter Malone, CFA

Research Analyst

Direct: 617.226.0030

Fax: 617.523.8118

Crestwood Advisors

One Liberty Square

Suite 500

Boston, MA 02109

www.crestwoodadvisors.com

Apple Investor Event

Apple held an investor event today where they unveiled details about their new Service offerings:

· Apple News+ – $9.99/month news app w/ family sharing that includes WSJ, LA Times, 300+ magazines. Available today in US and Canada. Launching in Australia and UK later this year.

· Apple Card – new credit card in partnership with Goldman Sachs. No annual fees, no late fees and they said it would be a low interest rate. Also will include app that helps track purchases, pay balances and gives daily cash back ranging from 1% with physical card to 2% with Apple Pay and 3% on Apple purchases.

· Apple Arcade – subscription gaming service with exclusive content. Launches in over 100 countries in Fall 2019. Pricing not announced, but no ads and no in game purchases.

· Apple TV App – newly designed app for mobile and smart TVs that aggregates TV subscriptions from DirectTV, Amazon, Hulu, Showtime, HBO and more (Netflix did not sign on).

· Apple TV+ – New TV subscription offering with exclusive content. Launches in the Fall, pricing not announced yet. They had a long list of collaborators including Oprah, Steven Spielberg, Ron Howard, JJ Abrams, Steve Carell, Jennifer Aniston and lots more. Focused more on quality than on quantity. Spending a lot less on content than Netflix. Netflix spent about $12B last year. Amazon spent ~$4.5B and Apple is expected to spend closer to $2B… though that may go up.

Interestingly there was a lot of emphasis throughout the event that was clearly aimed at separating how Apple operates from how Facebook operates. The presentation on the news app was very focused on how the news would be high quality, curated content from reliable sources. And with each of the new products they emphasized privacy. They talked about how Apple would not collect data and often would not even have access to it. For instance with the TV app, the technology suggesting new TV shows based on viewing habits would sit on phones and not on Apple’s servers. With Apples News they won’t track what you read and they won’t allow advertisers to track you. They won’t track purchases with the Apple Card.

Sarah Kanwal

Equity Analyst, Director

Direct: 617.226.0022

Fax: 617.523.8118

Crestwood Advisors

One Liberty Square, Suite 500

Boston, MA 02109

www.crestwoodadvisors.com

JP Morgan Guide to Retirement

This actually looks great. I am looking forward to sifting through it.

Thanks for forwarding.

Aaron

Aaron M. Beltrami, CFP®

Partner

Wealth Manager

Direct: 617.226.0035

Fax: 617.523.8118

Crestwood Advisors

One Liberty Square

Suite 500

Boston, MA 02109

www.crestwoodadvisors.com

From: Peter Malone
Sent: Wednesday, March 13, 2019 8:27 AM
To: Relationship_Managers <rm@crestwoodadvisors.com>; Portfolio_Managers <pm@crestwoodadvisors.com>
Cc: ” <>
Subject: JP Morgan Guide to Retirement

Good Morning,

Attached is the updated JP Morgan Guide to Retirements piece. There is a lot of good information in here so worth a look.

Thank You,

Pete

Peter Malone, CFA

Research Analyst

Direct: 617.226.0030

Fax: 617.523.8118

Crestwood Advisors

One Liberty Square

Suite 500

Boston, MA 02109

www.crestwoodadvisors.com

Update on Q4 Earnings Results

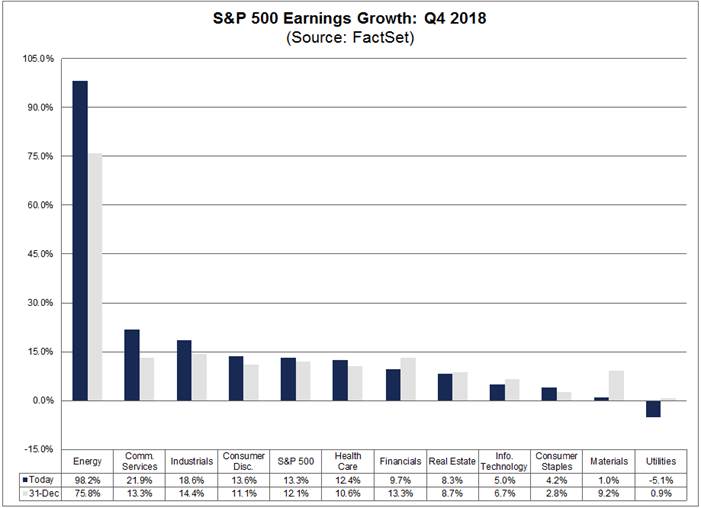
So far, 89% of the companies in the S&P 500 have reported results for Q4.

· Companies are reporting fewer than average beats (69%) and 2019 revenue and EPS growth estimates are coming down. The biggest beats are in the energy sector.

· Q4 revenue growth is 6.6% and EPS growth is 13%. That puts FY18 revenue growth at 8.8% and EPS growth at 20%.

· More companies are issuing negative EPS guidance for Q1 than average. Not all companies issue guidance, but of the 93 in the S&P that have so far, 73% issued negative guidance.

· For Q1, EPS growth is expected to be negative due to margin contraction. Revenue growth is expected to be up 5.2% and EPS growth down -2.7%.

· Growth is expected to decelerate for FY2019 to 4.9% revenue growth and 4.5% earnings growth. So margin contraction for the full year as well, but to lesser degree than Q1.

· Currency headwinds are a factor in the eroding growth that we’re seeing. Companies with higher global revenue exposure are reporting lower growth. The aggregate S&P geographic revenue exposure is 62% US and 38% international.

· The forward 12-month P/E ratio is 16.2.

· The Consumer Discretionary sector has the highest forward P/E ratio at 20.1x, while Financials has the lowest at 11.6x.

Sarah Kanwal

Equity Analyst, Director

Direct: 617.226.0022

Fax: 617.523.8118

Crestwood Advisors

One Liberty Square, Suite 500

Boston, MA 02109

www.crestwoodadvisors.com
Medtronic 3Q FY19 results summary

Key Takeaways:

Current Price: $93 Price Target: $100

Position Size: 3.14% TTM Performance: +10.8%

Medtronic released their 3Q FY19 results this morning, with organic revenue growth of 4.4%, a 50bps adjusted operating margin expansion and +9% EPS growth. Recent product launches and strength in emerging markets (+14%) helped revenue growth and was well diversified: 13% growth in China, 23% growth in South Asia, and 20% growth in the Middle East & Africa. Emerging markets now represent 16% of MDT’s sales base. MDT highlighted its differentiated strategy of using private and public partnerships and optimizing its distribution channel as making a real difference in terms of growth and increased penetration of existing products. And of course, rising demand is also a driver to EM growth.

The company raised its FY19 guidance numbers, although not to the extent that it would get anyone excited, mostly raising the lower end of its revenue from 5.0% to 5.25%. The free cash flow increase is more positive, seeing a 6% increase of its lower end, going from $4.7B-5.1B to $5.0-5.2B. Medtronic has entered a multi-year plan to expand its operating margin (less manufacturing footprint, centralization of back office functions for example), and convert a greater percentage of its net income to free cash flow. At this point, it seems that Medtronic can achieve its long-term target of top line growth (4%) and margin expansion (40-50bps). We are maintaining our price target at this point.

Continue reading “Medtronic 3Q FY19 results summary”

Stryker trim 70bps #researchtrades

After review, we decided to trim Stryker by 70bps, and put the proceeds in cash (IVV) until our next idea makes it into the portfolio. Stryker is currently our biggest relative weight, yet at today’s valuation (+8% upside on our new $198 price target) we think this carries too much risk. The Medtech sector has seen its multiple expand in the past decade, helped by healthy fundamental drivers. While we think Stryker still has room to grow, the Medtech sector now trades at a 40% premium vs. the market.

Julie S. Praline

Director, Equity Analyst

Direct: 617.226.0025

Fax: 617.523.8118

Crestwood Advisors

One Liberty Square

Suite 500

Boston, MA 02109

www.crestwoodadvisors.com

Update on Q4 Earnings Results

So far, 66% of the companies in the S&P 500 have reported results for Q4.

· Overall, companies are beating estimates, but the magnitude of beats is lower than what’s typical. Also, revenue and EPS growth estimates are coming down. EPS growth for Q1 is expected to be slightly negative.

· 71% have beat on EPS (= to 5 yr. average) and 62% have beat on revenue (above 5 yr. average).

· The blended sales and blended earnings growth rates for Q4 is 7% and 13% respectively. 10 of the 11 sectors are reporting YoY earnings growth.

· More companies are issuing negative EPS guidance for Q1 than average. Not all companies issue guidance, but of the 65 in the S&P that have so far, 82% issued negative guidance.

· Growth is expected to decelerate next year to 5.1% revenue growth and 5% earnings growth. Currency headwinds are a factor in this.

· The forward 12-month P/E ratio is 15.8.

· The Consumer Discretionary sector has the highest forward P/E ratio at 19.6x, while Financials has the lowest at 11.3x.

Sarah Kanwal

Equity Analyst, Director

Direct: 617.226.0022

Fax: 617.523.8118

Crestwood Advisors

One Liberty Square, Suite 500

Boston, MA 02109

www.crestwoodadvisors.com
Investor Movement Index

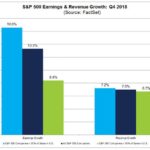
Below is a graphic from TD Ameritrade that looks at retail client allocation changes within the S&P 500. What the green line shows is that individual investors sold out of the S&P 500, choosing to buy on less risky asset classes like core bonds.

This is just another reminder that attempting to time the market is very difficult. As we discussed this morning, tempering client fears makes it easier to keep individuals invested in the market. The turnaround between December and January is an example where one could have recouped much of their loss in a relatively short timeframe.

Peter Malone, CFA

Research Analyst

Direct: 617.226.0030

Fax: 617.523.8118

Crestwood Advisors

One Liberty Square

Suite 500

Boston, MA 02109

www.crestwoodadvisors.com