McCormick 3Q18 earnings results: long term story intact

MKC reported an EPS results a penny above consensus, despite a boost from lower taxes of $0.08, which explains the stock’s negative reaction to results this morning. The long term story is intact, highlighted by its overall organic growth rate this quarter of 4%, thanks to +3.5% from volume/mix and +0.5% from price (reported revenue up +13.5% the recent RB Foods brands acquisition that added 9.6%) and healthy gross margins (+280bps). EBIT margins declined 200bps y/y and missed expectations by 80bps due to additional marketing/promotional spending. Overall adjusted operating margin increased 80bps y/y thanks to RB Foods brands accretive addition and core business shift to more value-added products. The Consumer segment showed results below expectations, while its Flavors segment was strong.

Overall McCormick has been a strong contributor, outperforming the consumer staples index by 33% in the last year. We are raising price target to $131 from $117.

Continue reading “McCormick 3Q18 earnings results: long term story intact”

Test posting please ignore!

As a reminder, a key function of the PBM is to leverage scale and competition to reduce drug costs for clients. PBM keep up to 10% of the “saving”, although CVS mentioned being closer to 5%. Per Goldman Sachs, the rebates business represents a mid-single digit % of its EBITDA. Below is Goldman’s calculation:


cid:<a href=image001.png@01D41F46.8B1A85D0“>

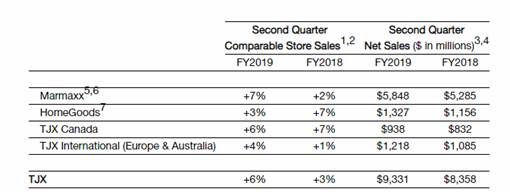
·         Full year EPS and SSS guidance raised. Full year EPS guidance is $4.12 at the midpoint vs $4.07 previously (excluding benefit from a lower tax rate).

·         SSS now expected to be +3-4% vs +1-2% previously (in their 40+ yr. history they’ve had only 1 year of negative SSS).

·         They again made a point about their ability to attract a younger customer to validate the sustainability of their business model. “We are particularly pleased that we have been attracting a significant share of millennial and Gen Z shoppers among our new customers”…”the majority of new customers at Marmaxx, are these younger customers which indeed bodes very well for our future.” There were several minutes of discussion around this, so they must be getting a lot of questions from investors.

·         Merchandise margin was down, but would have been up significantly excluding freight costs – i.e. they are not “buying” this better growth with deeper discounts. Inventory grew in line with sales, a positive indicator for future merchandise margins.


[more]


QUARTER ENDED PAYMENT VOLUME (billions)


QUARTER ENDED TRANSACTIONS (millions)

Valuation:

·         FCF for the quarter was $3.5B and YTD is $8.7B. Trading at a 4% FCF yield.

·         They’ve returned most of their YTD FCF to shareholders through dividends ($1.5B) and buybacks ($5.55B). They have $5.8 billion remaining for share repurchase.

·         For revenue beats: REITs, Industrials and utilities have had the highest % surprise.

·         According to FactSet, the market is rewarding upside earnings surprises less than average and punishing downside earnings surprises more than average.

·         For all of 2018, analysts are projecting earnings growth of 19.5% and revenue growth of 7.2%.

·         Forward P/E Ratio is 16x – it was 16.4x at the beginning of the year. The 5-year average is 16.1x and the 10-Year average is 14.3x.

·          

·         [more]

·        

·          

·         increased household formation. Rising prices tend to increase remodeling activity and spur new housing starts both of which benefit SHW.  Historically, architectural paints is a good leading indicator of industrial paint demand, which means the overall LT demand picture for SHW looks robust. In addition to this, their margins will improve as they increasingly pass on rising input costs and they realize synergies from the Valspar acquisition.

·          

·        


John R. Ingram CFA

Managing Director

Asset Allocation and Research


Direct: 617.226.0021

Fax: 617.523.8118


Crestwood Advisors

One Liberty Square

Suite 500

Boston, MA 02109

www.crestwoodadvisors.com


By the Numbers – Client Education & Wage Increases

Attached is this week’s version of “By the Numbers” from MFS. The two facts below touch upon the average investor’s understanding of equity markets and a clarification of total employee compensation.

“48% of 2,000 American adults surveyed in August 2018 thought the US stock market had been flat over the last 10 years. Another 18% of the 2,000 folks surveyed thought the US stock market had declined over the last 10 years” (source: Betterment).

“For every $1 spent for wages and salaries in the private sector, employers spend an additional 44 cents on benefits. Average compensation is $23.78 per hour while the cost of benefits averages an additional $10.41 per hour” (source: Bureau of Labor Statistics).

What I find most interesting about the 48% stat is the source, Betterment. This is one of the larger unaffiliated Robo-Advisors showing that investors are often unaware of what is taking place in the market. This simple client education is something that can be provided by a full service Investment Advisor much more effectively than a web-based robo platform.

Peter Malone, CFA

Research Analyst

Direct: 617.226.0030

Fax: 617.523.8118

Crestwood Advisors

One Liberty Square

Suite 500

Boston, MA 02109

www.crestwoodadvisors.com

BTN 9-24-18.pdf

Union Pacific (UNP) efficiency plans announcement

This week, UNP announced their intention to implement the Precision Scheduled Railroading (PSR) strategy, starting October 1st. The stock reacted positively on the news, however we have some reservations that this strategy will drastically change UNP like it did for other rail companies in the past (CSX being the latest example).

Continue reading “Union Pacific (UNP) efficiency plans announcement”

By the Numbers

Attached is the weekly “By the Numbers” piece put out by MFS. Below are two facts that stress the need for prospect/client engagement and understanding about the historical volatility of equity markets.

As of the end of 2017, 19% of Millennials and 12% of Baby Boomers had no money (either pre-tax or post-tax) invested in the stock market. Millennials were born between 1981-97 and were ages 20-36 in 2017, while the Baby Boomers were born between 1946-64 and were ages 53-71 in 2017 (source: Vanguard).

Over a painful 6-months from September 2008 through February 2009 (i.e., 9/01/08 to 2/28/09), the S&P 500 lost 41.8% (total return), including a drop of 16.8% in just the month of October 2008. The index bottomed less than 2 weeks later on 3/09/09 and began a bull market on 3/10/09 that continues to this day (Source: BTN Research).

It’s actually surprising to me that the gap in stock market investment between Millennials and Baby Boomers is not wider given the feeling of unease many in my generation have concerning financial market following the crisis.

Peter Malone, CFA

Research Analyst

Direct: 617.226.0030

Fax: 617.523.8118

Crestwood Advisors

One Liberty Square

Suite 500

Boston, MA 02109

www.crestwoodadvisors.com

BTN 9-17-18.pdf

AAPL: Impact of latest potential tariff and new phones

Updating my last note regarding Apple and tariffs. The latest $200B of tariffs set to take effect on Monday initially were going to impact Apple Watches and Airpods (less than 5% of rev), that changed with the final release. Neither product will be impacted by this round of tariffs.

From: Sarah Kanwal
Sent: Wednesday, September 12, 2018 12:58 PM
To:
Subject: AAPL: Impact of latest potential tariff and new phones

Today Apple is announcing their new product lineup at a 1pm launch event – 3 new phones are expected. Analyst expectations around the new device launches are ratcheting up, with some increasing price targets. This is despite developments on the tariff front that are looking more threatening to Apple. Last week the White House took comments on the latest round of impending tariffs (up to 25% tariffs on $200 billion in Chinese goods). This would be on top the $50B of Chinese exports already hit with 25% duties (which didn’t effect Apple’s products). Apple submitted a comment letter indicating the $200B round of tariffs would affect the Apple Watch, AirPods, MacMini and Apple Pencil. These items account for <5% of Apple’s revenue. So, not a big hit yet. In the letter Apple said, “tariffs increase the cost of our U.S. operations, divert our resources and disadvantage Apple compared to foreign competitors.” The letter also reiterated a lot of what Tim Cook said on Apple’s last earnings call – essentially that tariffs are a tax on the consumer and that they can have broad unintended economic consequences.

Next Trump threatened another $267B in tariffs and suggested Apple should move their manufacturing to the US. In June, the Trump administration said they would not impose tariffs on iPhones, but this next $267B suggests otherwise as that basically implies a duty on all goods imported from China. This could be used to influence Apple to move some manufacturing to the US. Most of Apple’s assembly occurs in China (only about 5% of Apple’s manufacturing takes place in the US) and to shift this would take a lot of money and time. Labor supply in the US would also be a limiting factor. Trump hinted at tax incentives that would help offset the cost of doing this. If more assembly moved to the US, it seems likely that most of the higher labor costs would be passed on to consumers via higher prices. Most estimate price increases in the 15-20% range to offset higher labor. While Apple has a lot of buyer power, their suppliers generally operate on thin margins making it more difficult to push some of this higher cost burden to them. This is illustrated by the chart below (from The Economist) of Apple’s 42 biggest suppliers (representing 75% of Apple supplier gross profits). Apple and the chip suppliers occupy the high value added, high margin portion of this value chain and command 90% of the profit pool. Interestingly, this disparity also illustrates potential risks that come with their complex multinational supply chain. That profit concentration could lead to structurally weaker participants that may have a hard time weathering these trade tensions. The not Apple and not chip (i.e. not US) portion of production has most of the employees and requires lots of capital for PP&E and inventory, but they capture only a small sliver of the profits. Because of this, there may be some financially weaker players in the supply chain. Combining low margins and capital intensity (likely have debt to service) could put some suppliers at risk if costs rise or business from Apple slows as trade issues get sorted out.

Sarah Kanwal

Equity Analyst, Director

Direct: 617.226.0022

Fax: 617.523.8118

Crestwood Advisors

One Liberty Square, Suite 500

Boston, MA 02109

www.crestwoodadvisors.com