Research Blog – INTERNAL USE ONLY

Stryker 3Q19 earnings summary

Current Price: $215 Price target: $240

Position size: 2.79% 1-year Performance: +36%

Key Takeaways:

Stryker released 3Q19 results with organic sales up +8.6%, a sequential decline – if you exclude 1% from the extra selling day – that bears are hanging on to. Pricing was somewhat negative across the segments this quarter, but made up largely by volume growth. The K2M salesforce integration is somewhat slower than expected, impacting the spine segment’s performance, but this should be resolved in the coming quarters. The operating margin improved 50bps y/y thanks to lower SG&A and R&D.

Results by segments:

· Orthopedics organic sales were up +8.8%. There were 51 Mako robots sold (vs. 37 in 3Q18), in spite of the competitive Rosa launch by Zimmer.

· MedSurg organic sales were up +8.8%.

· Neurotechnology and spine organic sales up +7.6%.

The management team reiterated their guidance for the year (7.5-8% organic sales growth), although seeing the higher end as most likely. Overall the thesis on SYK is intact. Continue reading “Stryker 3Q19 earnings summary”

Alphabet Q3 Results

Current Price: $1,257 Price Target: $1,350

Position Size: 4.7% TTM Performance: +18%

Alphabet reported mixed results, beating on the top line and missing on EPS. Revenue growth was +22% ($40.5B vs. consensus of $40.3B) driven by better than expected ad revenue. Net advertising revenue totaled $26.4B compared to consensus at $26.3B. While some cost pressures moderated, they also had some one-time hits that impacted earnings including a $1.5B unrealized loss on investments in other companies. They are an active venture capital investor (Capital G), but didn’t say which investments contributed to the loss. They also took a hit from a $554 million legal settlement in France. TAC as a percent of revenue decreased and capex was lower than expected. Reuters reported yesterday that Google made an offer to buy Fitbit, sending Fitbit shares up 30% yesterday, but mgmt. wouldn’t comment about this on the call.

Key takeaways:

· Interestingly, they’ve recently been evolving the way they talk about their mission. They used to say it was to “organize the world’s information” – now they say, “we’ve evolved from a company that helps people find answers to a company that helps you get things done.” Shift suggests growing focus on cloud, AI and hardware.

· Two significant technology advances:

1. “Dramatic improvement” in their search algorithm b/c of a new type of neural network based technique called BERT. Here’s an article about it: https://techcrunch.com/2019/10/25/google-brings-in-bert-to-improve-its-search-results/

2. Quantum supremacy – Google’s 53-qubit quantum machine, Sycamore, successfully performed a test computation in just 200 seconds that would have taken the most powerful supercomputers many years to accomplish. “Distinct milestone in our effort to harness the principles of quantum mechanics to solve computational problems.” For anyone who is interested, you can learn more about this here: https://www.ft.com/video/48d44362-3926-4111-b19b-037c0394a85c?emailId=5db6d71006676700047a9d10&segmentId=13b7e341-ed02-2b53-e8c0-d9cb59be8b3b&playlist-name=editors-picks&playlist-offset=4

· Top growth drivers were mobile search, YouTube and cloud.

· Key expense lines:

o Higher cost of revenues as a % of sales driven by costs associated with data centers including depreciation, content acquisition costs (primarily for YouTube), and impact of Pixel 3a hardware costs, offset by lower % of TAC.

o Higher than expected opex driven by legal settlement in France. Headcount is also key driver in opex increases. Sizable headcount increase focused on cloud business.

· Google Other Revenues (includes Google Play, Google Cloud, and Hardware)

o $6.4B in revenue vs consensus of $6.3B, up +39% YoY.

o Cloud: No specific detail on cloud. Last quarter they indicated it was at an $8B run-rate. Google had a change in leadership in their cloud business earlier this year and is looking to triple their cloud division sales force over the next few years.

o Announced partnership with Mayo Clinic – they will us Google Cloud to secure and store data and understand insights at scale. The partnership will encompass transforming patient and clinician experiences, identifying new methods of diagnosing diseases, conducting clinical research and finding new models for delivering patient care.

o Hardware:

§ They have long talked about hardware as a growth priority for them.

§ Hardware benefited from the Pixel 3a – their lower priced phone. The phone did a lot better than the more expensive Pixel 3.

§ New products…Nest mini, Pixelbook Go, Pixel 4 and Pixel Buds, similar to air pods.

o Gaming: Stadia, their streaming video game business, will soon be available in the US, UK, Canada, and throughout Europe.

· Other Bets: Waymo continues to progress…expanding in Phoenix and testing long-haul truck driving on Arizona freeways. There will also be heavy-rain testing in Florida and 3-D mapping in Los Angeles.

· Record High Share buybacks – $5.7B in Q3 which brings buybacks to $12.3B YTD. $121B of cash & equivalents on the balance sheet.

Valuation:

· Reasonable valued, trading at >4% FCF yield on 2020.

· $107B in net cash, ~13% of their market cap.

$GOOGL.US

[tag GOOGL]

Sarah Kanwal

Equity Analyst, Director

Direct: 617.226.0022

Fax: 617.523.8118

Crestwood Advisors

One Liberty Square, Suite 500

Boston, MA 02109

www.crestwoodadvisors.com

Visa 4Q Results

Current Price: $179 Price Target: $185

Position Size: 4.2% TTM Performance: 29%

Visa reported better than expected Q4 revenue and EPS. Net revenue was +15% and adj. EPS was +23%, $1.47 vs consensus $1.43. Payments volume growth was strong at +9% (constant currency). They introduced full-year 2020 guidance of net revenue growth of "low double-digits" and EPS growth of “mid-teens.” Guidance in-line with consensus but includes higher client-incentive fees due to a high level of contract renewal activity. In general, growth trends of their key business drivers – payments volume, processed transactions and cross-border volume – have been stable.

Key Takeaways:

· They had 47 billion transactions (+12.6%) on their network driving >$2.27T in total volume, +9%, in line w/ last quarter. Credit was +7% and debit was +11%. Cross border was +7%

· US payments volume growth was ~8% with credit growing 7%and debit 10%.

· International payments volume growth in constant dollars was 10%. The UK remains weak, but growth has now improved for two quarters after hitting a low in March.

· Expanding access with new players – This is critical to expanding credentials and acceptance globally. Deepened relationships with several FinTech partners across the globe including Chime, N26, Railsbank and Toss.

· Teaming up with Samsung to allow merchants to accept contactless payments with just an app download and no hardware. So in essence the phone becomes the terminal.

· Launched common button – they’ve been discussing this for a while. This is a joint effort between AmEx, Discover, MasterCard and Visa of a joint click-to-pay button that makes online checkout easier.

· B2B (Visa Direct) was 12% of volume in 2019. Recent developments in B2B include Visa Direct integration with Oracle ERP that allows customers to make payments directly from the account payable system.

· 2020 FCF should be ~$12B and they anticipate returning at least $12B to shareholders through dividends and stock buybacks.

Valuation:

· Strong FCF continues to support buybacks. Returned $2.7 billion of capital to shareholders in Q4 and $10.9B for the full year.

· Trades at a ~4% FCF yield. Reasonable for a company w/ >50% FCF margins, high ROIC, and, absent a recession, should continue growing top and bottom line double digits.

· Announced a 20% increase in their quarterly dividend to $0.30 – puts the payout ratio in 20%-25% range.

Thesis:

· Visa is the number one credit and debit network worldwide – accounting for about half of all credit and roughly three fourths of all debit card transactions.

· We are still in the earlier innings of the digitization of electronic payments. This is a secular tailwind supporting Visa’s growth as 1.) Electronic payments continue to replace cash 2.) Commerce moves online 3.) Consumer spending grows globally

· Visa’s asset light “toll both” business model is characterized by recurring revenues, high incremental margins, low capital expenditures, and high free cash flow.

· Visa’s recent acquisition of Visa Europe should be a nice tailwind over the next few years as the European market is in the earlier stages of electronic payment adoption and Visa is well positioned to gain market share and improve margins in the region.

$V.US

[tag V]

Sarah Kanwal

Equity Analyst, Director

Direct: 617.226.0022

Fax: 617.523.8118

Crestwood Advisors

One Liberty Square, Suite 500

Boston, MA 02109

www.crestwoodadvisors.com
PLEASE NOTE!

We moved! Please note our new location above!

Fortive (FTV) 3Q19 earnings summary

Current Price: $69.9 Price Target: $86 (NEW – lowered from $91)

Position Size: 2.22% 1-year performance: -6%

Key Takeaways:

Fortive released its 3Q19 earnings, with core sales growth of 2%, thanks to high growth in its Industrial Technologies business, making up for weakness in its short-term cycle businesses. Retail fueling (gas pump upgrading to chip card reader) continues to be a bright spot globally.

The management team further reduced its 2019 guidance, lowering organic sales growth and EPS as macroeconomic trends are worse than expected and possibly could continue into 2020. We are lowering our price target to reflect weaker sales in 2019 and possible continued slowdown in early 2020. Overall we think the long-term thesis around increasing SaaS as a % of revenue and moving away from cyclical businesses is still intact. Continue reading “Fortive (FTV) 3Q19 earnings summary”

MSFT up on JEDI contract

Microsoft won a government contract for cloud computing services that is worth $10B over 10 years. The contract is for the Department of Defense and known as the JEDI contract (Joint Enterprise Defense Infrastructure). This has been in the news for a while as they were vying for the contract primarily with Amazon, who seemed favored to win. The contract itself is not a huge impact to MSFT’s numbers (given $140B in expected revenue in 2020 and the contract is for ~$1B/yr) – the more meaningful impact may be the win opening the potential for other government contracts. And in general it underscores the strength of Microsoft’s Azure cloud offering and its long-term potential. Some analysts are actually calling it a paradigm changer for Microsoft and a “landmark win that will change the cloud computing battle over the next decade.” Others think it is less meaningful given potential political interference in the bidding process and the possibility that Amazon may try to protest the outcome.

Sarah Kanwal

Equity Analyst, Director

Direct: 617.226.0022

Fax: 617.523.8118

Crestwood Advisors

One Liberty Square, Suite 500

Boston, MA 02109

www.crestwoodadvisors.com
$MSFT.US

[tag MSFT]

Travelers Q3 earnings report

On 10/21/19, Travelers reported Q3 EPS of $1.43, well below consensus estimate of $2.34. Shares sold off ~8% on the earnings miss. Travelers missed earnings due to increases in reserves in their business segment due to higher than expected losses in asbestos claims and higher tort cost for general liability and auto. The rising costs appear to be an industry trend. In response business policy renewal rates have increased to 7.4% which Travelers expects will offset the higher cost trend and restore profitability. Travelers seems to be early/leading the industry with increases in reserves.

Travelers is a high quality, disciplined underwriter of insurance that is focused on returning capital to shareholders through dividends and share buybacks. Insurance earnings are historically volatile, so we are maintaining price target and weight, expecting that Travelers will return to its profitability trend.

Current Price: $131.43 Price Target: $155

Position Size: 2.16% TTM Performance: 10.9%

Thesis Intact. Key takeaways from the quarter:

  1. Higher losses on tort related expenses

· Generally, insurance companies record revenue in one period and hold reserves to pay for claims in future periods. If they reserve more than they pay out in claims, the excess reserves will be released as earnings. The reverse happened this quarter for Travelers as claim trends were higher than expected which required an increase reserves.

· Q3 saw adverse development in asbestos claims of $228mm, in general liability of $114 and commercial auto of $134 primarily due to inflation on tort related settlements.

  1. TRV continues to aggressively return capital to shareholders – for 2019 year to date TRV returned $1.8b to shareholders out of $1.8b in earnings
    • Over past 10 year shares outstanding have fallen 53%!
    • Shareholder yield of 7.1% = 2.5% dividend and 4.6% share buyback
    • Management employing capital wisely! Instead of investing in mature business with spotty pricing, they are returning excess capital to shareholders
  1. Some positives in the quarter
    • Importantly, Travelers is increasing prices significantly – up 7.4% – to offset higher costs of future claims
    • Record net premiums of $7.569b up 7%
    • Book value per share $99.21 up 14% from year end 2018
    • Q3 ROE of 6.2% with YTD ROE of 9.6%

4. Valuation of 13 P/E is slightly above the median of its five-year valuation range of 10 – 15.

The Thesis on TRV:

  • We expect TRV will be able to grow book value per share in the mid-single digits over the near-medium term, and generate ROE in the 10-14% range
  • Industry leader with disciplined underwriting and investment portfolio track record
  • Consistent returns in the low to mid double digits
  • Responsible capital allocation and proven desire to act in the best interests of shareholders

Please let me know if you have any questions.

Thanks,

John

($TRV.US)

John R. Ingram CFA

Chief Investment Officer

Partner

Direct: 617.226.0021

Fax: 617.523.8118

Crestwood Advisors

One Liberty Square

Suite 500

Boston, MA 02109

www.crestwoodadvisors.com

Resmed (RMD) 1Q20 earnings results

Key Takeaways:

Current price: $127 Price target: $138

Position size: 2.96% 1-year performance: +28%

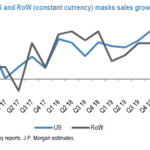
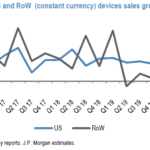
Resmed released impressive global masks sales growth of 19%, most likely grabbing additional market shares. Total sales were +16% (ex-FX), or +11% organic. The management team highlighted positive conditions in all its major markets in Q1 (new product launches, expansion of resupply programs), but we should expect some deceleration going forward, as competitors are launching new products as well, and year-over-year comparison numbers become harder to beat. Devices sales were +8% in the US, gaining market shares in this segment as well, as the digital connected care is gaining traction. Sales were up “only” 4% in the rest of the world, as RMD had tough comparisons y/y.

Gross margin expanded thanks to recent acquisitions, better product mix and some pricing. With strong sales, the company is seeing some nice operating leverage.

We believe the software business the company has been expanding this past few years will provide continued growth for the company, growing from high single digits in Q1 to double digits into fiscal year end.

Overall it was a pretty nice quarter for the company, supportive of our thesis on the name.

Thesis on RMD:

  • Leading position in the underpenetrated sleep apnea space
  • Duopoly market
  • New product cycle
  • Returns of capital to increase: ~1% share buyback/year (back in FY18), dividend yield of 2%

$RMD.US

[tag RMD]

Julie S. Praline

Director, Equity Analyst

Direct: 617.226.0025

Fax: 617.523.8118

Crestwood Advisors

One Liberty Square

Suite 500

Boston, MA 02109

www.crestwoodadvisors.com

MSFT 1Q20 Earnings

Current Price: $139 Price Target: $150

Position size: 6.3% TTM Performance: 38%

Microsoft reported solid Q1 results, beating street high estimates on both revenue and EPS. Street is at the high end of Q2 guidance. The beat was broad based with better than expected growth in all segments. Cloud continues to be the key driver. Q1 revenue was $33B (+14% YoY) and EPS was $1.38 (+21%). Commercial Cloud business was up 39% constant currency and saw continued margin improvement, helping to drive op income up 27%. Counted w/in that is Azure, which was up 63% constant currency. They are taking share from Amazon’s cloud offering, AWS. This should continue as they are better positioned as more large enterprises, that are longtime customers, move to the cloud. Given their enterprise customer base, recent partnerships with SAP, VMware and Oracle, and superior Azure hybrid architecture, the company is uniquely positioned to capitalize on the growing demand for cloud services.

Key Takeaways:

· FY 2020 revenue guided to up double-digits and op margins are expected to increase slightly.

· Solid growth across all 3 segments:

o Productivity & Business Processes, up 13% YoY, $11.1B – driven by strong performance in Office commercial and LinkedIn

o Intelligent Cloud, up 27% YoY, $10.8B – driven by continued strong growth in Azure

o More Personal Computing, up 4% YoY, $11.1B.

· Q1 Commercial Cloud (consisting of O365 Commercial, Azure, Dynamics Online, and LinkedIn Commercial – this includes some revenue from the first two segments above) was $11.6B, up 39% constant currency in the quarter.

· Within Commercial Cloud, Azure growth was +63% YoY constant currency vs. +68% last quarter. That suggests annualized revenue of ~$17B.

· Recently announced partnership with SAP makes Azure the preferred destination for every SAP customer.

· Commercial Cloud gross margins improved 400bps YoY and 100bps sequentially, driven by material improvement in Azure gross margin. Incremental cloud revenues have very high margins and should continue to drive margin expansion.

· Surface Duo – new Android-based dual-screen phone to be available next fall. Could be a promising re-entry into phone space after epic Nokia failure, but w/ Android OS instead of Windows.

Valuation:

· Trading at a 3-4% FCF yield –still reasonable for a company with double digit top line growth, high ROIC and a high and improving FCF margins.

· They easily cover their 1.5% dividend, which they have been consistently growing.

· Strong balance sheet with about $137B in gross cash, and about $51B in net cash.

Investment Thesis:

· Industry Leader: Global monopoly in software that has a fast growing and underappreciated cloud business.

· Product cycle tailwinds: Windows 10 and transition to Cloud (subscription revenues).

· Huge improvements in operational efficiency in recent quarters providing a significant boost to margins which should continue to amplify bottom line growth.

· Return of Capital: High FCF generation and returning significant capital to shareholders via dividends and share repurchases.

$MSFT.US

[tag MSFT]

Sarah Kanwal

Equity Analyst, Director

Direct: 617.226.0022

Fax: 617.523.8118

Crestwood Advisors

One Liberty Square, Suite 500

Boston, MA 02109

www.crestwoodadvisors.com

Hilton 3Q19 Results

Share Price: $94 Target Price: $105

Position Size: 2.8% 1 Yr. Return: 33%

Hilton beat on revenue and EPS, but lowered RevPAR guidance as global macro trends weaken. Despite that, EPS guidance was increased, demonstrating the strength of their asset light business model and strong unit growth. Given their robust development story, they are a lot less dependent on macro driven RevPAR. Their development pipeline is delivering 6-7% unit growth. On 0.4% RevPAR growth in 3Q, they grew EBITDA 9%. Additionally, their pipeline growth is not slowing and has some countercyclical aspects. They plan to return $1.6-$1.8B in capital to shareholders for the year (they’ve returned $1.2B so far), equating to ~7% of their market cap.

Key takeaways:

· System-wide RevPAR of 0.4%, driven by both ADR and occupancy.

· Full year RevPAR guidance lowered to 1% from 1-2% as their broad macro outlook has weakened.

· Saw softness in the US and Asia Pacific. US was +0.4% and Asia Pacific was -2.7% driven by weakness in China. China RevPAR was -5.6% – This includes impact from Hong Kong protests, where RevPAR was down 40%. Mainland China was down <3%.

· Issued 2020 RevPAR guidance of 0% to +1%. Expect 2020 net unit growth of 6-7% range.

· During the quarter they completed the sale of the Hilton Odawara Resort & Spa and subsequently entered into a 30-year management contract with the purchaser of the hotel.

· Solid net unit growth continues to drive strong performance. Pipeline of 379K rooms (>2,500 hotels throughout 111 countries). Over 200K of these hotels are outside the US and more than 50% are already under construction.

· Current pipeline represents close to 40% unit growth. With expected annual growth of about 6%, their pipeline is several years’ worth of growth with about half of it already under construction. More than 90% of their deals do not require any capital from them.

· Continued improvement in their market leading RevPAR index – RevPAR index is RevPAR premium/discount relative to peers adjusted for chain scale. They are the market leaders – this is helpful because it’s what leads to pipeline growth (hotel operators want to associate w/ the brand that yields the best rates and occupancy) and is helpful in a macro downturn because it’s even more crucial for a developer to be associated with a market leading brand to get financing. i.e. they would likely take more pipeline share if lending standards tighten. The other countercyclical aspect of their pipeline growth is conversions (an existing hotel changes their banner to Hilton).

· Tru is a fast growing new brand for them which management says has the opportunity to be much bigger than Hampton Inn. Hampton Inn is their largest brand with over 250K rooms. Demonstrating the strength in both new and existing brands: Tru has a RevPAR index of 130 (the highest brand premium in the industry) and Hampton (35 year old brand) has a RevPAR index of 120 – and a pipeline of more than 700 hotels.

· In a sensitivity analysis to a market downturn, mgmt. said they would expect flat to slightly positive growth in adjusted EBITDA and positive growth in free cash flow in an environment where RevPAR were to decline 5% to 6%. This is b/c Hilton is structurally different than it was last cycle – asset light means less operating leverage and less volatile earnings stream if RevPAR continues to weaken. Moreover, unit growth will aid EBITDA growth regardless of RevPAR trends.

· Loyalty members hit 99m and account for >60% of system-wide occupancy.

· The stock is undervalued, trading at ~6% FCF yield on 2020.

Investment Thesis:

∙ Hotel operator and franchiser with geographic and chain scale diversity of 17 brands, 5,900 hotels and 939k rooms across 114 countries (Hilton, DoubleTree, Hampton Inn & Hilton Garden Inn ≈ 80% of portfolio).

∙ Network effect moat of leading hotel brand and global scale lead to room revenue premiums and lower distribution costs.

∙ Shift from hotel ownership to franchising results in resilient, asset-light, fee-based model.

∙ Record pipeline generating substantial returns on minimal capital will lead to increasing ROIC and a higher multiple.

∙ Unit growth and fee based model reduce cyclicality – Lower operating leverage vs ownership reduces earnings volatility and unit growth offsets potential room rate weakness.

∙ Generating significant cash which is returned to shareholders through dividends and buybacks.

$HLT.US

[tag HLT]

Sarah Kanwal

Equity Analyst, Director

Direct: 617.226.0022

Fax: 617.523.8118

Crestwood Advisors

One Liberty Square, Suite 500

Boston, MA 02109

www.crestwoodadvisors.com