Research Blog – INTERNAL USE ONLY

HLMEX – Q1 2018 Commentary

HLMEX – Q1 2018 Commentary

Harding Loevner Institutional Emerging Markets had a strong quarter outperforming its benchmark and a large majority of its peers. The strategy benefited from strong stock selection and remains cautiously optimistic about current synchronized global growth. The team continues to drive alpha through its focus on high quality growth companies.

Continue reading “HLMEX – Q1 2018 Commentary”

Crown Castle International ($CCI.US) Q1 2018: CCI exceeds high end of revenue guidance, falls short of AFFO consensus

Crown Castle International Corp. (CCI) had a strong quarter increasing yoy revenue by over 34%, exceeding the high end of guidance. AFFO per share was up 24% but fell short of broad estimates. Discussing a possible S/MTUS merger, management noted overlapping sites account for about 5% of total revenue. CCI maintains a target dividend growth rate of 7-8% annually. The company continues to work on balance sheet improvement and has reduced its leverage ratio to 5.1x. Investment has been focused on small cell and fiber where they expect long term growth trends to be in the low double digits.

Current Price: $102 TTM Return: 10.4%

Target Price: $125 Position Size: 2%

Continue reading “Crown Castle International ($CCI.US) Q1 2018: CCI exceeds high end of revenue guidance, falls short of AFFO consensus”

TIPS – How they work and our thoughts

For those that have received questions about the relevance of owning TIPS during periods of increasing inflation, I have broken down how they work and why we do not own them at this time.

Conclusion: why we do not currently own TIPS

1.) We do not anticipate annual inflation above 2.14% over next ten years (breakeven at parity)

2.) TIPS performance driven by factors similar to Treasuries

3.) TIPS are an expensive insurance; drastically underperform during periods of low inflation

Continue reading “TIPS – How they work and our thoughts”

J&J reported 1Q18 earnings: new product launches are driving their pharma segment growth

Thesis intact. Key takeaways:

JNJ reported 1Q18 earnings results that showed the strength and breadth of its portfolio, with good performance in Pharma (Stelara and Zytiga offsetting Remicade deceleration). However, the sales beat was driven by a greater positive FX impact than expected, rather than operational outperformance. The company-wide organic sales growth was 4.3%, a modest acceleration from +4.2% in 4Q17. JNJ’s raised its 2018 operational sales growth guidance by 50bps to 4%-5% and affirmed its EPS guidance of $8.00-$8.20. The management team intends to use the extra cash from the lower tax rate for additional R&D spending. On the call it was clarified however that the pursuit of better organic growth rate will not deter from looking for more M&A targets, as it remains core to its growth strategy. In the next 5 years, the company plans to implement various supply chain actions to reduce complexity and improve cost competitiveness, resulting in $0.06-$0.08B in annual pre-tax savings. These savings will help offset some pricing pressure or internal investments.

Continue reading “J&J reported 1Q18 earnings: new product launches are driving their pharma segment growth”

FT article on effect of tariffs and global savings glut

As a guest writer for the FT, Michael Pettis argues that tariffs will reduce global growth rather than fix trade deficits.  He focuses on capital account flows rather than trade flows as the key issue in the imbalances facing the global economy.

Tariffs increase savings in a world already drowsy with too much savings _ FT Alphaville Continue reading “FT article on effect of tariffs and global savings glut”

S&P 500 Valuations

S&P 500 market valuations (based on forward P/E) have fallen from 20 to 16.7 since the start of 2018.

The drop is due to an increase in earnings estimates and drop in market prices (about 2 points). If you look at the below chart which goes back to 2007, the stock market valuation has fallen significantly and is now within one standard deviation of the historical mean.

However, some caution is necessary. The above uses estimated future earnings.

If we look at trailing earnings, the picture is different, as valuations are more than one standard deviation outside of the historical average.
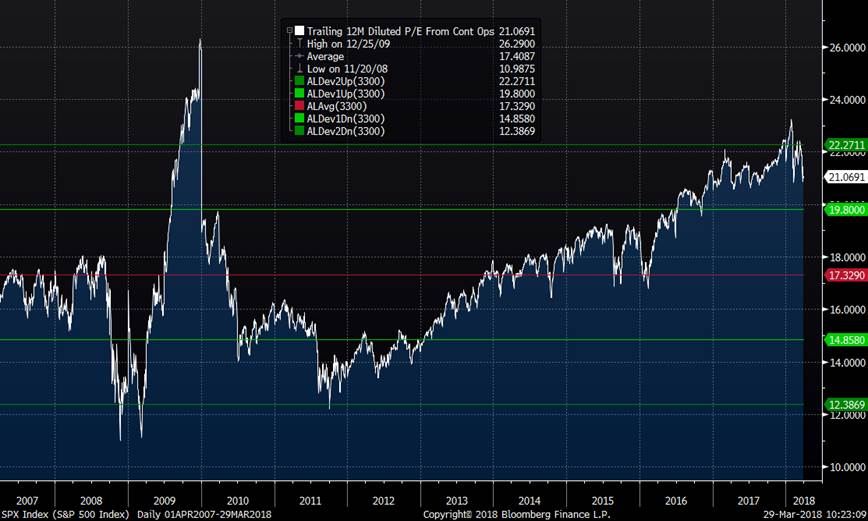
So, markets are closer to average valuation based on the idea that tax cuts and a relatively strong economy will deliver solid earnings growth. Though this expansion is aging, we see no signs of a recession.

Additionally, it appears some of the market froth has been removed. Some of the “less rationale” investments have shown even larger corrections than the broad market – Bitcoin, Tesla and some tech stocks.

This is the type of environment where we should benefit from positions in quality names.

Peter Malone, CFA

Research Analyst

Direct: 617.226.0030

Fax: 617.523.8118

Crestwood Advisors

One Liberty Square

Suite 500

Boston, MA 02109

www.crestwoodadvisors.com

PLEASE NOTE!

We moved! Please note our new location above!

S&P US Fund Scorecard and Persistence reports

S&P does a great job of reporting performance on the mutual fund industry as they scrub their data to account for mutual funds that were closed or merged.  Fund companies tend to close or merge underperforming funds.

Outperformance is rare especially over several years.  Over 5 years 84% of large cap managers, 85% of mid cap manager and 91% of small cap manager underperformed their S&P benchmarks!

file:///C:/Users/JRI/Downloads/spiva-us-year-end-2017.pdf

Equally dreadful, few funds show persistence of strong performance.  Fund’s record of staying in the top quartile is generally lower than change would suggest.  Over the past five year period no large cap, mid cap, or small  cap funds managed to remain in the top quartile through out measurement period:

file:///C:/Users/JRI/Downloads/persistence-scorecard-december-2017.pdf